#parallelcoordinates search results
Classroom exercise: choose a 10-color palette + background color that work okay for thin lines (can u do better?) #parallelcoordinates

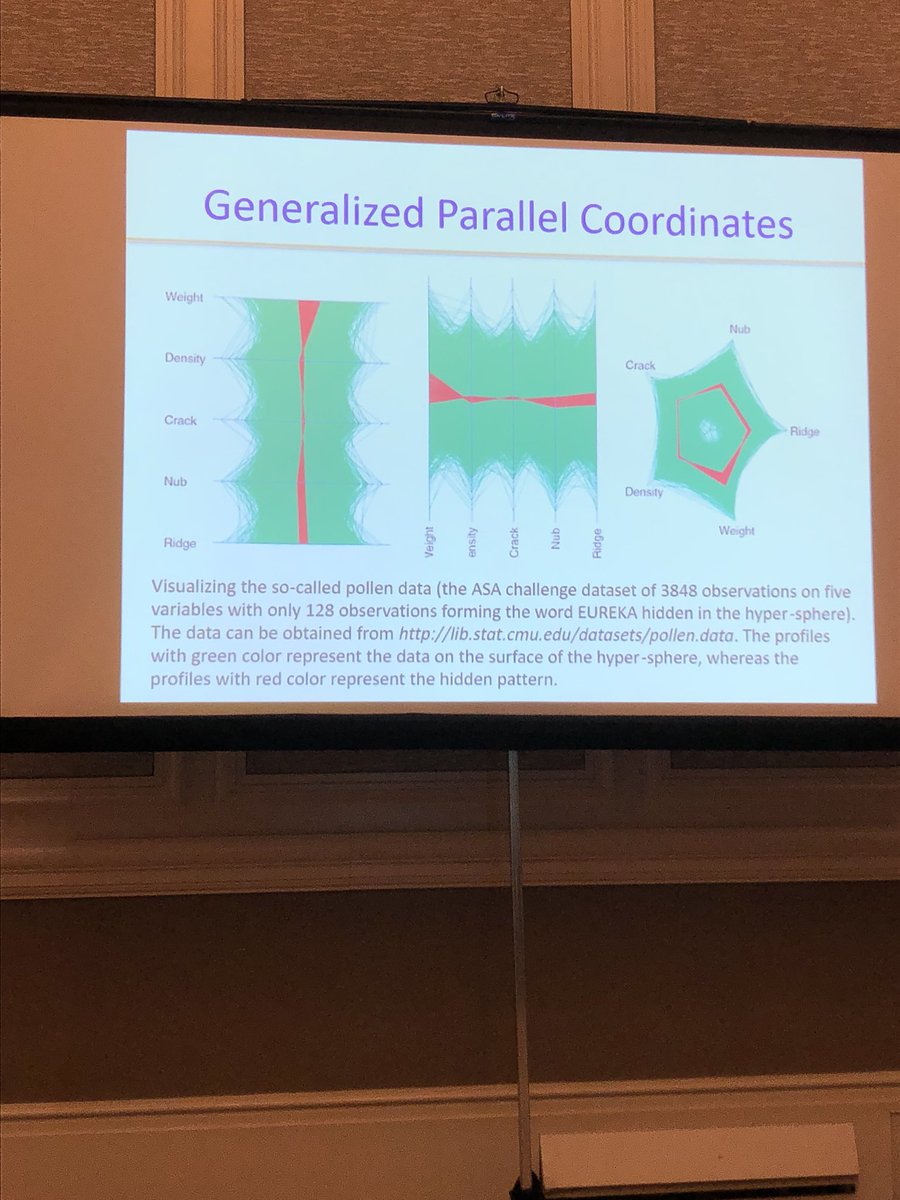
Beautiful pattern in #parallelcoordinates when #visualization real #data. So, what's the #correlation?

Feeling Excited and Blessed remain atop the list of @facebook feelings week after week #ParallelCoordinates #dataviz

#ParallelCoordinates are nice bc there’s no information loss #VisualAnalytics @docchad #SDSS2018 #DataViz


NEW PAGE - Parallel Coordinates Plot: datavizcatalogue.com/methods/parall… #ParallelCoordinates #Dataviz #Datavisualization #Plot #Graph

Did i ever mention that i love #parallelcoordinates viz for data analysis? How to get started? 1) Create a report in @googleanalytics analysis tool 2) Download github.com/syntagmatic/pa… 3) Open "/examples/upload.html" in FF


🔍 Sneak peek at one of our new features of our intelligence asset management platform #Canopy. The #parallelcoordinates chart allows you to visualise under which conditions sensors show abnormal behaviour. #DataAnalytics #Renewables #AI #Data #windturbines #MachineLearning
Curious who makes up our #JMPDiscoverySummit community? Check out the digital version of our interactive data wall at public.jmp.com @JMP_software #parallelcoordinates #dataviz

Get started with interactive parallel coordinates plots 📈 using Parasol. Read about the docs and tutorials here: waterprogramming.wordpress.com/2019/06/04/par… #dataviz #parallelcoordinates #d3
5️⃣ Parallel Coordinates Plot Visualize multi-dimensional data with parallel coordinates plots! Each variable is an axis, and data points are lines intersecting the axes, revealing patterns and relationships. #ParallelCoordinates #EDA
4 dimensional polytobe ... what??! Blowing my mind @OpenVisConf @syntagmatic #parallelcoordinates
Does anyone use #parallelcoordinates for #bigdata #dataviz/#datavis?
Visualizing with the #ParallelCoordinates Plot is Easy! 🏄 Find it on KNIME Hub: kni.me/n/4_hp9UWM2aGT… #KNIME #VisualProagramming lets you visualizes in a few clicks many columns in your data! 📊 #opensource #lowcode #nocode #lowcodenocode #data #datascience #dataviz
Juste génial : visualisation de @jcukier pour explorer le 1er tour #elections #datavis #parallelcoordinates jeromecukier.net/projects/elect…
@joemako I like your #parallelcoordinates #dataviz @tableau. Is there a way to reorder the coordinates? public.tableau.com/profile/joe.ma…
Linked graph showing DNS traffic: bit.ly/1DM82Ra #parallelcoordinates #analytics #secviz #smalldata
5️⃣ Parallel Coordinates Plot Visualize multi-dimensional data with parallel coordinates plots! Each variable is an axis, and data points are lines intersecting the axes, revealing patterns and relationships. #ParallelCoordinates #EDA
🔍 Sneak peek at one of our new features of our intelligence asset management platform #Canopy. The #parallelcoordinates chart allows you to visualise under which conditions sensors show abnormal behaviour. #DataAnalytics #Renewables #AI #Data #windturbines #MachineLearning
Get started with interactive parallel coordinates plots 📈 using Parasol. Read about the docs and tutorials here: waterprogramming.wordpress.com/2019/06/04/par… #dataviz #parallelcoordinates #d3
Curious who makes up our #JMPDiscoverySummit community? Check out the digital version of our interactive data wall at public.jmp.com @JMP_software #parallelcoordinates #dataviz

Did i ever mention that i love #parallelcoordinates viz for data analysis? How to get started? 1) Create a report in @googleanalytics analysis tool 2) Download github.com/syntagmatic/pa… 3) Open "/examples/upload.html" in FF

#ParallelCoordinates are nice bc there’s no information loss #VisualAnalytics @docchad #SDSS2018 #DataViz


NEW PAGE - Parallel Coordinates Plot: datavizcatalogue.com/methods/parall… #ParallelCoordinates #Dataviz #Datavisualization #Plot #Graph

Classroom exercise: choose a 10-color palette + background color that work okay for thin lines (can u do better?) #parallelcoordinates


@joemako I like your #parallelcoordinates #dataviz @tableau. Is there a way to reorder the coordinates? public.tableau.com/profile/joe.ma…
Feeling Excited and Blessed remain atop the list of @facebook feelings week after week #ParallelCoordinates #dataviz

Linked graph showing DNS traffic: bit.ly/1DM82Ra #parallelcoordinates #analytics #secviz #smalldata
Does anyone use #parallelcoordinates for #bigdata #dataviz/#datavis?
Classroom exercise: choose a 10-color palette + background color that work okay for thin lines (can u do better?) #parallelcoordinates

NEW PAGE - Parallel Coordinates Plot: datavizcatalogue.com/methods/parall… #ParallelCoordinates #Dataviz #Datavisualization #Plot #Graph

#ParallelCoordinates are nice bc there’s no information loss #VisualAnalytics @docchad #SDSS2018 #DataViz


Beautiful pattern in #parallelcoordinates when #visualization real #data. So, what's the #correlation?


Feeling Excited and Blessed remain atop the list of @facebook feelings week after week #ParallelCoordinates #dataviz

Curious who makes up our #JMPDiscoverySummit community? Check out the digital version of our interactive data wall at public.jmp.com @JMP_software #parallelcoordinates #dataviz

Did i ever mention that i love #parallelcoordinates viz for data analysis? How to get started? 1) Create a report in @googleanalytics analysis tool 2) Download github.com/syntagmatic/pa… 3) Open "/examples/upload.html" in FF

🔍 Sneak peek at one of our new features of our intelligence asset management platform #Canopy. The #parallelcoordinates chart allows you to visualise under which conditions sensors show abnormal behaviour. #DataAnalytics #Renewables #AI #Data #windturbines #MachineLearning
Get started with interactive parallel coordinates plots 📈 using Parasol. Read about the docs and tutorials here: waterprogramming.wordpress.com/2019/06/04/par… #dataviz #parallelcoordinates #d3
Something went wrong.
Something went wrong.
United States Trends
- 1. Chiefs 48.7K posts
- 2. Mahomes 11.6K posts
- 3. Colts 21K posts
- 4. Steelers 35.4K posts
- 5. Caleb 30.1K posts
- 6. Jameis 8,960 posts
- 7. Lamar 17.5K posts
- 8. Drake Maye 7,280 posts
- 9. Flacco 3,632 posts
- 10. #GoPackGo 3,475 posts
- 11. #HereWeGo 4,241 posts
- 12. DJ Moore 1,703 posts
- 13. Marcus Jones 1,744 posts
- 14. #Bears 5,211 posts
- 15. #Skol 2,059 posts
- 16. Daniel Jones 1,745 posts
- 17. Micah Parsons 1,142 posts
- 18. #OnePride 2,230 posts
- 19. Jaxon Smith 2,085 posts
- 20. Tony Romo 1,698 posts


