
DEEPSHA MENGHANI
@bigdatadipper
Data Scientist at Microsoft #RStats #QuartoPub #DataViz … Opinions are my own. Pronouns - she/her
You might like


Day 8 - Africa #30DayMapChallenge - Uganda reported water source locations Source: @WaterPointData through #tidytuesday @observablehq notebook: observablehq.com/d/198517ad5493… #DataViz


You won't believe this map of South America's rivers that I made 🤯. It shows the different sizes of the rivers using HydroSHEDS data. Look at the Amazon river. It's huge! 😍 Watch my video to learn how I did it and some cool tips for your own projects:🔗lnkd.in/eczCDTkd…


@TheRealRoyKent I do hope someone has shared the best data analysis with you ever done by @bigdatadipper. Fucking brilliant. youtu.be/AbuK2F57NEs?si…

youtube.com
YouTube
Unlock the Power of DataViz Animation and Interactivity in Quarto -...

#TidyTuesday | Week 1 | Bring your own data (BYOD) Visualizing my past running 🏃♂️data using Strava's API and the GitHub (dark mode) code contribution chart for design inspiration. code: github.com/curatedmess/Ti… #rstats #dataviz

It was really fun to create a customer service chatbot with #OpenAI and #Python. Here's the first in-depth setup article on the steps and I am excited to for the next one - Fine tuning it with actual customer service support query dataset. Article 1: medium.com/@menghani.deep…

#TidyTuesday week 50 - Holiday movies. Made a card-style graphic. Code for Interactive chart: observablehq.com/d/056bc8b01406… #dataviz


Are there any Bay Area events focused on startups planned for next quarter (Jan - Mar)?
#30DayMapChallenge - That’s a wrap folks. These challenges are so helpful to learn new things and most importantly to find that amazing community of support and growth. @observablehq collection of all plots: observablehq.com/collection/@de…


#30DayMapChallenge | #Day30 | Favorite Finally did it! 3D population density map. I've wanted to do this for a very long time, but as a non-programmer, it was a difficult task. Thanks to @milos_agathon for your tutorials; they helped a lot. #RStat #QGIS #3D #Maharashtra


Hey #Azure #DataFactory fans!! Just dropped another new #MicrosoftFabric video. Looking to learn ADF & Synapse concepts in Fabric Data Factory? Here is a video I put together to help get you started and it's less than 15 mins long, yay! @AzDataFactory youtube.com/watch?v=L59Ah_…

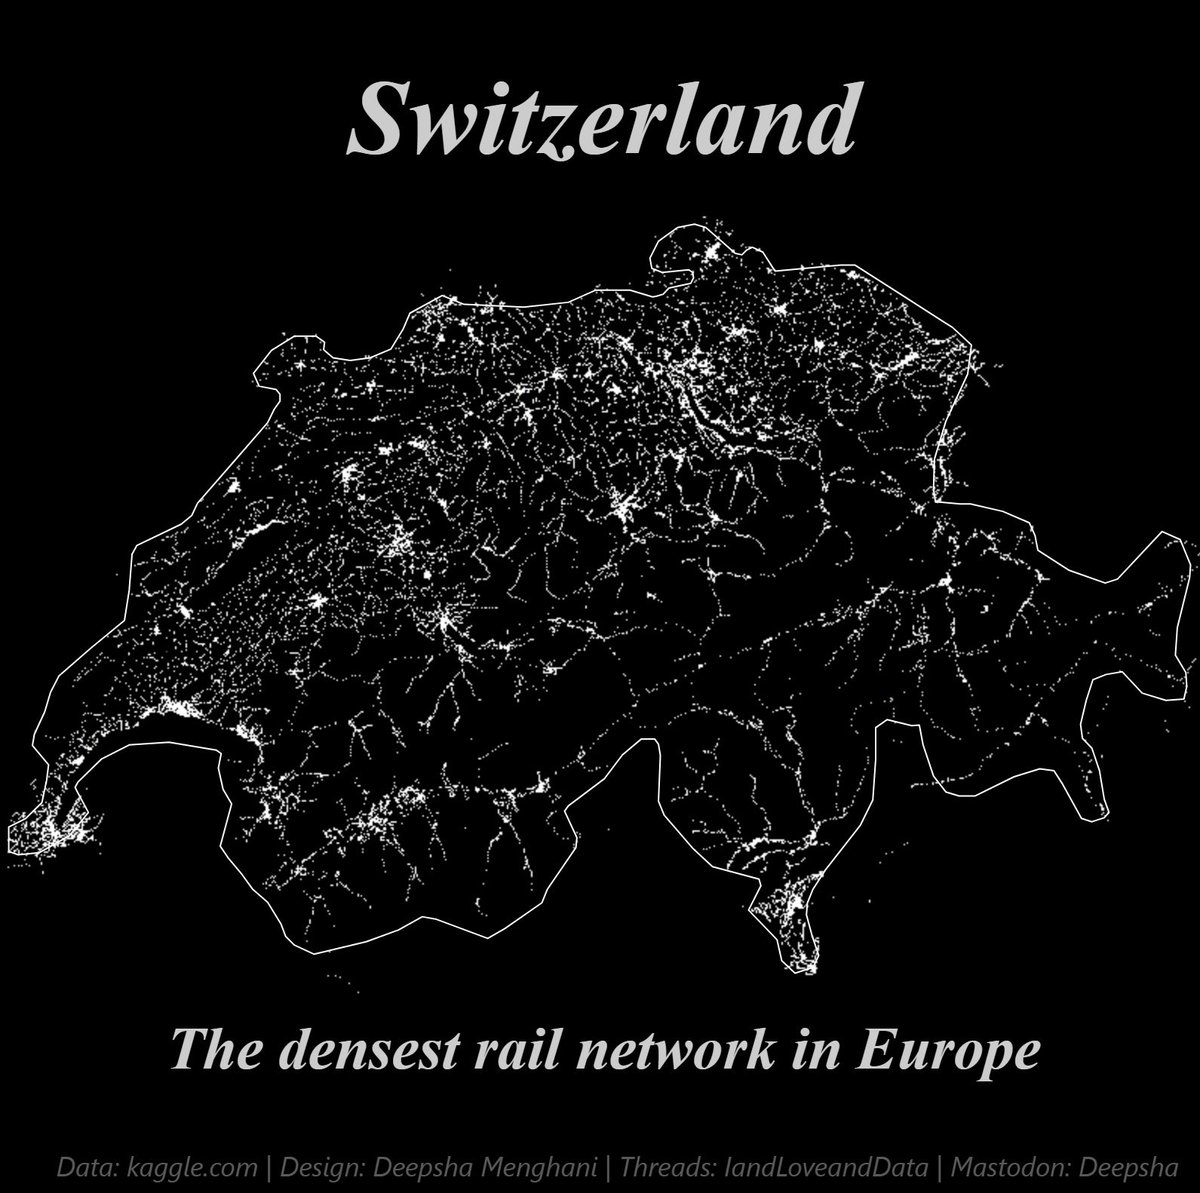
Day 30 - #30DayMapChallenge coming to a close with my favorite… the rail network in Europe, so I plotted the densest one! @observablehq code: observablehq.com/d/3387899f3101…
Day 29 - population #30DayMapChallenge - the stark difference in Washington county land area and population concentration @observablehq notebook: observablehq.com/d/e862d99f7fdd…
I’m so excited to be speaking at R-ladies for the first time, it is a community that helped me grow!

📢 Register in 2024 for "Shiny for Python" with @bigdatadipper 💜👩🏽💻 as she shows us how to get started with its, ui elements, server reactivity, plotting widgets and styling of your shiny dashboards. #pythonprogramming #rstats #womenintech #WomenInSTEM meetup.com/rladies-gaboro…
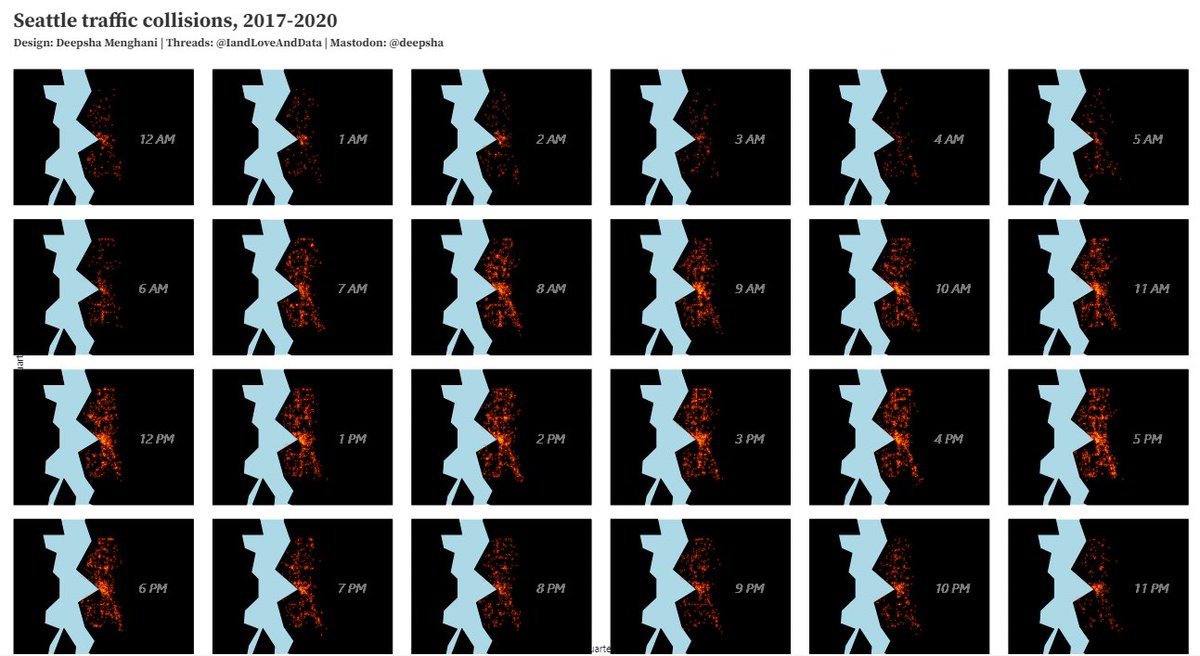
Day 28: chart or map #30DayMapChallenge This right here is the reason I leave for work at 6:30 as after that even 5 min delay in leaving leads to additional 15 min delay in arrival! @observablehq plot: observablehq.com/d/4649e9509a44…
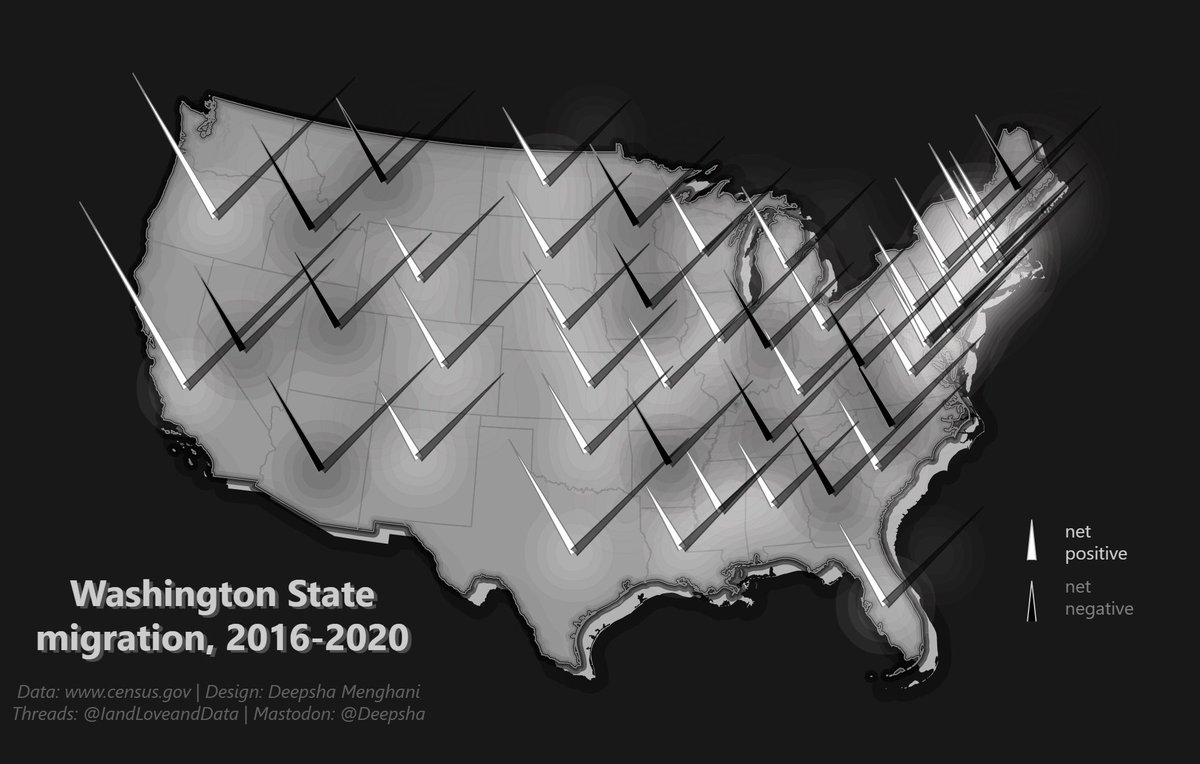
Day 24: B&W #30DayMapChallenge Washington state, where are the people coming from and leaving to. @observablehq code: observablehq.com/d/aac5c362caaf…

#30DayMapChallenge Day 23 – 3D #gif shows the monthly variations in tropospheric Nitrogen Dioxide column in and around India from November 2022 to October 2023. (1/3) #gis #map #nitrogendioxideconcentration #airquality #sentinel5p #no2
#30DayMapChallenge | #Day23 | 3D An extensive collection of global earthquake events with magnitude 5.5 or higher (2000-2020) Made with: @f_l_o_u_r_i_s_h #3D #Map #Globe #Earthquake


United States Trends
- 1. Blue Origin 7,534 posts
- 2. Megyn Kelly 29.5K posts
- 3. New Glenn 8,512 posts
- 4. Vine 33.3K posts
- 5. Senator Fetterman 18.2K posts
- 6. CarPlay 4,335 posts
- 7. #NXXT_JPMorgan N/A
- 8. Brainiac 5,152 posts
- 9. Portugal 61.3K posts
- 10. World Cup 99.6K posts
- 11. Matt Gaetz 13.5K posts
- 12. Padres 28.4K posts
- 13. GeForce Season 1,043 posts
- 14. Eric Swalwell 25.4K posts
- 15. Black Mirror 5,168 posts
- 16. Katie Couric 9,639 posts
- 17. Osimhen 99.6K posts
- 18. Man of Tomorrow 5,774 posts
- 19. Cynthia 111K posts
- 20. Apple TV 8,412 posts


Something went wrong.
Something went wrong.