
datavizpyr
@datavizpyr
Data Analysis to Visualisation with Python and R. Tune in for two DataViz tips per day - one in Python and and the second in R
قد يعجبك


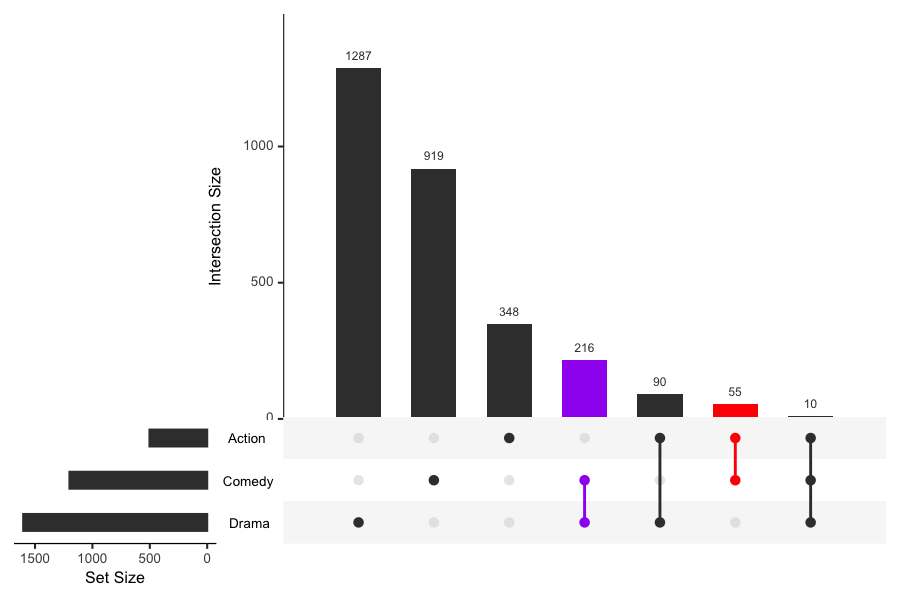
Have more than two/three sets to visualize intersections? Ditch complex venn-diagrams or banana diagrams, use UpSet plot. Here is a tutorial to get started on using UpSet plot to visualize intersections with R datavizpyr.com/visualizing-in… # rstats
Legends in ggplot2 are powerful but can sometimes clutter your visualization. Learn how to hide all legends, remove specific ones like color or shape, control them at the layer level, and even tidy them with scale functions. datavizpyr.com/selectively-re… #dataviz #ggplot2
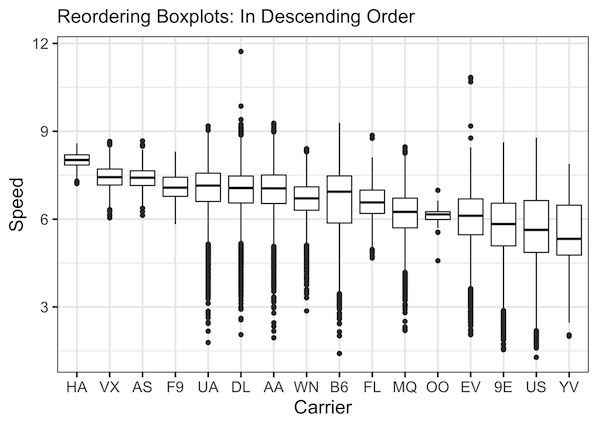
Reorder Boxplots in R (ggplot2) datavizpyr.com/reorder-boxplo…
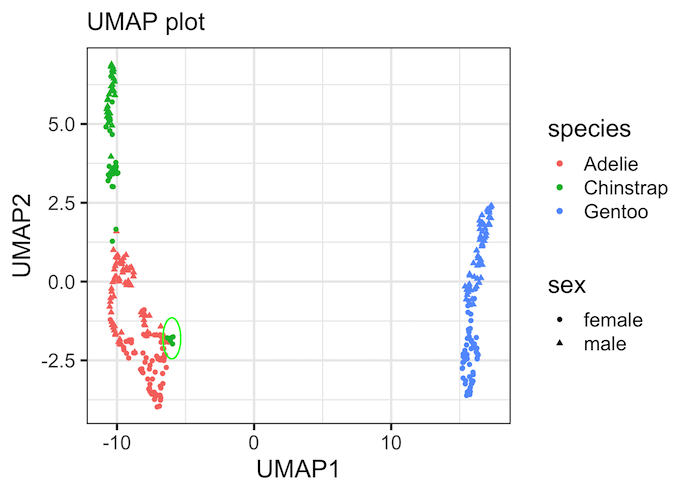
UMAP with R datavizpyr.com/how-to-make-um… #rstats

I am beyond excited to announce that ggplot2 4.0.0 has just landed on CRAN. It's not every day we have a new major hashtag #ggplot2 release but it is a fitting 18 year birthday present for the package. Get an overview of the release here: tidyverse.org/blog/2025/09/g…

Want to connect paired data points in a scatter plot using Matplotlib? This step-by-step tutorial shows you how to draw lines between paired observations so you can easily visualize before–after / them-now comparison datavizpyr.com/connect-paired… #dataviz #Python

How to Connect Paired Points on Boxplots with Lines in ggplot2 datavizpyr.com/how-to-connect… #ggplot2 #dataviz
Remove "the annoying" Space between Legend at Bottom and x-axis in ggplot2 datavizpyr.com/remove-space-b… #rstats #dataviz
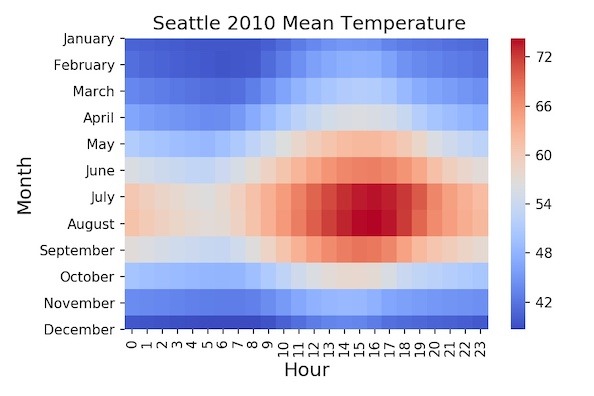
Guide to Heatmaps with Seaborn in Python. datavizpyr.com/heatmaps-with-… #DataViz #Python
Selectively Remove or Hide Legends in ggplot2 – Theme, Guides, Scales & Tips datavizpyr.com/selectively-re… #rstats #dataviz
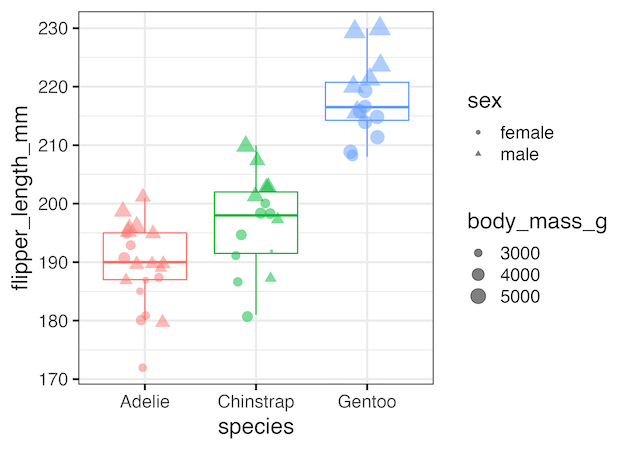
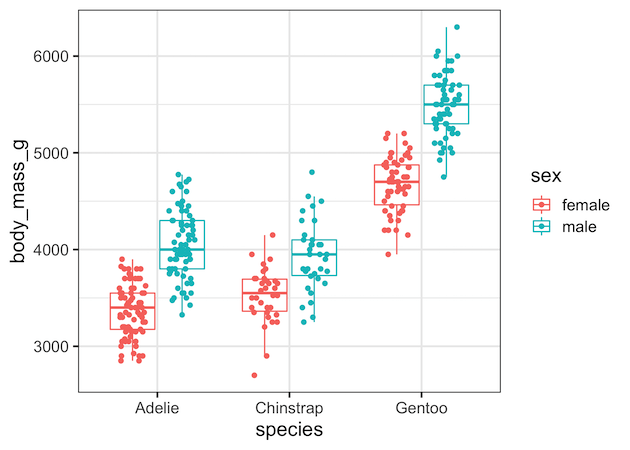
Grouped Boxplot with jittered points: A Complete Guide datavizpyr.com/how-to-make-gr… #dataViz #ggplot2 #rstats
EV or Gas Car: Which one should one buy. calclabhq.com/ev-vs-gas-car-…
Make UMAP plot in R How to make UMAP plot in R #rstats #generative datavizpyr.com/how-to-make-um…
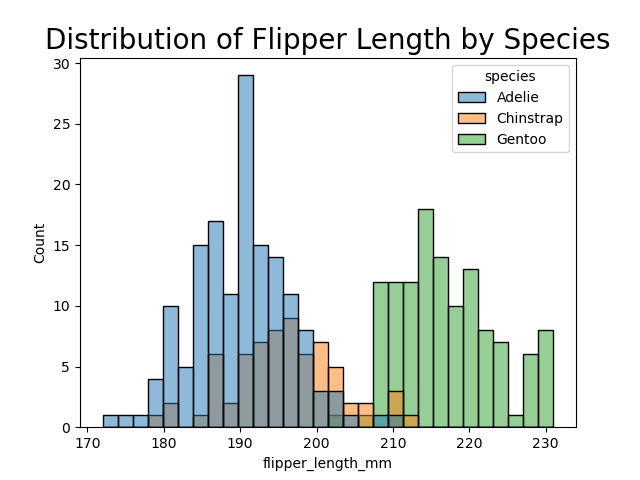
Learn to make Histograms with Pyhton datavizpyr.com/histograms-wit… #Pyhton #dataviz
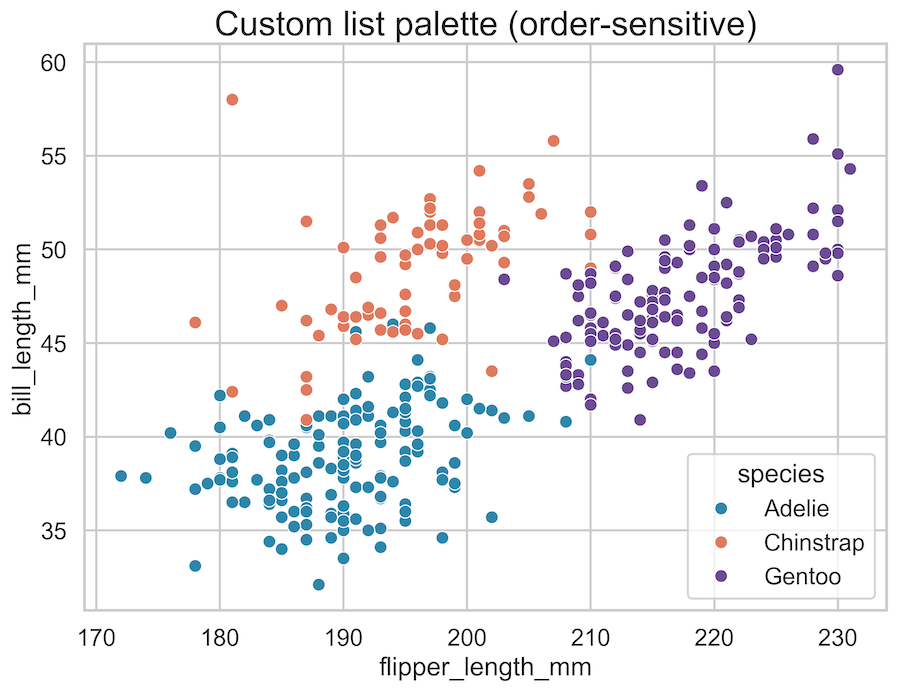
How to Change Colors in Seaborn (Custom Palettes and Manual Colors) datavizpyr.com/manually-speci… #Python #Dataviz
How To Fold Legend into Multiple Rows/Columns in ggplot2 datavizpyr.com/fold-legend-in… #rstats #dataviz
datavizpyr.com
How to Wrap Long Legends into Multiple Rows/Columns in ggplot2
Learn how to fold long legend in ggplot2 into two or more rows using guides() function with guide_legend() argument.
ggplot2 Guide & Cookbook (R): Geoms, Scales, Labels, Themes, Facets datavizpyr.com/ggplot2 #rstats #dataviz #tidyverse
ggplot2 Boxplot AI Workflows: A Modern Guide #ggplot2 #AIprompts datavizpyr.com/ggplot2-boxplo…
datavizpyr.com
Boxplots in R with ggplot2: Manual vs AI vs Hybrid Approaches
Manual vs AI vs Hybrid workflows for creating ggplot2 boxplots in R. Which is faster, better, and more effective for data visualization in the AI era?


United States الاتجاهات
- 1. #AEWFullGear 66.4K posts
- 2. Klay 16.4K posts
- 3. Lando 86K posts
- 4. LAFC 13.3K posts
- 5. #LasVegasGP 166K posts
- 6. Hangman 8,844 posts
- 7. Swerve 5,895 posts
- 8. Samoa Joe 4,132 posts
- 9. Gambino 1,500 posts
- 10. Ja Morant 6,908 posts
- 11. Bryson Barnes N/A
- 12. Benavidez 15.1K posts
- 13. #byucpl N/A
- 14. Utah 23.4K posts
- 15. LJ Martin 1,208 posts
- 16. Max Verstappen 44.3K posts
- 17. Mark Briscoe 4,201 posts
- 18. Hook 21.2K posts
- 19. Fresno State N/A
- 20. Haney 27.4K posts


Something went wrong.
Something went wrong.