#chartjs نتائج البحث


Week 7 of 8 Web-Development 🚀 Working on my Expense Tracker Dashboard in React Integrating Chart.js for visualizing spending trends 💹 This app will let you track your daily expenses and view monthly summaries #WebDev #ReactJS #ChartJS #Frontend #Dashboard #ExpenseTracker


¡Nuevo video en el canal! 🔥🔝🔥 ¿Quieres mostrar gráficas en tu proyecto #Angular ? ¡Lo puedes hacer gracias a #chartjs! ¡Darle amor! ❤️❤️❤️


I can never decide between verbose tables of data, and nice charts. So I built a little #vuejs component to allow you to switch between them. Pieces of #tailwindcss and the classic #chartjs.


共通部分は変数に、微妙に違うやつは関数にするの気持ちいいー! 返り値のオブジェクトにプロパティ追加はreactでおなじみの書き方 2ページに4つのグラフをchart.jsで表示する cfg配列だいぶすっきり♡ トリガー表示するため実行関数は監視関数に渡して完成! #web制作 #webデザイン #chartjs


Chart js ile sütun grafiği ile dinamik değer gösterme. Sol tarafta ajax ve php çalışıyor. Otomatik olarak veritabanında değerleri güncelliyor. #chartjs #javascript

#SocialSprinkler Profile Dashboard page I've been stubbing out trying to figure out the responsive design side. #TaildwindCss and #ChartJs were the trickier parts to this.

(Chart.js) Bar chart context.element.height is NaN at initial render stackoverflow.com/questions/7500… #vuechartjs #chartjs #javascript #vuejs


Yesterday I used Chart.js for the first time in the Budget Management project I've been working on. It's incredible for real-time data visualization! Thanks, @asktaiga_ai, for the support!🙌 Stay tuned for more updates! it just needs a few more magical touches✨ #chartJS


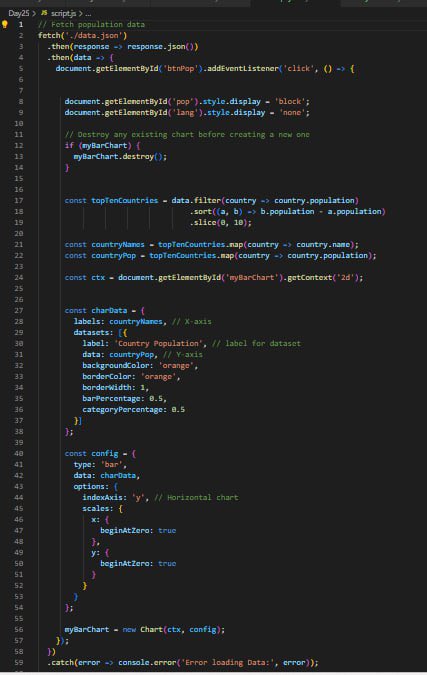
Day 25 of #30DaysOfCode! Today I worked with #APIs & created interactive bar charts using #ChartJS 🎨 It’s been exciting to see the data come to life! Ready to conquer the final stretch 💪 #JavaScript #FrontendDev #WebDevelopment #TechJourney #CodingChallenge


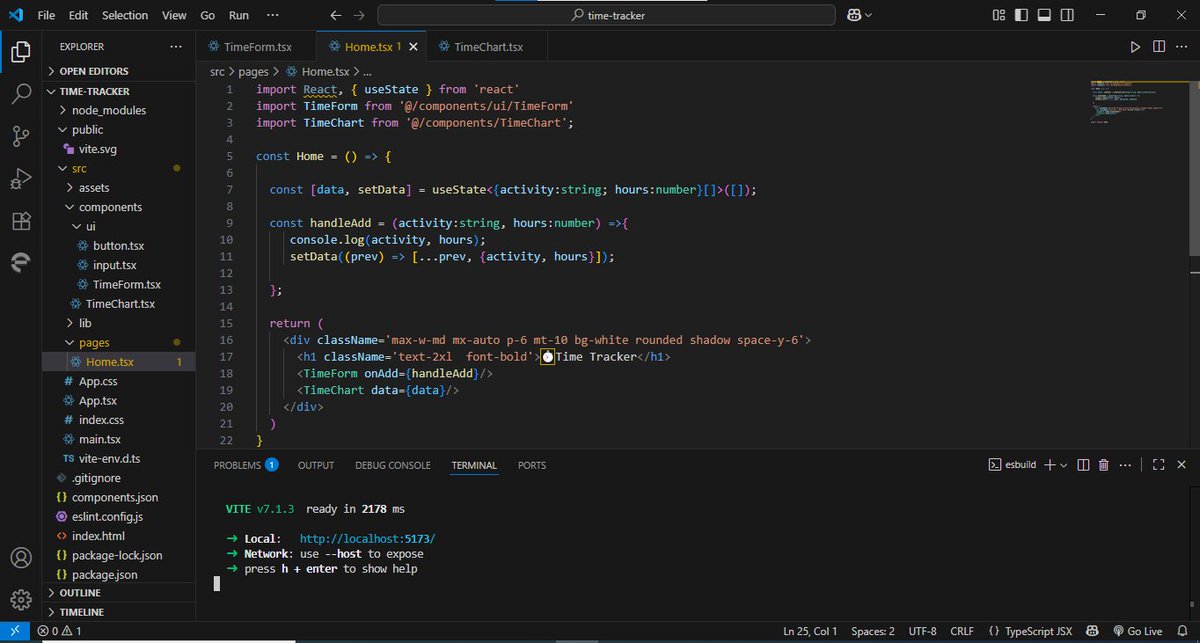
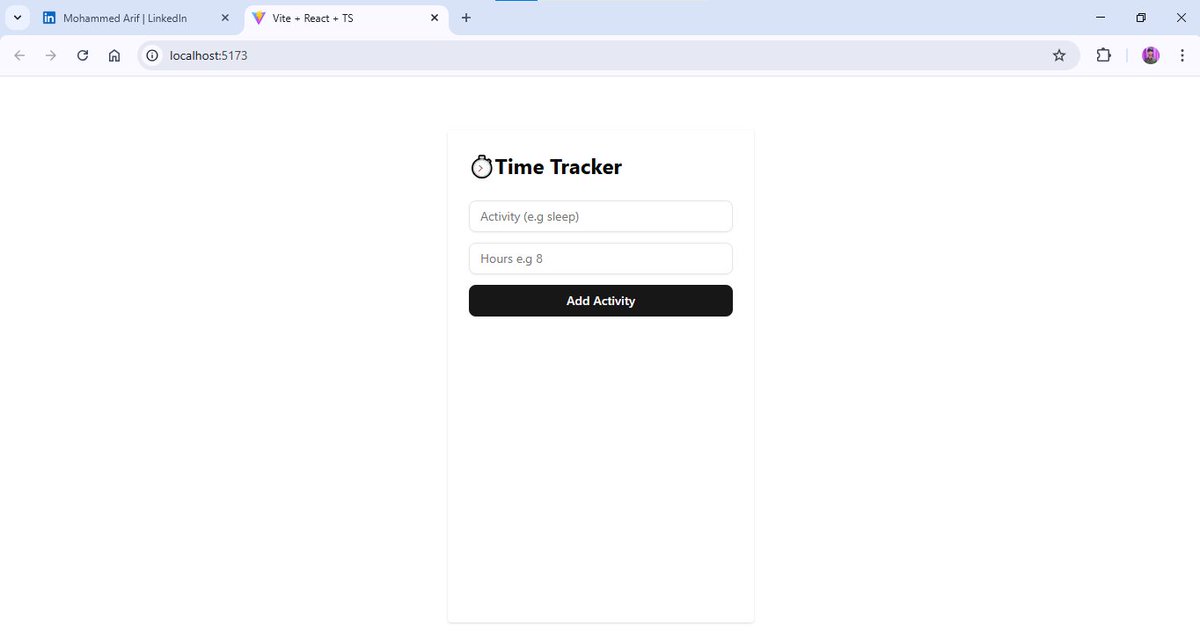
⏱️ Built a Time Tracker App with React + Chart.js! Log activities → see them in a colorful Pie Chart 🎨 💡 Learned: React + Vite (TS) basics Chart.js integration State mgmt & reusable comps Tailwind + ShadCN UI #ReactJS #ChartJS #WebDev 🙏 A big thanks to @CodeWithJavid


Bez chatbotů bych na podobné optimalizační hrátky neměl vůbec čas. Aneb výsledek cvičení: „Pojďme udělat časový graf s interaktivním zoomem (kolečko myši) a dynamickým dočítáním dat podle potřeby z DB.“ Umí váš Excel zobrazit v grafu desítky tisíc bodů, aniž by shořel? #chartjs

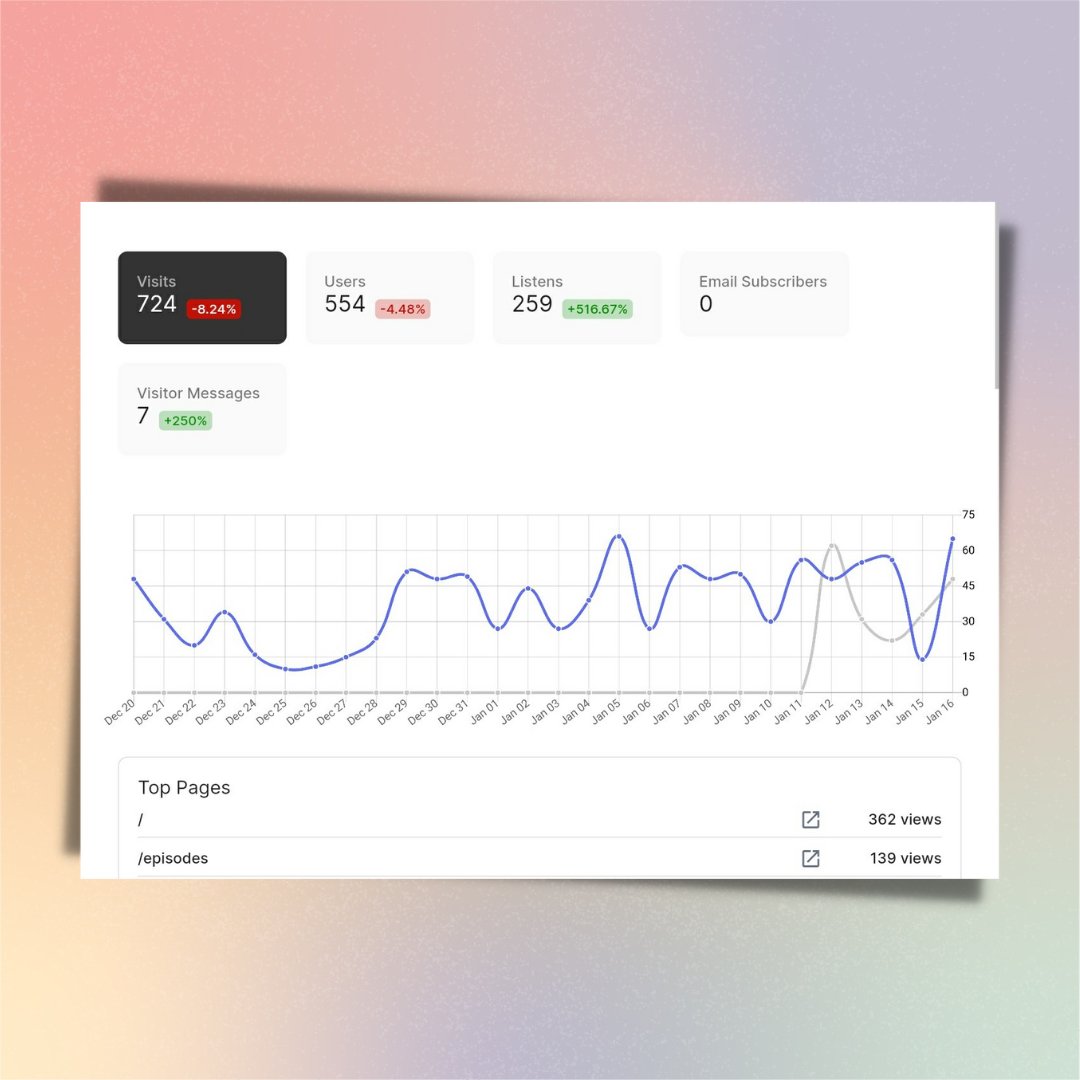
Hey, what techstack do you use for analytics dashboards? I have implemented something custom using #chartjs and #mysql while I was at MVP stage. It was quick and dirty solution. It works, but my customers deserve nice looking and fast analytics at @PodcastOnPodium! #buildinpublic


Verinizi anlaşılır hale getirin! Chart.js ve D3.js gibi güçlü JavaScript kütüphanelerini kullanarak raporlarınızı etkili tablolar ve grafiklerle görselleştiriyoruz. Verilerinizin hikayesini en iyi şekilde anlatın! #DataVisualization #ChartJS #D3JS #VeriAnalizi #Raporlama…


Day 2 of #10DayWebBuild - Tried Out Chart.js - Moved website idea from basic shapes to graphs - Used movie actor data to code 2 data visualizations that are bar graphs #DataVisualization #ChartJS


ChartJs Visualization Library - A Detailed Walkthrough #chartjs #charts #visualization #javascript #nodejs blackslate.io/articles/chart…
blackslate.io
ChartJs Visualization Library - A Detailed Walkthrough
In this article, we will learn about how to create Bar Chart, Area Chart, Bubble Chart, Doughnut and Pie Charts, Line Chart, Mixed Chart Types, Polar Area Chart, Radar Chart, Scatter Chart, Cartesian...

Static charts tell stories. Interactive charts make people feel them. 🎯 Bring your data to life with D3.js or Chart.js — add motion, interactivity, and insight that keeps users engaged. 📊✨ #DataVisualization #D3js #Chartjs #WebDev #JavaScript #Frontend
ChartJs Visualization Library - A Detailed Walkthrough #chartjs #charts #visualization #javascript #nodejs blackslate.io/articles/chart…
blackslate.io
ChartJs Visualization Library - A Detailed Walkthrough
In this article, we will learn about how to create Bar Chart, Area Chart, Bubble Chart, Doughnut and Pie Charts, Line Chart, Mixed Chart Types, Polar Area Chart, Radar Chart, Scatter Chart, Cartesian...

Dynamic React Dashboard Template – Live JSON & Chart.js buymeacoffee.com/k2infocom/resp… #ReactJS #ChartJS #AdminDashboard #AdminPanel #LiveData #JSONAPI #ResponsiveUI #UIDesign #WebDevelopment #ReactDashboard #FrontendDev #DashboardTemplate

ChartJs Visualization Library - A Detailed Walkthrough #chartjs #charts #visualization #javascript #nodejs blackslate.io/articles/chart…
blackslate.io
ChartJs Visualization Library - A Detailed Walkthrough
In this article, we will learn about how to create Bar Chart, Area Chart, Bubble Chart, Doughnut and Pie Charts, Line Chart, Mixed Chart Types, Polar Area Chart, Radar Chart, Scatter Chart, Cartesian...

[Improved!] Quick data visualization with Chart.js I streamlined the process of this AI use case below! You won't need external websites beside Google Gemini. Open this thread to unlock the AI use case 👇 #AIUseCases #ChartJS #DataDrivenMarketing #MarketingDataViz #AIData
ChartJs Visualization Library - A Detailed Walkthrough #chartjs #charts #visualization #javascript #nodejs blackslate.io/articles/chart…
blackslate.io
ChartJs Visualization Library - A Detailed Walkthrough
In this article, we will learn about how to create Bar Chart, Area Chart, Bubble Chart, Doughnut and Pie Charts, Line Chart, Mixed Chart Types, Polar Area Chart, Radar Chart, Scatter Chart, Cartesian...
Week 7 of 8 Web-Development 🚀 Working on my Expense Tracker Dashboard in React Integrating Chart.js for visualizing spending trends 💹 This app will let you track your daily expenses and view monthly summaries #WebDev #ReactJS #ChartJS #Frontend #Dashboard #ExpenseTracker
ChartJs Visualization Library - A Detailed Walkthrough #chartjs #charts #visualization #javascript #nodejs blackslate.io/articles/chart…
blackslate.io
ChartJs Visualization Library - A Detailed Walkthrough
In this article, we will learn about how to create Bar Chart, Area Chart, Bubble Chart, Doughnut and Pie Charts, Line Chart, Mixed Chart Types, Polar Area Chart, Radar Chart, Scatter Chart, Cartesian...

ทำกราฟง่าย ๆ ด้วย React + Chart.js สร้างโปรเจกต์ React → ติดตั้ง react-chartjs-2 → สร้างไฟล์กราฟแยก → import ใน App.js รองรับ Bar, Line, Doughnut/Pie และปรับสี/ขนาดได้ง่าย #ReactJS #ChartJS #DataViz
⏱️ Built a Time Tracker App with React + Chart.js! Log activities → see them in a colorful Pie Chart 🎨 💡 Learned: React + Vite (TS) basics Chart.js integration State mgmt & reusable comps Tailwind + ShadCN UI #ReactJS #ChartJS #WebDev 🙏 A big thanks to @CodeWithJavid


chartjs plugin datalabels does not show value on charts stackoverflow.com/questions/6881… #plugins #typescript #chartjs #charts #reactjs


Chart.JS Tutorial : How to create beautiful charts with JavaScript ☞ bit.ly/33jn29G #ChartJS #javascript

html2canvas Capture a chart.js-Chart with the size of full screen on different window size stackoverflow.com/questions/6901… #html2canvas #javascript #chartjs #html #reactjs


Multiple Chart.js charts on a single page, from 1 function but different data stackoverflow.com/questions/7202… #javascript #ecmascript6 #chartjs #arrays


Scatter plot not showing anything chartjs needs some debugging stackoverflow.com/questions/6905… #html #javascript #chartjs


Chart JS tooltip appears differently when set from script instead of html stackoverflow.com/questions/6890… #chartjs #css #jquery #html #javascript
共通部分は変数に、微妙に違うやつは関数にするの気持ちいいー! 返り値のオブジェクトにプロパティ追加はreactでおなじみの書き方 2ページに4つのグラフをchart.jsで表示する cfg配列だいぶすっきり♡ トリガー表示するため実行関数は監視関数に渡して完成! #web制作 #webデザイン #chartjs
Week 7 of 8 Web-Development 🚀 Working on my Expense Tracker Dashboard in React Integrating Chart.js for visualizing spending trends 💹 This app will let you track your daily expenses and view monthly summaries #WebDev #ReactJS #ChartJS #Frontend #Dashboard #ExpenseTracker

My friend @SomtochukwuOnoh has encouraged me to start my #100DaysOfCode. So I learnt something on modern UI design.#chartjs #CodeNewbies


Make report chart using Chart JS in #salesforce #chartjs #opensources #javascript #library #html5 sfdclesson.blogspot.com/2019/01/make-b…


Something went wrong.
Something went wrong.
United States Trends
- 1. #warmertogether N/A
- 2. $BARRON 2,198 posts
- 3. Walt Weiss N/A
- 4. Diane Ladd 3,917 posts
- 5. Harvey Weinstein 3,649 posts
- 6. Ben Shapiro 29.1K posts
- 7. $PLTR 17.8K posts
- 8. Laura Dern 1,920 posts
- 9. Teen Vogue 1,192 posts
- 10. Cardinals 12.2K posts
- 11. Gold's Gym 51.5K posts
- 12. iOS 26.1 3,415 posts
- 13. #NXXT 2,512 posts
- 14. #maddiekowalski 4,408 posts
- 15. McBride 3,134 posts
- 16. #CAVoteYesProp50 6,526 posts
- 17. #EAPartner N/A
- 18. Monday Night Football 4,771 posts
- 19. Braves 7,523 posts
- 20. Standout 7,884 posts