#datavisualizationtools 搜尋結果

A truly enriching discussion with Sharon Obanda & Samuel Mwamburi from @onadata. Great perspectives on #datavisualizationtools & how data plays a key role in development & tech. Nice to have Sharon Akinyi, an AkiraChix alumni & Software Dev @onadata, tag along & support the girls


Numbers that dance, charts that sing! 🕺📊 Uncover the story in your data because insights should be exciting, not exhausting. #DataVisualization #DataAnalysis #DataVisualizationTools #DataAnalysisTools
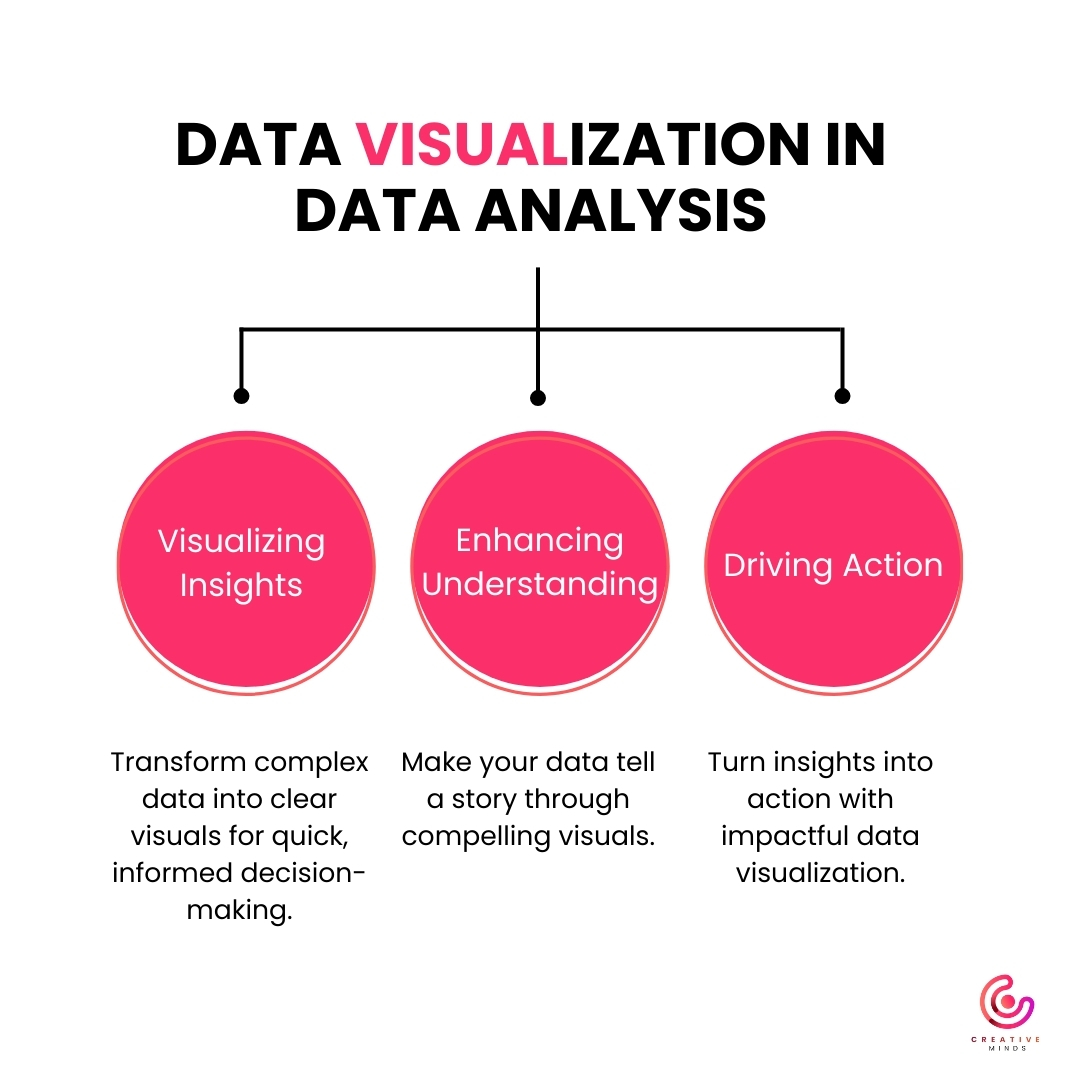

🌟 Transform Data into Masterpieces with Visualizations! 🖼️ Data doesn’t have to be boring. With the right visualization, it becomes powerful, engaging, and actionable. #DataDriven #VisualImpact #datavisualizationtools #datascience #techtips #mindforgeinfotech


The Future of Data Visualization: The Best Tools to Use Read more at @ bit.ly/3QIUrp4 #DataVisualization #DataVisualizationtools #bestDataVisualizationtools #Top10datavisualizationtools


Here's why Tableau is the best data visualisation tool for your brand out there.#DigitalAptech #datavisualization #datavisualizationtools #TableauForBrands #VisualizeYourBrand #TableauAdvantage #VisualizeYourData #TableauSuccess #ClutchChampion #ClutchGlobal #top1000companies


Top 10 Data Visualization Tools Read now: infosec-train.blogspot.com/2023/02/top-10… #data #datavisualizationtools #datascience #highcharts #echarts #ploty #Tableau #cybersecurity #infosectrain #learntorise


AI Data Visualization Frameworks That Will Redefine Product Innovation in 2025 🚀 🔗 Read the full article here 👉 the-next-tech.com/artificial-int… #AIDrivenInnovation #DataVisualizationTools #AIFrameworks #ProductInnovation2025 #ArtificialIntelligence #DataScienceCommunity #TheNextTech
the-next-tech.com
Best AI Data Visualization Frameworks 2025 – Fueling Product Innovation
Discover the best AI data visualization frameworks 2025 that fuel product innovation by turning complex data into actionable insights for researchers, scientists & entrepreneurs.

10 Top Tableau Alternatives for Dynamic Data Visualization shorturl.at/koDMQ #Tableaualternatives #datavisualizationtools #Dynamicdata #Businessintelligence #Datavisualization #IW #IWNews #IndustryWired


Let's transform your data analytics together! #datavisualizationtools #AI #technologies #businesscoach #innovation #mlm #dataviz #softwaresolutions #NDV


Do spreadsheets and financial curves make you want to run for the hills? Fear not! Nyumba Zetu's Data Visualization tools turn your financial data turn your financial data into crystal-clear insights, so you can conquer your numbers with confidence! #datavisualizationtools


RBT addresses a wide range of #datavisualization requirements advanced alongside various fields like deep learning and #artificialintelligence. Reach out to us for a demonstration. More: bit.ly/41y7ZYU #DataVisualizationtools #rbt #dataanalyst #ai #business #python


What's more important than what we say about SciChart? What our global user community says about it! Read our latest verified review in full, along with 450+ other reviews: reviews.co.uk/company-review…. #WPFdevelopers #datavisualization #datavisualizationtools #customerreviews


Starting a Data Science Online Course here will help you navigate through the field by learning and putting your learned skills to the test. Ref link: shorturl.at/jCTQi #datavisualizationtools #freedatavisualizationtools #bestdatavisualizationtools #datasciencecourse

Here are 10 ways that data visualization strengthens cybersecurity, and how a PTaaS vendor can use cybersecurity data visualization to save your team both time and money on actionable reports: hubs.li/Q01LJ0hm0 #DataVisualization #DataVisualizationTools #Cybersecurity


Best 10 Data Visualization Tools for Data Scientists tinyurl.com/4uzysvbs #DataVisualizationTools #VisualizationTools #DataScientists #DataAnalysis #DataScience #AI #AINews #AnalyticsInsight #AnalyticsInsightMagazine

Something went wrong.
Something went wrong.
United States Trends
- 1. The PENGU 169K posts
- 2. The JUP 151K posts
- 3. Reece James 20.5K posts
- 4. Garnacho 23.5K posts
- 5. Newcastle 71.4K posts
- 6. Chelsea 146K posts
- 7. Good Saturday 29K posts
- 8. #GMMTVStarlympics2025 4.58M posts
- 9. Clinton 339K posts
- 10. #NEWCHE 27.7K posts
- 11. #Caturday 2,858 posts
- 12. Chalobah 6,423 posts
- 13. Jake Paul 335K posts
- 14. #SaturdayVibes 4,070 posts
- 15. Neto 18.9K posts
- 16. Joao Pedro 9,884 posts
- 17. Elanga 3,261 posts
- 18. #GoCanes 4,144 posts
- 19. Harvey Barnes N/A
- 20. jennie 682K posts