#dataanalytics نتائج البحث

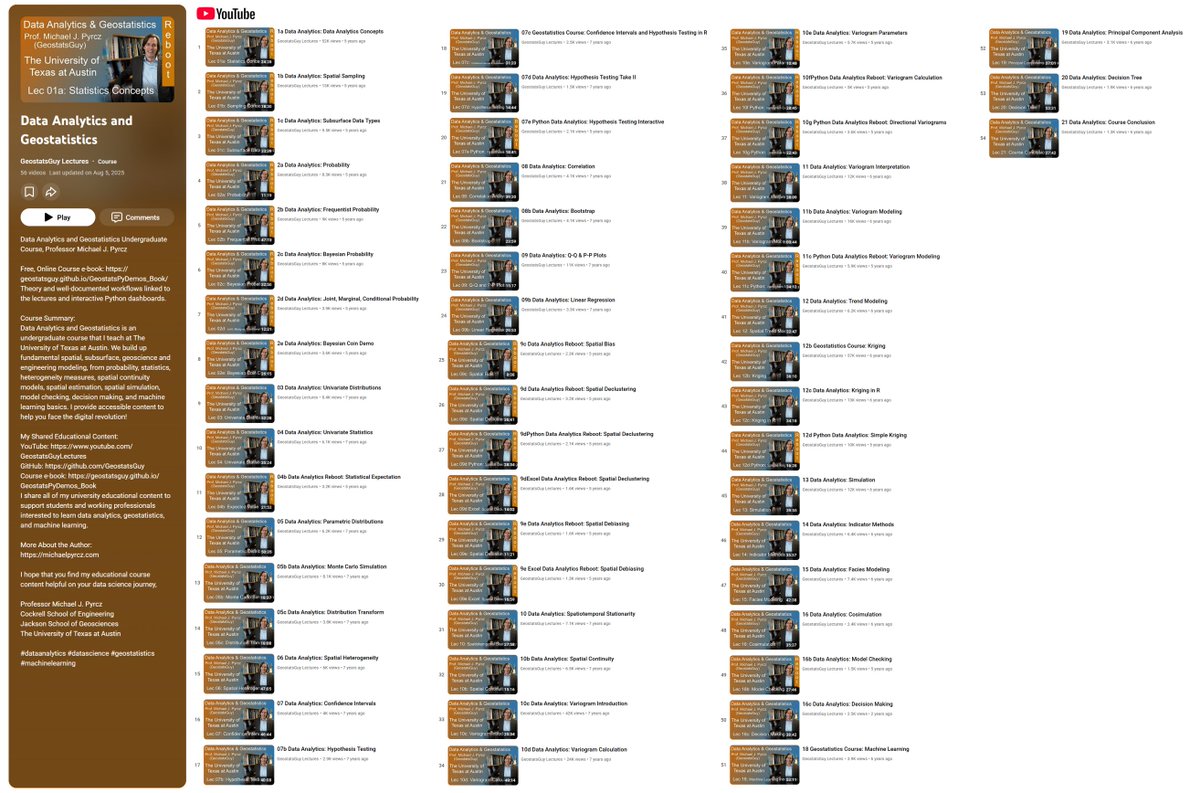
🚀 When I say I’m sharing my entire #DataAnalytics and #Geostatistics course with anyone eager to learn — I’m not joking! 😀📊 🎓 Here it is! Imagine, every lecture is paired with a free online e-book, plus hands-on, well-documented #Python workflows and interactive dashboards…

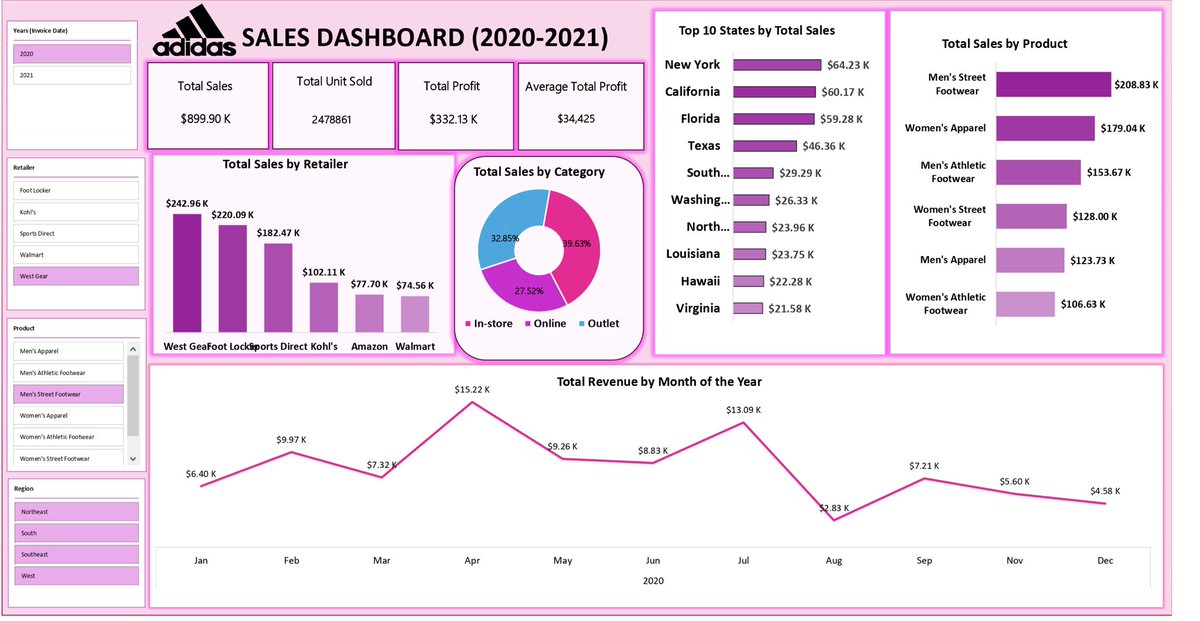
Started my data journey with Excel, and this Adidas Sales Dashboard (2020–2021) was my first big win 🎯 Built with slicers for retailers, products & regions, it showed me how powerful storytelling through data can be. #DataAnalytics #ExcelDashboard #datafam

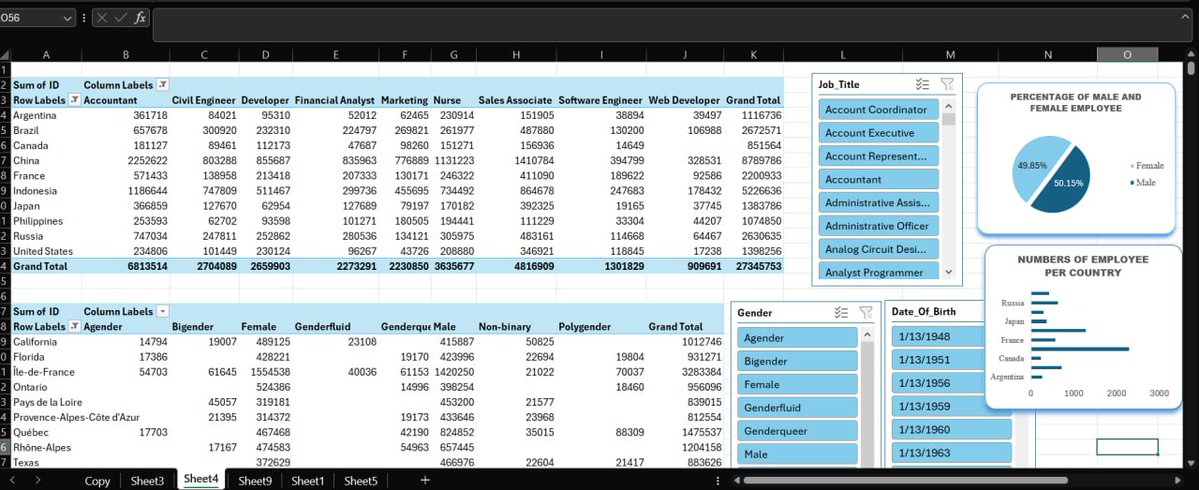
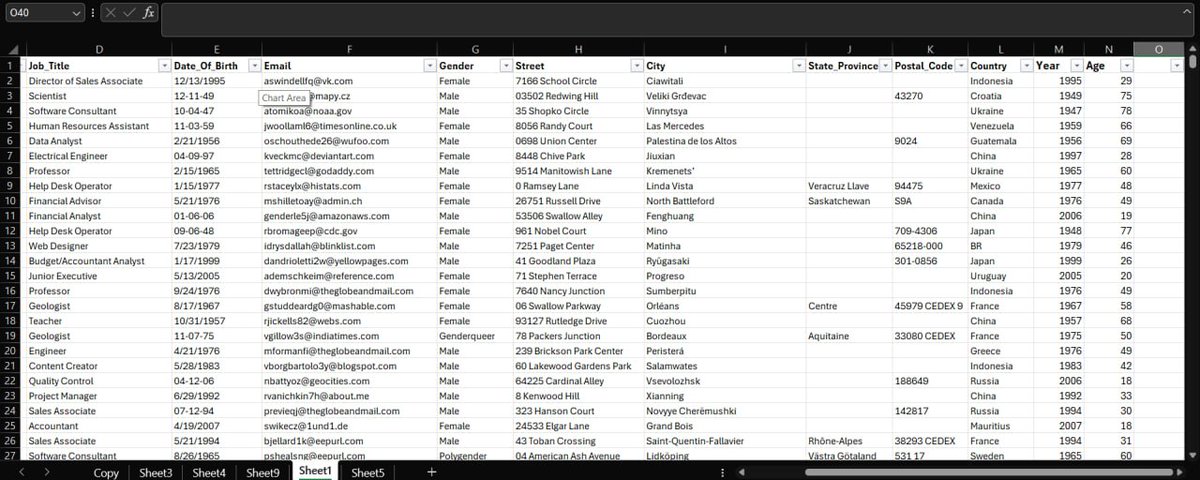
I was exploring how socioeconomic factors influence income levels and the data was quite shocking. This project involves performing data analysis using Python on a dataset containing demographic and employment-related attributes. #DataAnalytics #data


4 months ago, I started my Data Analytics journey 🚀 From zero to building dashboards in Power BI, DDL, DML, and DQL using SQL, and Excel—it’s been wild! Now it’s time to start sharing my projects, insights, and lessons learned so far. Let’s grow together 💪 #DataAnalytics #SQL


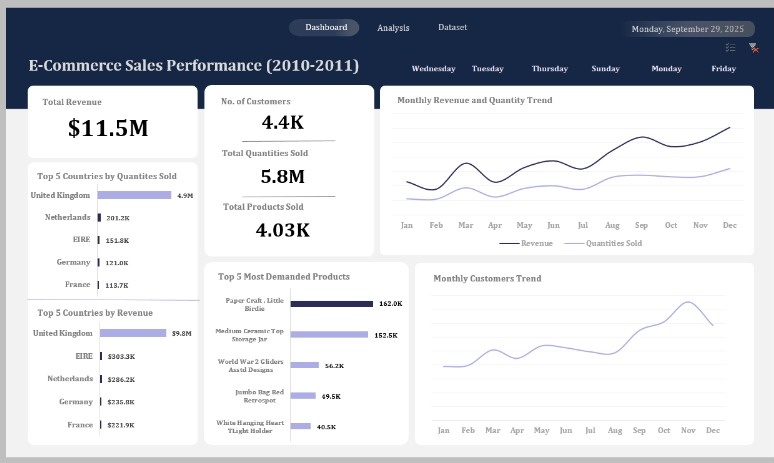
Worked on this E commerce sales dashboard using Excel, it contained 500k rows and even made me excel to start crashing, but well I later run am!!! Data Analytics is sweet!! #Excel #dataanalytics #dashboard

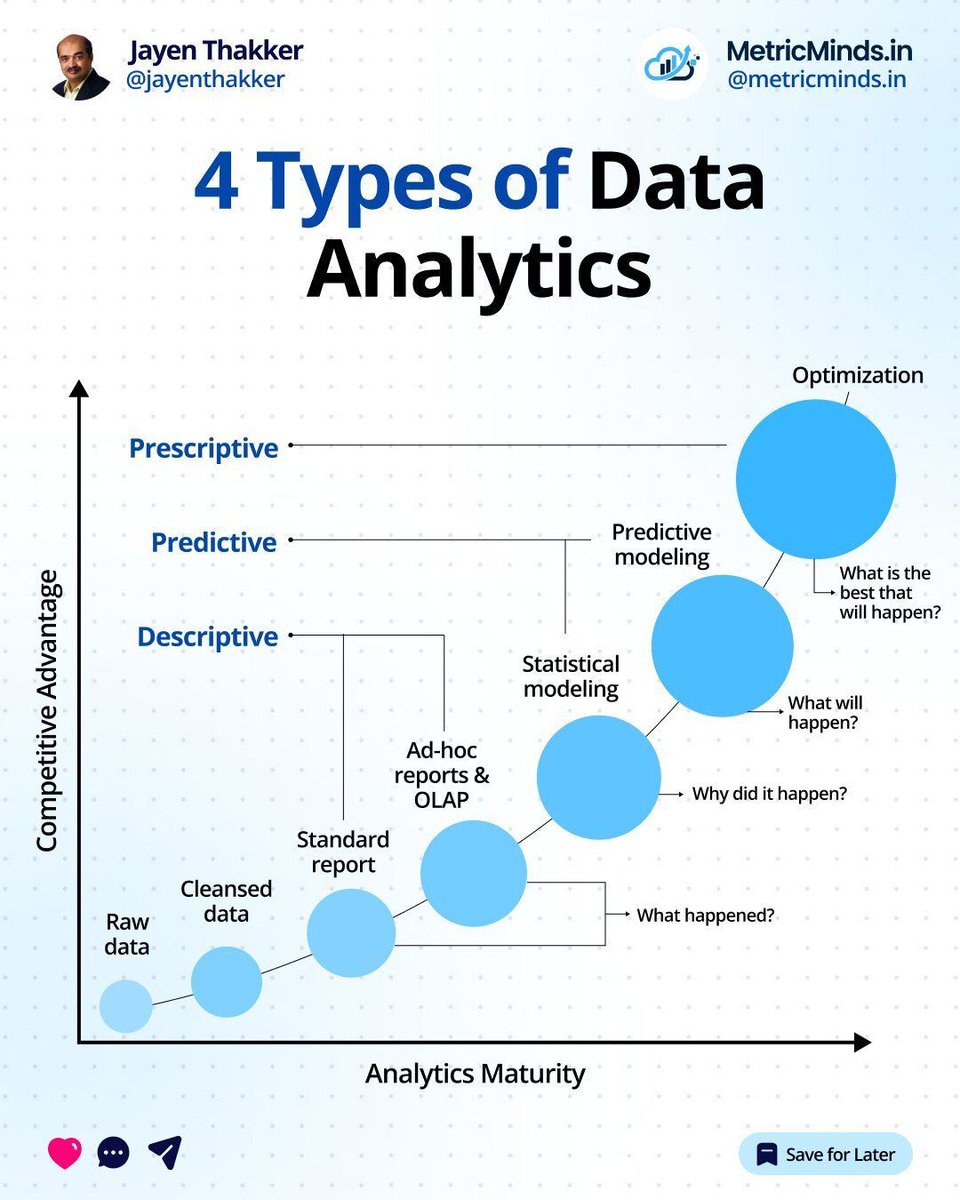
4 Types of #DataAnalytics by @JayenThakker #DataScience #BigData cc: @karpathy @terenceleungsf @kuriharan

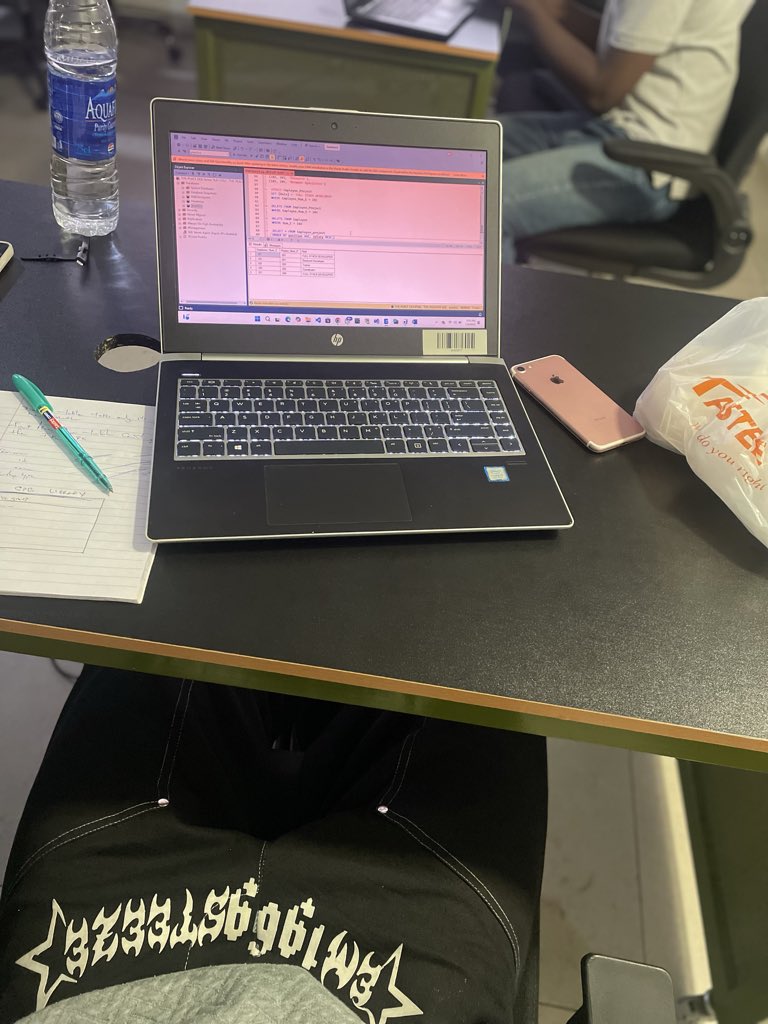
Day 4 of my digital payment system My laptop screen broke on Day 3, but I'm back! - Cleaned Dataset ✓ - 5,000 transactions $24.79M processed - 146 failures to investigate Question: Why do 2.92% of payments fail? Starting analysis tonight 🔍 #DataAnalytics #Fintech


On my Data Analytics journey, after toiling for several hours today, I’ve been able to successfully solve this sumifs problem that has several criteria, Not so big but I celebrate myself 🥳😂 #dataanalytics


Data Visualization & Analysis,Data tells a story — Excel helps visualize it. From cleaning to creating pivot tables, dashboards, and charts — turning data into insights! Big thanks to the amazing mentors @ProsperoApril @PamellaIshiwu #DataAnalytics @PercorsoTech


Thrilled to share my new book, The Data Analytics Advantage! 📘 It’s about how data and AI can help us uncover the stories that truly matter — bridging insight, creativity, and impact. #DataAnalytics #AI #Storytelling #Innovation

Very exciting opportunity in my team! Work directly with me on making our trainings the best in the industry 🚀 How to apply? Send your demo report to [email protected] #powerbi #dataanalytics #hiring #job #offer


My PercorsoTech SQL Assignment 1 with @PercorsoTech... Thank you @ProsperoApril and @PamellaIshiwu for the classes #PercorsoTech #DataAnalytics


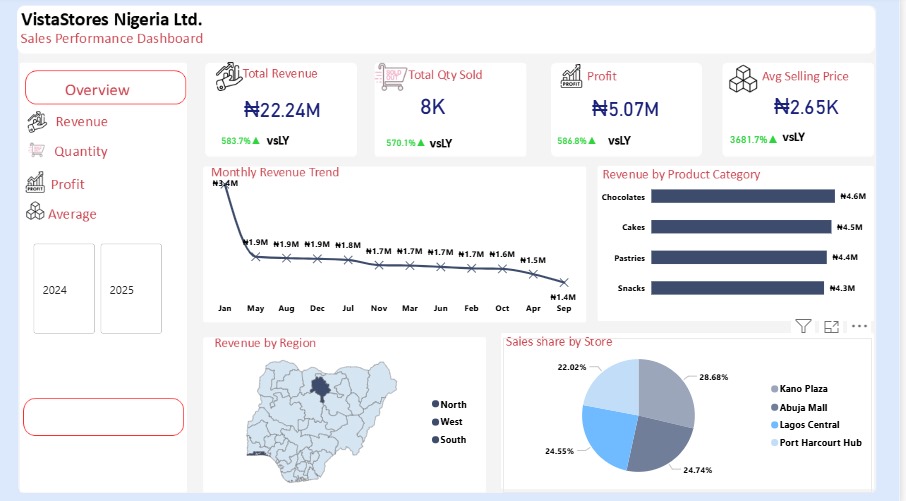
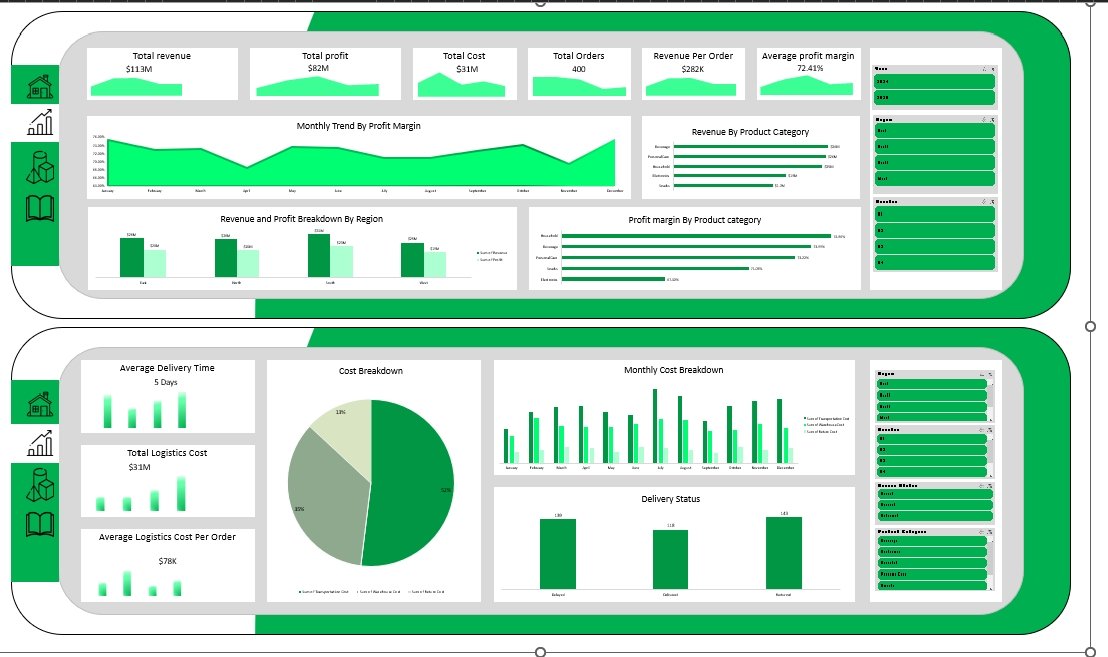
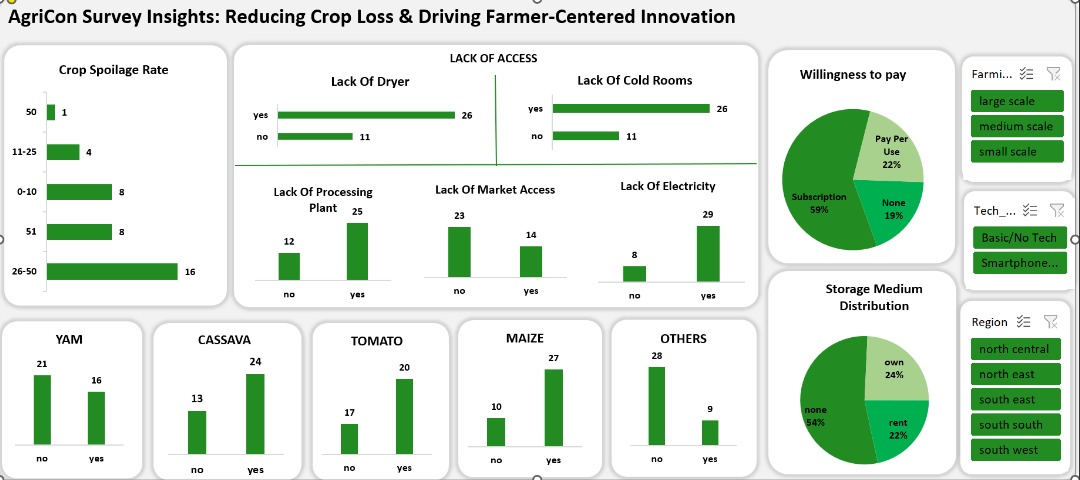
Just completed a new Power BI dashboard design showcasing clear visuals, structured data models, and actionable insights. Focused on turning complex data into simple, interactive stories for better decision-making. #PowerBI #DataAnalytics #BusinessIntelligence #DashboardDesign


Excited to share insights from my retail analysis project! Using Excel dashboards, I explored key trends in sales, payments, and customer satisfaction. #DataAnalytics #Excel #RetailInsights


Data Science: The New Oil of the 21st Century: Big data is providing deep insights to make better decisions in every field. What is the importance of data analytics in the modern world? #DataScience #BigData #DataAnalytics
The critical role of data analytics in making informed business decisions. Data-driven insights are non-negotiable for competitive advantage. #DataAnalytics #BusinessIntelligence

🚀 Discover @mention_network the future of on-chain identity Easily explore how wallets, dApps, and users can be yapping here 🔗 Real-time data 🌐 Cross-chain 💡 analysts, & communities Check it out 👉mention.network/id #Web3 #Crypto #DataAnalytics

On my Data Analytics journey, after toiling for several hours today, I’ve been able to successfully solve this sumifs problem that has several criteria, Not so big but I celebrate myself 🥳😂 #dataanalytics

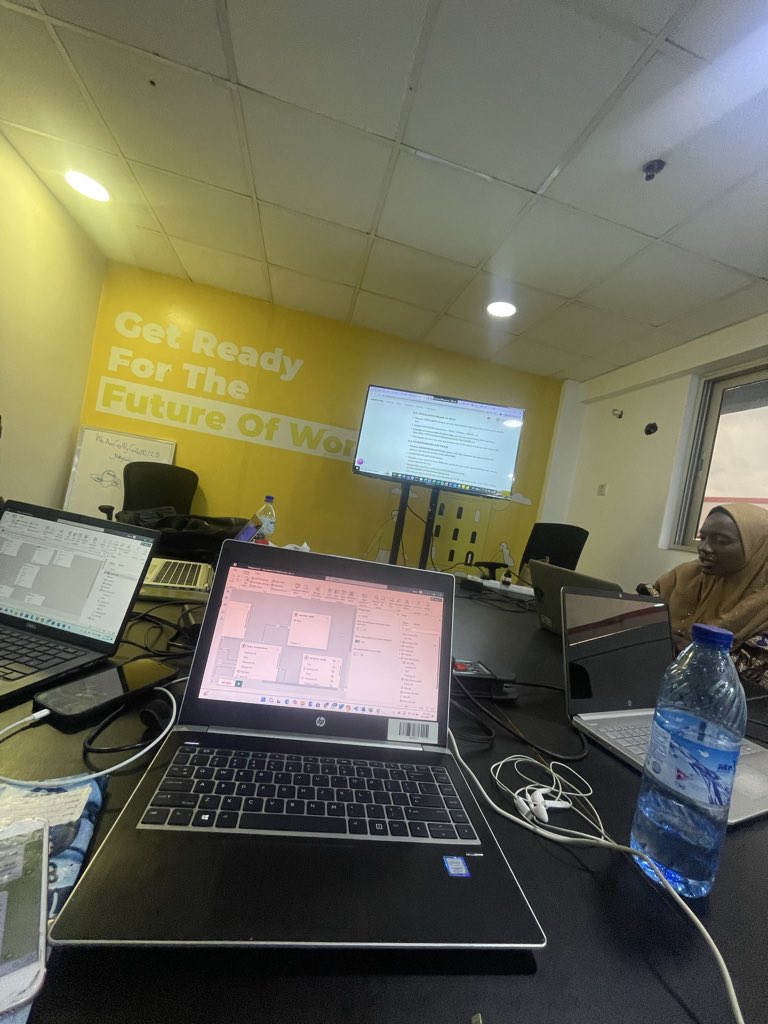
We ain’t sleeping 😤 Late-night data cleaning session — grouped ages, structured variables, and prepared the healthcare dataset for analysis. #DataAnalytics #Excel # #DataCleaning #HealthcareData #DataStorytelling #Alonso #Vini #Bongo


Your website should be your first hire — not your last. It works 24/7, doesn’t take leave, and never sleeps. If it’s not converting or collecting data, you’re paying a ghost employee. 👻💻 #WebDevelopment #DataAnalytics #NigeriaBusiness #DigitalGrowth

SQL is used to access, manipulate, and retrieve data from objects in a database. Lastly, I came across a few key concepts — database, schema, tables, views, and functions — which I’ll break down in my next post. #dataanalytics #sqlknowledge #tech #datafam


Started my data journey with Excel, and this Adidas Sales Dashboard (2020–2021) was my first big win 🎯 Built with slicers for retailers, products & regions, it showed me how powerful storytelling through data can be. #DataAnalytics #ExcelDashboard #datafam
I was exploring how socioeconomic factors influence income levels and the data was quite shocking. This project involves performing data analysis using Python on a dataset containing demographic and employment-related attributes. #DataAnalytics #data
Worked on this E commerce sales dashboard using Excel, it contained 500k rows and even made me excel to start crashing, but well I later run am!!! Data Analytics is sweet!! #Excel #dataanalytics #dashboard
4 months ago, I started my Data Analytics journey 🚀 From zero to building dashboards in Power BI, DDL, DML, and DQL using SQL, and Excel—it’s been wild! Now it’s time to start sharing my projects, insights, and lessons learned so far. Let’s grow together 💪 #DataAnalytics #SQL
Day 4 of my digital payment system My laptop screen broke on Day 3, but I'm back! - Cleaned Dataset ✓ - 5,000 transactions $24.79M processed - 146 failures to investigate Question: Why do 2.92% of payments fail? Starting analysis tonight 🔍 #DataAnalytics #Fintech

Over the past few days, I worked on analyzing customer behavior and revenue analysis using Excel. The goal was to understand who our customers are, how are shop and where revenue is being generated the most #DataAnalytics #Datastorytelling #Excel #DataAnalyst

4 Types of #DataAnalytics by @JayenThakker #DataScience #BigData cc: @karpathy @terenceleungsf @kuriharan
Excited to share insights from my retail analysis project! Using Excel dashboards, I explored key trends in sales, payments, and customer satisfaction. #DataAnalytics #Excel #RetailInsights
Just completed a new Power BI dashboard design showcasing clear visuals, structured data models, and actionable insights. Focused on turning complex data into simple, interactive stories for better decision-making. #PowerBI #DataAnalytics #BusinessIntelligence #DashboardDesign

I’m a Business Analyst. I help startups identify and solve business challenges from uncovering inefficiencies to implementing solutions that improve performance and growth. Open to new roles and freelance gigs. #BusinessAnalysis #DataAnalytics #StartupGrowth

On my Data Analytics journey, after toiling for several hours today, I’ve been able to successfully solve this sumifs problem that has several criteria, Not so big but I celebrate myself 🥳😂 #dataanalytics

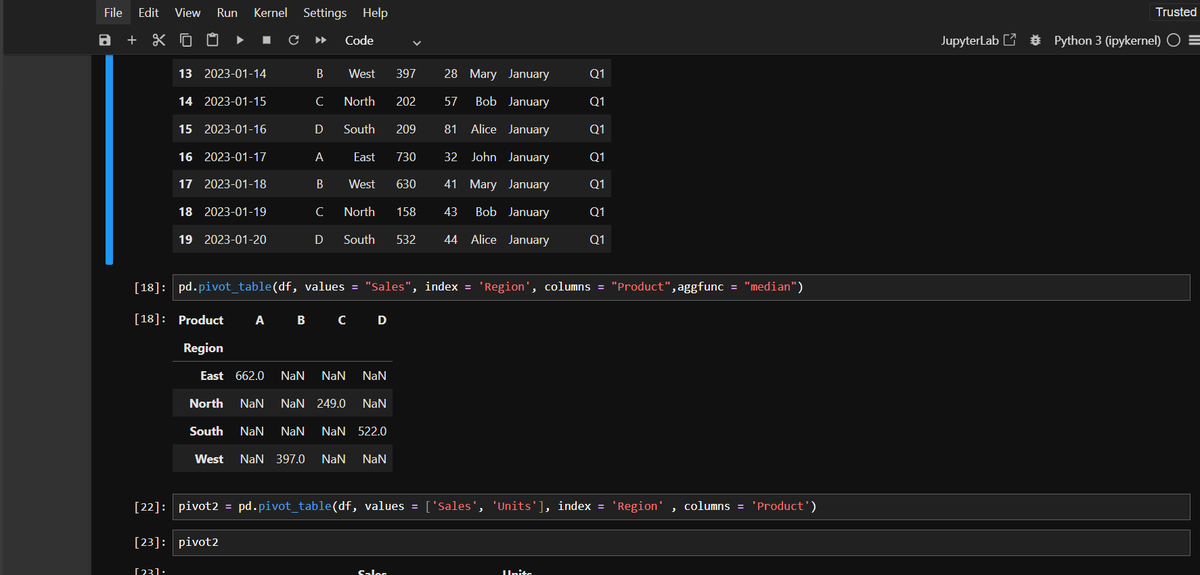
Learning pandas this festive week ... nothing like adding some sparkle to data too! ✨ Created a dataset with Products, Regions, Sales, and added custom Month and Quarter columns using pandas and played a little just to stay consistent. #Python #DataAnalytics #DiwaliLearning

Started a dataset project in Excel yesterday. Cleaned it. Built pivot tables. Everything was perfect. Later in the evening, I opened it — blank sheet. 😳. Turns out, it was saved as a CSV. I didn’t cry… but I felt that heartbreak💔 #DataAnalytics #Excel #CSV #Datafam

🚀 When I say I’m sharing my entire #DataAnalytics and #Geostatistics course with anyone eager to learn — I’m not joking! 😀📊 🎓 Here it is! Imagine, every lecture is paired with a free online e-book, plus hands-on, well-documented #Python workflows and interactive dashboards…
Something went wrong.
Something went wrong.
United States Trends
- 1. Virginia 469K posts
- 2. #DWTS 38K posts
- 3. New York 866K posts
- 4. Sixers 12.3K posts
- 5. Mamdani 1.1M posts
- 6. Bulls 32.9K posts
- 7. Embiid 5,877 posts
- 8. Maxey 7,610 posts
- 9. Jay Jones 87.9K posts
- 10. #Election2025 14.4K posts
- 11. Cuomo 376K posts
- 12. Andy 63.4K posts
- 13. Josh Giddey 4,819 posts
- 14. Whitney 11K posts
- 15. Louisville 126K posts
- 16. #SeeRed 3,017 posts
- 17. Alix 7,124 posts
- 18. WOKE IS BACK 23K posts
- 19. RIP NYC 12.1K posts
- 20. Sherrill 101K posts