#networkgraph ผลการค้นหา


I wonder how much incentive there is for an integrated customer relationship management company to keep all those relationships independent of each other #TestAndTrace must present a very interesting #NetworkGraph datavizcatalogue.com/methods/networ…


#CybChat explore who you've connected with in the network and find your anon in the #networkgraph. Additionally, a feature is proposed to determine the distance between users for those who don't use anonymity. #cyb #robotcyb #cyber

Just published a new version of 🌌Cosmos which has a whole bunch of cool new features. For example, you can finally add node labels and highlight nodes while hovering over them! Learn more on our GitHub github.com/cosmograph-org… #dataviz #networkgraph #webgl #typescript

Anybody know how to get a better #networkgraph in #vsts #azuredevops @AzureDevOps so it's repo wide like on @github ? Very hard to get a good overview in @AzureDevOps TBH


RT Find the Knowledge Hubs in Your Company dlvr.it/S7nv5n #slack #networkgraph #dataanalysis #python #socialnetworkanalysis


#NetworkGraph Issues President Uhuru Kenyatta Mentioned In: #ProfilingKIKUYUS #RutosDownfall #itumbi #UhuruKenyatta #AnalyticsKE @Sentimently @AnalyticsKE #Sentimently


🚀 Just released a new version of reagraph which supports 3D Clustering! Checkout the video! 👉 reagraph.dev #dataviz #networkgraph #webgl #reactjs #javascript #typescript #webdev #cybersecurity
RT Data Science — Building a Network Graph using Microsoft Power BI for SQL Relational Data dlvr.it/RjgNr6 #powerbi #visualization #networkgraph #datascience #networktheory


Part 3 of my beer & glassware connections, with a live #networkgraph @Gephi @ratebeer brewgraphs.com/wordpress/2020…


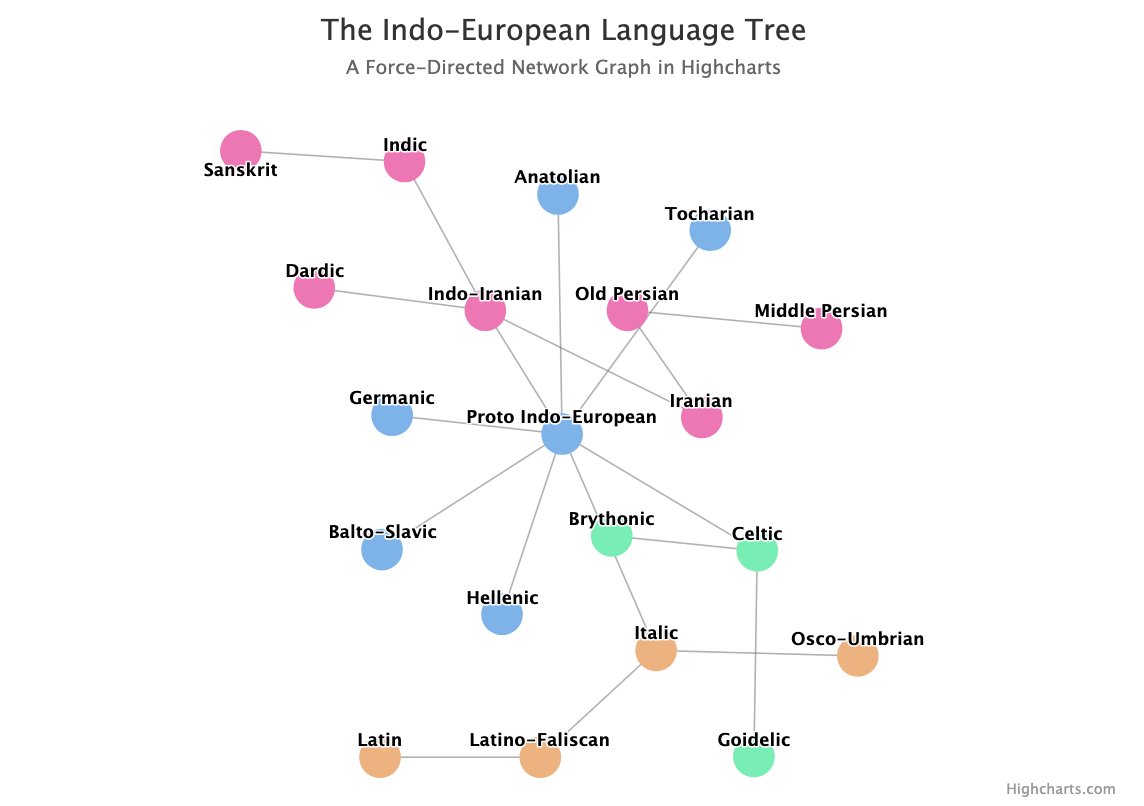
Customize your network graph chart algorithm using custom forces. Learn more here highcharts.com/docs/chart-and… #dataviz #charts #networkgraph


#NetworkGraph is a visualization used to model pairwise relations between points, where points are shown as nodes (vertices) linked by lines (edges). Here's an example: ➡️ playground.anychart.com/gallery/Networ… More examples: ➡️ anychart.com/products/anych… #graph #dataviz #webdev #javascript

Check out a new awesome #DataViz tutorial for web developers — just published! This time, our guest blogger @_mudblud explains how to create a #NetworkGraph using #JavaScript, visualizing #GameOfThrones battles for illustration. 🔥🧑💻❄️ Learn & have fun! ➡️ anychart.com/blog/2020/07/2…

The network graph is used to visualize clusters and relationships between the nodes quickly. By @MusMekh highcharts.com/blog/tutorials… #networkgraph #js #dataViz #categoricaldata #RStats @rstudio #Rbloggers

Use Network graphs to visualize interconnections between entities, such as social networks. Learn more here: highcharts.com/docs/chart-and… #dataviz #networkgraph #DataScience

Next week! @Crossbeam CEO @robertjmoore speaks at @ProductsCount: Crossbeam CEO on Building Products for the B2B Network Graph. Details and tickets: bit.ly/3KNwFVc #network #B2B #networkgraph #productmanagement #productevent


Does anyone know if there is an equivalent to @github's "Network graph" for @gitlab? ©️ Related: forum.gitlab.com/t/is-there-som… #forks #github #networkgraph #visualization

🚀 Want to create cool interactive Network Graphs with ease? Check out a new JS charting tutorial visualizing @VWGroup's structure with straightforward steps and intuitive examples. 📖 Read here: anychart.com/blog/2024/05/2… #javascript #dataviz #networkgraph #datascience #frontend


When data floats, patterns emerge. Built a #networkgraph using #React + #D3 + Canvas, fast, interactive, and fully custom. No fluff. Just clean visuals and real relationships. Read the blog:👇 antt.me/Aau8cpTA #DataVisualization #WebDev #FrontendDev #JavaScript


D3.js force simulations — 8 years on by Bryony Miles at #ITNEXT. #d3js #networkgraph #collide #tipsandtricks #radius itnext.io/d3-js-force-si… (f)
D3.js force simulations — 8 years on by Bryony Miles at #ITNEXT. #d3js #networkgraph #collide #tipsandtricks #radius itnext.io/d3-js-force-si… (t)
D3.js force simulations — 8 years on by Bryony Miles at #ITNEXT. #d3js #networkgraph #collide #tipsandtricks #radius itnext.io/d3-js-force-si… (s)
D3.js force simulations — 8 years on by Bryony Miles at #ITNEXT. #d3js #networkgraph #collide #tipsandtricks #radius itnext.io/d3-js-force-si…
#CybChat explore who you've connected with in the network and find your anon in the #networkgraph. Additionally, a feature is proposed to determine the distance between users for those who don't use anonymity. #cyb #robotcyb #cyber
When data floats, patterns emerge. Built a #networkgraph using #React + #D3 + Canvas, fast, interactive, and fully custom. No fluff. Just clean visuals and real relationships. Read the blog:👇 antt.me/Aau8cpTA #DataVisualization #WebDev #FrontendDev #JavaScript
🚀 Want to create cool interactive Network Graphs with ease? Check out a new JS charting tutorial visualizing @VWGroup's structure with straightforward steps and intuitive examples. 📖 Read here: anychart.com/blog/2024/05/2… #javascript #dataviz #networkgraph #datascience #frontend
🚀 Just released a new version of reagraph which supports 3D Clustering! Checkout the video! 👉 reagraph.dev #dataviz #networkgraph #webgl #reactjs #javascript #typescript #webdev #cybersecurity
Just published a new version of 🌌Cosmos which has a whole bunch of cool new features. For example, you can finally add node labels and highlight nodes while hovering over them! Learn more on our GitHub github.com/cosmograph-org… #dataviz #networkgraph #webgl #typescript

Anybody know how to get a better #networkgraph in #vsts #azuredevops @AzureDevOps so it's repo wide like on @github ? Very hard to get a good overview in @AzureDevOps TBH
RT Find the Knowledge Hubs in Your Company dlvr.it/S7nv5n #slack #networkgraph #dataanalysis #python #socialnetworkanalysis
I wonder how much incentive there is for an integrated customer relationship management company to keep all those relationships independent of each other #TestAndTrace must present a very interesting #NetworkGraph datavizcatalogue.com/methods/networ…
RT Data Science — Building a Network Graph using Microsoft Power BI for SQL Relational Data dlvr.it/RjgNr6 #powerbi #visualization #networkgraph #datascience #networktheory
Next week! @Crossbeam CEO @robertjmoore speaks at @ProductsCount: Crossbeam CEO on Building Products for the B2B Network Graph. Details and tickets: bit.ly/3KNwFVc #network #B2B #networkgraph #productmanagement #productevent
#NetworkGraph Issues President Uhuru Kenyatta Mentioned In: #ProfilingKIKUYUS #RutosDownfall #itumbi #UhuruKenyatta #AnalyticsKE @Sentimently @AnalyticsKE #Sentimently
Customize your network graph chart algorithm using custom forces. Learn more here highcharts.com/docs/chart-and… #dataviz #charts #networkgraph
Does anyone know if there is an equivalent to @github's "Network graph" for @gitlab? ©️ Related: forum.gitlab.com/t/is-there-som… #forks #github #networkgraph #visualization
The network graph is used to visualize clusters and relationships between the nodes quickly. By @MusMekh highcharts.com/blog/tutorials… #networkgraph #js #dataViz #categoricaldata #RStats @rstudio #Rbloggers
Use Network graphs to visualize interconnections between entities, such as social networks. Learn more here: highcharts.com/docs/chart-and… #dataviz #networkgraph #DataScience
#NetworkGraph is a visualization used to model pairwise relations between points, where points are shown as nodes (vertices) linked by lines (edges). Here's an example: ➡️ playground.anychart.com/gallery/Networ… More examples: ➡️ anychart.com/products/anych… #graph #dataviz #webdev #javascript
Part 3 of my beer & glassware connections, with a live #networkgraph @Gephi @ratebeer brewgraphs.com/wordpress/2020…
Check out a new awesome #DataViz tutorial for web developers — just published! This time, our guest blogger @_mudblud explains how to create a #NetworkGraph using #JavaScript, visualizing #GameOfThrones battles for illustration. 🔥🧑💻❄️ Learn & have fun! ➡️ anychart.com/blog/2020/07/2…
🚀 Want to create cool interactive Network Graphs with ease? Check out a new JS charting tutorial visualizing @VWGroup's structure with straightforward steps and intuitive examples. 📖 Read here: anychart.com/blog/2024/05/2… #javascript #dataviz #networkgraph #datascience #frontend

Graph Analysis: การวิเคราะห์เชิงกราฟเบื้องต้นและตัวอย่างการประยุกต์ใช้ bigdata.go.th/big-data-101/g… ในบทความนี้ ผมอยากให้ทุกท่านรู้จัก เทคนิคการวิเคราะห์เชิงกราฟ ที่ช่วยผู้อ่านได้เทคนิคเพื่อหา insight จากข้อมูลในมิติที่แตกต่างออกไป #graphanalytic #graphdatabase #networkgraph


Graph Analysis: การวิเคราะห์เชิงกราฟเบื้องต้นและตัวอย่างการประยุกต์ใช้ bigdata.go.th/big-data-101/g… ในบทความนี้ ผมอยากให้ทุกท่านรู้จัก เทคนิคการวิเคราะห์เชิงกราฟ ที่ช่วยผู้อ่านได้เทคนิคเพื่อหา insight จากข้อมูลในมิติที่แตกต่างออกไป #graphanalytic #graphdatabase #networkgraph

🕸️ This #NetworkGraph displays which #companies people #search for together according to data from Google Knowledge Graph 💻 Check it out along with other cool #JavaScript network graph #dataviz demos in our gallery 🖼️ 👉 anychart.com/products/anych…
Something went wrong.
Something went wrong.
United States Trends
- 1. Falcons 26.4K posts
- 2. Bears 54.3K posts
- 3. Bryce Young 11.3K posts
- 4. Josh Allen 20.9K posts
- 5. Vikings 27.9K posts
- 6. JJ McCarthy 10.4K posts
- 7. Chargers 20K posts
- 8. Packers 38.6K posts
- 9. #KeepPounding 4,795 posts
- 10. Panthers 22.7K posts
- 11. Bengals 22.2K posts
- 12. Bucs 12.4K posts
- 13. Bills 107K posts
- 14. Hyatt 4,197 posts
- 15. Chiefs 26.9K posts
- 16. Ramsey 8,515 posts
- 17. Raheem 5,887 posts
- 18. Steelers 36K posts
- 19. Sean Tucker 3,694 posts
- 20. Jameis 13.2K posts