#osmnx search results

playing w/ #osmnx, wrote script to measure route straightness; inspired by @TransitCenter #StraighterIsGreater 👀 kuanbutts.com/2017/07/29/tra…


😎I mapped the street #networks of #German 🇩🇪 cities using #OSMnx in #Python 🐍, highlighting the unique layouts of #Bonn, #Köln, #Düsseldorf, #FrankfurtamMain, #München, #Münster, #Stuttgart and #Berlin. 📢 Thanks to @milan_janosov for his guidance📚 #UrbanExploration #Dataviz


Ukrainian cities with a population of more than 250,000 inhabitants as of 2014. Square-mile street network visualization. #30DayMapChallenge Day 02: Lines tools: #Python #OSMnx data: #OpenStreetMap Thank you @gboeing for the excellent tools!


都市間比較のためにOSMnxを使ってOpenStreetMapから取得した道路ネットワークに対して、スペースシンタックス理論に基づく構造指標を算出・分析・可視化するツールを作った。ようやくそれなりに動く状態にできた...。これは長野県の上田市、松本市、長野市の比較。 github.com/mopinfish/spac… #osmnx


Why i can't obtain driving network of the United States with the package OSMNX in python? stackoverflow.com/questions/6808… #openstreetmap #osmnx #python

本日のFOSS4G KANSAIでのポスター発表に使用したソースコードです。 colab.research.google.com/drive/1W1c3Hhk… OSMnxを使って大阪市北区の道路の媒介中心性と近接中心性を可視化した結果、河川という地理的制約による交通集中と、商業地域としての梅田周辺の高アクセス性が浮かび上がってきました。 #foss4gj #osmnx


#SanDiego is a series of disconnected islands of relative flatness, separated by huge valleys, compounded by freeways. Made w/ #osmnx.


Added segment distance to spectral graph of the Laplacian of Berkeley walk network. OSM data converted to graph via #OSMnx.


#30DayMapChallenge Day 2 - Line Todas as estradas do município de Teresina, Piauí extraída do #OpenStreetMap #OSMnx


I wanted a wallpaper;) so I used @matplotlib to generate a beautiful plot with #osmnx of my shortest and frequent commute routes. ;) I <3 #python

Opting out of the convex hull when producing isochrones; improves legibility. Shown: update to #OSMnx isolines example.


Hosting a session at @DataLabAdam about #osmnx Open Street Map data in #Python. The OSMnx module is much fun. The plot shows the most important nodes in the network of Stadsdeel Centrum Amsterdam. Just applying here. All kudos to osmnx creator himself cc @gboeing


Network Analysis: Shortest path, Degree Centrality, Betweenness Centrality Tutorial Link: youtube.com/live/XC8T7kV56… #network #shortestpath #osmnx #centrality #betweenness #networkx


Excited to share a look at our latest project at OpenGeoCity Tanzania! We're developing a crop disease detection model to support local farmers. The video shows our model in action, testing, and the #Python desktop app we've built using the #OSMnx library. Proud to our team
都市間比較のためにOSMnxを使ってOpenStreetMapから取得した道路ネットワークに対して、スペースシンタックス理論に基づく構造指標を算出・分析・可視化するツールを作った。ようやくそれなりに動く状態にできた...。これは長野県の上田市、松本市、長野市の比較。 github.com/mopinfish/spac… #osmnx

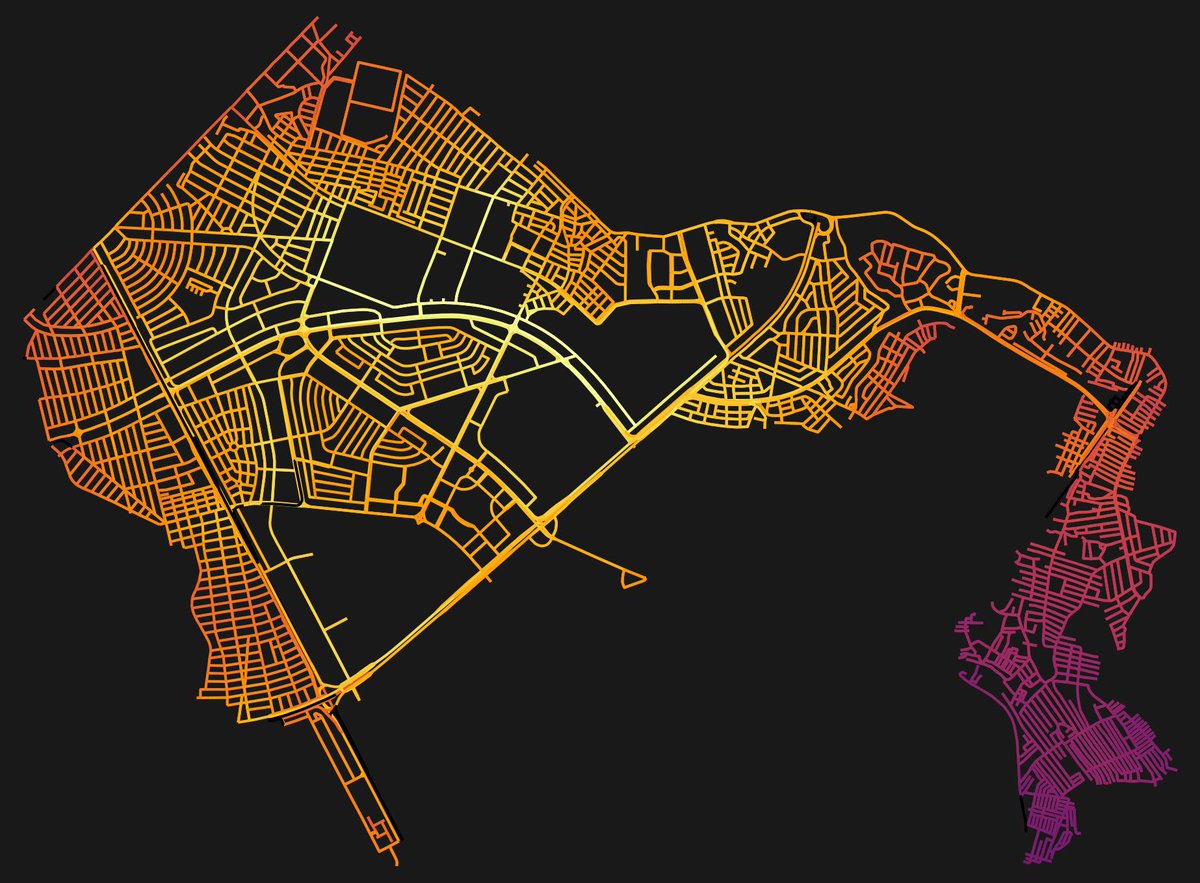
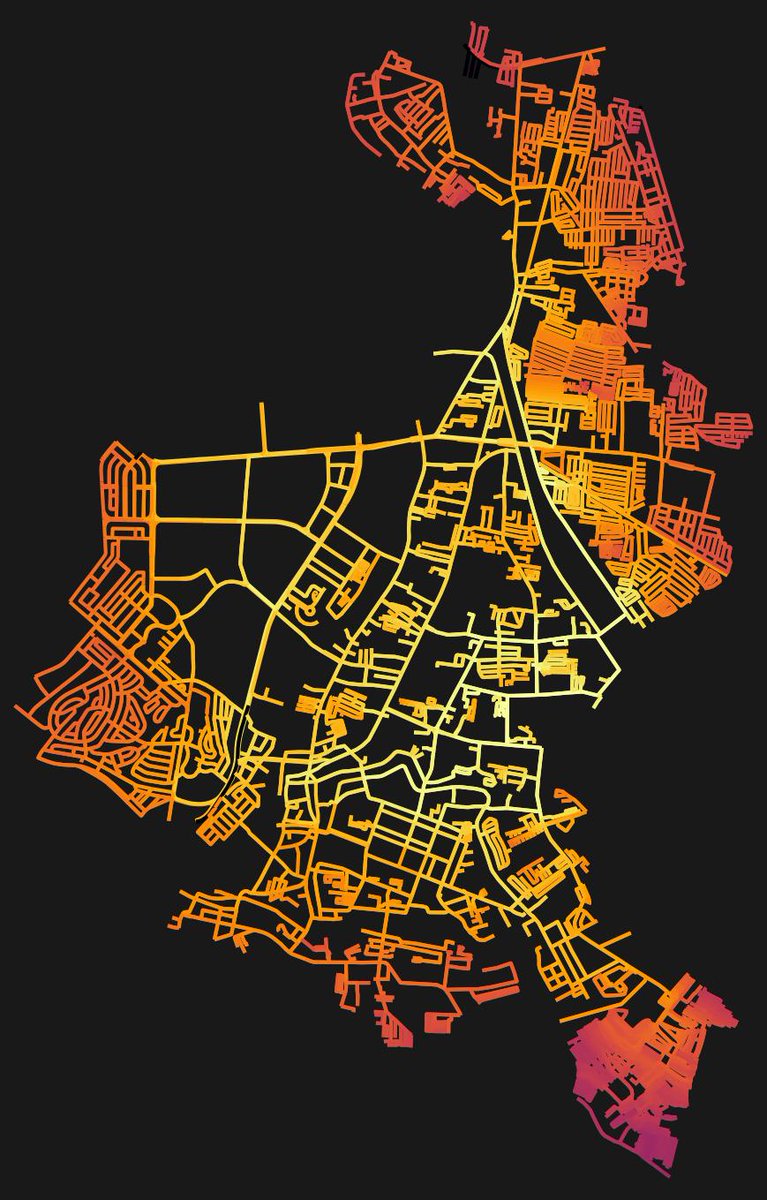
Vibe coded this into existence. Urban glow-up: Lucknow in neon lines. This isn’t just a map, it’s code, art, and city structure fused. Generated with #Python + #OSMnx using OpenStreetMap data. #DataArt #UrbanAesthetics #Lucknow #VibeCoding #Geospatial

本日のFOSS4G KANSAIでのポスター発表に使用したソースコードです。 colab.research.google.com/drive/1W1c3Hhk… OSMnxを使って大阪市北区の道路の媒介中心性と近接中心性を可視化した結果、河川という地理的制約による交通集中と、商業地域としての梅田周辺の高アクセス性が浮かび上がってきました。 #foss4gj #osmnx
Urban Mandala: Lucknow Vibe coded this into existence. Why is it beautiful? Because cities find rhythm even without blueprints. Order hides in chaos. Map generated with #OSMnx Data: OpenStreetMap


Isócronas en #Python con datos #openstreetmap y el paquete #OSMnx openstreetmap.org/user/kaxtillo/…
Claudeと対話したメモ。OSMnxで取得した道路ネットワークから道路ネットワークの構造的特性、接続性、密度、中心性などの指標を算出して、SCFS(Standard deviation and Cosine similarity-based Feature Sによる説明力の高い特徴量の選定する手順。 #OpenStreetMap #osmnx zenn.dev/mopinfish/scra…
本日の発表資料をSpeakerDeckにアップロードしました。 OSMnx Galleryの紹介 speakerdeck.com/mopinfish/osmn… #osmnx #FOSS4GJ
speakerdeck.com
OSMnx Galleryの紹介
2025/05/27 FOSS4G LT会 #2 での発表資料。 OSMnxのexampleをWeb上で実行できるアプリをStreamlitで作りました。
OSMnxで取得した江東区の道路ネットワークに標高データを付与し、標高の下位5%が浸水すると仮定して寸断される道路を可視化した。こうしてみると臨海部よりもむしろ、荒川周辺部の方が標高が低く寸断リスクが高そうです。 #OpenStreetMap #osmnx ソースコード ➡︎ colab.research.google.com/drive/1OgMNdm2…

OSMnxによる等時圏分析(アイソクロンマップ)を作成できるツールをStreamlitで作りました。任意の時速で歩行した際に5分/10分/15分で到達できるエリアをポリゴンで可視化します。中心点は任意の場所を指定できるように後で修正したい。 #OpenStreetMap #osmnx osmnx-gallery.streamlit.app/13_isolines_is…

pandanaによるネットワーク解析の習作のために、江東区のカフェへのアクセシビリティをosmnxで可視化した。amenity:cafeのタグで取得したカフェのPOIを集計。こうしてみると清澄白河方面にカフェが充実していることがよくわかりますね。 Colab ➡︎ colab.research.google.com/drive/16vnwscL… #osmnx #OpenStreetMap

東京都内の駅周辺の回遊性を評価するため、OSMnxを用いて回路指数 (μ)を計算した。回遊性上位には仲御徒町などの歴史的下町地区が連ねる一方、回遊性が低位の駅には川井駅など奥多摩線沿いの駅が並びました。仲御徒町周辺の道路網は複雑な格子状となる一方、川井駅は簡素な構造をしている。 #osmnx


Network Analysis: Shortest path, Degree Centrality, Betweenness Centrality Tutorial Link: youtube.com/live/XC8T7kV56… #network #shortestpath #osmnx #centrality #betweenness #networkx
#OSMnx Principales caracteristicas del paquete de #Python para descargar, modelar, analizar y visualizar fácilmente características geoespaciales de #OpenStreetMap link.medium.com/4qHvUycdTPb
link.medium.com
OSMnx Caracteristicas
OSMnx es un paquete de Python para descargar, modelar, analizar y visualizar fácilmente redes de calles y otras características…

#osmnx sur @rouen "en rose les voies probablement à 30km/h, en vert celles qui ont été renseignées à 30km/h." via tykayn mamot.fr/@tykayn@mastod…

😎I mapped the street #networks of #German 🇩🇪 cities using #OSMnx in #Python 🐍, highlighting the unique layouts of #Bonn, #Köln, #Düsseldorf, #FrankfurtamMain, #München, #Münster, #Stuttgart and #Berlin. 📢 Thanks to @milan_janosov for his guidance📚 #UrbanExploration #Dataviz

I've created a visualization of network routes using PyVista & OSMnx! 🗺️📷 Explore the power of these tools in my latest tutorial 📷📷 #PyVista #OSMnx #NetworkVisualization #DataScience #GIS 📷 spatial-dev.guru/2024/01/14/net…


"Find the Way: from Python to OpenStreetMap" by @ArcoEmere @OpenStreetMapIt @PythonTorino - Find the Way: from Python to OpenStreetMap #workshop #openstreetmap #osmnx #osmapi #python


playing w/ #osmnx, wrote script to measure route straightness; inspired by @TransitCenter #StraighterIsGreater 👀 kuanbutts.com/2017/07/29/tra…

Why i can't obtain driving network of the United States with the package OSMNX in python? stackoverflow.com/questions/6808… #openstreetmap #osmnx #python
How to add an edge to osmnx data in python? stackoverflow.com/questions/7174… #networkx #osmnx #python


OSMNX graph to distance matrix and DBSCAN stackoverflow.com/questions/6476… #python #dbscan #osmnx #parallelprocessing #networkx

Ukrainian cities with a population of more than 250,000 inhabitants as of 2014. Square-mile street network visualization. #30DayMapChallenge Day 02: Lines tools: #Python #OSMnx data: #OpenStreetMap Thank you @gboeing for the excellent tools!

P.P.S. The road networks were generated using @gboeing's #OSMnx and, of course, @openstreetmap data. Thank you!

#SanDiego is a series of disconnected islands of relative flatness, separated by huge valleys, compounded by freeways. Made w/ #osmnx.


Network Analysis: Shortest path, Degree Centrality, Betweenness Centrality Tutorial Link: youtube.com/live/XC8T7kV56… #network #shortestpath #osmnx #centrality #betweenness #networkx
😎I mapped the street #networks of #German 🇩🇪 cities using #OSMnx in #Python 🐍, highlighting the unique layouts of #Bonn, #Köln, #Düsseldorf, #FrankfurtamMain, #München, #Münster, #Stuttgart and #Berlin. 📢 Thanks to @milan_janosov for his guidance📚 #UrbanExploration #Dataviz


Added segment distance to spectral graph of the Laplacian of Berkeley walk network. OSM data converted to graph via #OSMnx.
Something went wrong.
Something went wrong.
United States Trends
- 1. Broncos 33.5K posts
- 2. Raiders 43.3K posts
- 3. #911onABC 22.2K posts
- 4. Bo Nix 6,473 posts
- 5. Geno 7,201 posts
- 6. AJ Cole N/A
- 7. GTA 6 83K posts
- 8. #WickedOneWonderfulNight 2,692 posts
- 9. Chip Kelly N/A
- 10. eddie 43.4K posts
- 11. #TNFonPrime 2,606 posts
- 12. #RaiderNation 2,635 posts
- 13. Crawshaw N/A
- 14. tim minear 2,589 posts
- 15. Ravi 15.3K posts
- 16. Cynthia 36K posts
- 17. Jeanty 4,206 posts
- 18. Al Michaels N/A
- 19. #RHOC 1,935 posts
- 20. Mostert N/A