#scichart search results

Android scichart axis major gridline not drawn on screen orientation change stackoverflow.com/questions/6524… #scichart #android


Have you ever seen a #JavaScript #Chart do this? Now you have! #SciChart has the fastest JavaScript Chart library available for real-time, big-data scientific & engineering apps
Here’s a quick video of a crypto currency trading app made with #SciChart iOS & Android. With SciChart you can build real interactive live #trading applications with technical indicators, zooming panning, cursors and more. Perfect for brokerages or hedge funds building apps.

Everyone else is firing. At @SciChart we’re hiring. We added 1 sales staff and 1 JS dev in the last few weeks. Now looking for a #WPF Developer. Are you a C# WPF dev with previous experience of #SciChart? Dm me

Well that was quick, we hired an expert to help us create a PoC of SciChart.js with Blazor and the hello-world is here already! Expanding & working on this PoC in the near future to show you #SciChart + #Blazor #JavaScript

SciChart.js will be so fast, it will be able to draw millions of points at real-time interactive frame-rates. Here's a simple real-time demo displaying 10 series, each with 100k points (1 million points total) at ~30 FPS in a browser. #SciChart #Javascript #DataVisualization


Excited to be at the #scichart #scioutreach workshop today @scienceworldca ! Looking forward to meeting all the #scioutreach #scicomm folks in #YVR

One of the coolest applications we have seen. Université de Toulon used #SciChart #WPF in the Robot Soccer World Cup 2019. #LiDAR helps the robots navigate. SciChart visualises the positions & decisions of robot players. Read more at: rct.univ-tln.fr #DataVisualization
Need to see Big-Data or ultra realtime graphs in your #Xamarin apps? #SciChart is working on a wrapper for our native, high performance #iOS #Android #Charts in #XamarinForms. More information coming soon! ... #DataVisualization

The recent release of v3.4 of SciChart.js ushered in a HUGE number of features, fixes and changes! Explore them in our comprehensive video playlist: youtube.com/playlist?list=…. #javascript #SciChart #chartlibrary #datavisualization #BigData #charts #Developers

"🚀 Unbelievable performance! SciChart.js renders 1 million data-points in 15ms using WebAssembly & WebGL. Fastest JavaScript chart library in the world! Explore the live demo now! #SciChart #JavaScript #WebAssembly #WebGL #Charts" ift.tt/m2RDxXq
dev.to
SciChart.js Performance Demo: 1 Million Datapoints in under 15ms
// Are you looking for the Fastest JavaScript Charts? SciChart.js, our Ultra-High Performance...
📱 Setting up Android Dev Environment on OSX. Learn to install Java JDK, Android Studio, NDK, Gradle & set environment variables. Essential for SciChart Android development. By Andrew Bt. #AndroidDev #SciChart #Java #AndroidStudio #OSX 📱 ift.tt/I4lUGty
dev.to
Setting up an Android Development Environment on OSX
The following guide will help you setup a Development Environment for Android on Mac OSX. This is...
Check out the amazing development of SciChart's Android Chart for the medical industry, showcasing incredible performance even on low-power devices like Freescale iMX-6! 📊 #SciChart #AndroidChart #RealTimeDataVisualization ift.tt/o18ftPx
dev.to
Case Study: Real-time Android Charts for Medical Industry
About a year and a half ago, IMT AG (Information Management Technology) approached us to ask about...
Learn how to add SciChartOverview or Scrollbar to Multi-paned Stock Charts using the new v3.2 ScrollBar API. Check out the solution for binding to SciChartGroup Templated Items and the code walkthrough by Andrew Bt. #SciChart #DataVisualization #WPF #Sil… ift.tt/QUj2ZwT
dev.to
How to add a SciChartOverview or Scrollbar with an ItemsControl of charts, or SciChartGroup
A frequently asked question at SciChart is how can I add a SciChartOverview to a Multi-paned Stock...
"🚀 Insane performance breakthrough by SciChart! Their latest version can draw 1,000,000 scatter points at 15FPS on an i7 Quad-core workstation. Check out the ParallelEllipsePointMarker type for the details. #SciChart #DataViz #WPF #ParallelRendering 📊" ift.tt/8vngz3q
📊 SciChart's Android Chart Performance Comparison reveals SciChart as the fastest Android Chart Library, beating competitors by a wide margin. Real-time updates and big-data visualization? SciChart is the way to go! #Android #Charting #SciChart #Perform… ift.tt/NQHiqSV
dev.to
Android Chart Performance Comparison
Android Chart Performance: TLDR In this post, we compare the performance of five of the major...
"Transform your data into compelling visual stories with SciChart.js! Discover the power of JavaScript charts for dynamic data visualization and engage your audience like never before. #DataViz #JavaScript #SciChart" ift.tt/lbF59WB
📊 Exciting news from @SciChart! They're working on v4.3 with new features for 3D Charts. Share your feedback on important requirements for Surface Mesh Charts. Your input shapes the future! #SciChart #3DCharts #Feedback 📊 ift.tt/gpXmEVO
dev.to
Requirements for 3D Surface Mesh Charts
Hey everyone! Even though the release of SciChart WPF v4.2 is barely a day old(!) we are already...
𝗖𝗵𝗼𝗼𝘀𝗶𝗻𝗴 𝘁𝗵𝗲 𝗿𝗶𝗴𝗵𝘁 𝗰𝗵𝗮𝗿𝘁 𝗹𝗶𝗯𝗿𝗮𝗿𝘆 is crucial for modern data-driven applications. We compare two popular solutions. Read on for our verdict! #react #SciChart #chartlibrary #datavisualization #dataengineering #developerlife scichart.com/blog/best-reac…

SciChart for @AvaloniaUI XPF is here: High-Performance Charting for Windows & Linux - No Code Rewrite Needed! Explore at the link 👇 #SciChart #avalonia #WPF #Linux #DotNet #csharp #developers #datavisualization #BigData #chartlibrary scichart.com/introducing-av…
scichart.com
SciChart Avalonia XPF: High-Performance Charting for Windows & Linux
Discover SciChart Avalonia XPF, providing consistent charting for Windows and Linux. We’re excited to offer this cross-platform charting solution to customers.
SciChart.js can render 100 charts, each with 100 000 points, for a total of 10 million data-points and 60k new points per second, at an FPS of 50-60 ... ! #react #javascript #SciChart #chartlibrary #DataVisualization #BigData #dashboard #realtimedata scichart.com/blog/creating-…
scichart.com
Creating a React Drag & Drop Chart Dashboard Performance Demo with 100 Charts
Showcasing the extreme Performance of SciChart.js in React, this dynamic Dashboard Demo creates 100 real-time charts with drag & drop, resize
The recent release of v3.4 of SciChart.js ushered in a HUGE number of features, fixes and changes! Explore them in our comprehensive video playlist: youtube.com/playlist?list=…. #javascript #SciChart #chartlibrary #datavisualization #BigData #charts #Developers
We've had a minor release published for SciChart.js version 3.4.672, which addresses performance issues after a recent Chrome update, and minor fixes reported by users - with our thanks. Details can be found in the changelog below. #Scichart #chartlibrary scichart.com/changelog/scic…
scichart.com
SciChart.JS Changelog
Stay up to date with SciChart's most recent updates, using our Changelog. Don't miss out on key information regarding SciCharts important updates.
Big news: the release of v3.4.662 of SciChart.js! There are a HUGE number of changes in this release so explore them in our update, with links to documentation, examples and more. #Javascript #Scichart #chartlibrary #datavisualization #bigdata scichart.com/scichart-js-v3…
scichart.com
SciChart.js v3.4 Released!
We’ve moved over to a new format for communicating our releases and updates of our high performance JavaScript Charts library, by publishing […]
SciChart has been working with the the genius Avalonia UI team for some time, to bring you an Avalonia XPF compatible version of SciChart WPF that will run on Linux! #WPF #Linux #SciChart #avalonia #embeddeddevice #embeddedsystems scichart.com/blog/running-s…
![scichart's tweet card. Over the years the question has cropped up many times “Does SciChart run on Linux?” SciChart – a cross platform chart […]](https://pbs.twimg.com/card_img/1988874794574446592/btYgCTGa?format=jpg&name=orig)
Over the years the question has cropped up many times, “Can you run SciChart on Linux?” The short answer - yes you can! Read all about how we made it happen ... #SciChart #Linux #WPF #embeddedsystems #chartlibrary #BigData #Datavisualization #windows scichart.com/blog/running-s…
Learn how to add SciChartOverview or Scrollbar to Multi-paned Stock Charts using the new v3.2 ScrollBar API. Check out the solution for binding to SciChartGroup Templated Items and the code walkthrough by Andrew Bt. #SciChart #DataVisualization #WPF #Sil… ift.tt/QUj2ZwT
dev.to
How to add a SciChartOverview or Scrollbar with an ItemsControl of charts, or SciChartGroup
A frequently asked question at SciChart is how can I add a SciChartOverview to a Multi-paned Stock...
"🚀 Insane performance breakthrough by SciChart! Their latest version can draw 1,000,000 scatter points at 15FPS on an i7 Quad-core workstation. Check out the ParallelEllipsePointMarker type for the details. #SciChart #DataViz #WPF #ParallelRendering 📊" ift.tt/8vngz3q
📊 SciChart's Android Chart Performance Comparison reveals SciChart as the fastest Android Chart Library, beating competitors by a wide margin. Real-time updates and big-data visualization? SciChart is the way to go! #Android #Charting #SciChart #Perform… ift.tt/NQHiqSV
dev.to
Android Chart Performance Comparison
Android Chart Performance: TLDR In this post, we compare the performance of five of the major...
Check out the amazing development of SciChart's Android Chart for the medical industry, showcasing incredible performance even on low-power devices like Freescale iMX-6! 📊 #SciChart #AndroidChart #RealTimeDataVisualization ift.tt/o18ftPx
dev.to
Case Study: Real-time Android Charts for Medical Industry
About a year and a half ago, IMT AG (Information Management Technology) approached us to ask about...
📊 Exciting news from @SciChart! They're working on v4.3 with new features for 3D Charts. Share your feedback on important requirements for Surface Mesh Charts. Your input shapes the future! #SciChart #3DCharts #Feedback 📊 ift.tt/gpXmEVO
dev.to
Requirements for 3D Surface Mesh Charts
Hey everyone! Even though the release of SciChart WPF v4.2 is barely a day old(!) we are already...
"Transform your data into compelling visual stories with SciChart.js! Discover the power of JavaScript charts for dynamic data visualization and engage your audience like never before. #DataViz #JavaScript #SciChart" ift.tt/lbF59WB
📱 Setting up Android Dev Environment on OSX. Learn to install Java JDK, Android Studio, NDK, Gradle & set environment variables. Essential for SciChart Android development. By Andrew Bt. #AndroidDev #SciChart #Java #AndroidStudio #OSX 📱 ift.tt/I4lUGty
dev.to
Setting up an Android Development Environment on OSX
The following guide will help you setup a Development Environment for Android on Mac OSX. This is...
"🚀 Unbelievable performance! SciChart.js renders 1 million data-points in 15ms using WebAssembly & WebGL. Fastest JavaScript chart library in the world! Explore the live demo now! #SciChart #JavaScript #WebAssembly #WebGL #Charts" ift.tt/m2RDxXq
dev.to
SciChart.js Performance Demo: 1 Million Datapoints in under 15ms
// Are you looking for the Fastest JavaScript Charts? SciChart.js, our Ultra-High Performance...
Everyone else is firing. At @SciChart we’re hiring. We added 1 sales staff and 1 JS dev in the last few weeks. Now looking for a #WPF Developer. Are you a C# WPF dev with previous experience of #SciChart? Dm me
Have you ever seen a #JavaScript #Chart do this? Now you have! #SciChart has the fastest JavaScript Chart library available for real-time, big-data scientific & engineering apps
One of our users has published an open source wrapper for SciChart.js in MS Blazor. It's early days but looks very promising! SciChart #SciChart #JavaScript #datavisualization #Blazor github.com/NRTDP/SciChart…
github.com
GitHub - NRTDP/SciChartBlazor: A Blazor wrapper for SciChart JS
A Blazor wrapper for SciChart JS. Contribute to NRTDP/SciChartBlazor development by creating an account on GitHub.


Android scichart axis major gridline not drawn on screen orientation change stackoverflow.com/questions/6524… #scichart #android
Everyone else is firing. At @SciChart we’re hiring. We added 1 sales staff and 1 JS dev in the last few weeks. Now looking for a #WPF Developer. Are you a C# WPF dev with previous experience of #SciChart? Dm me
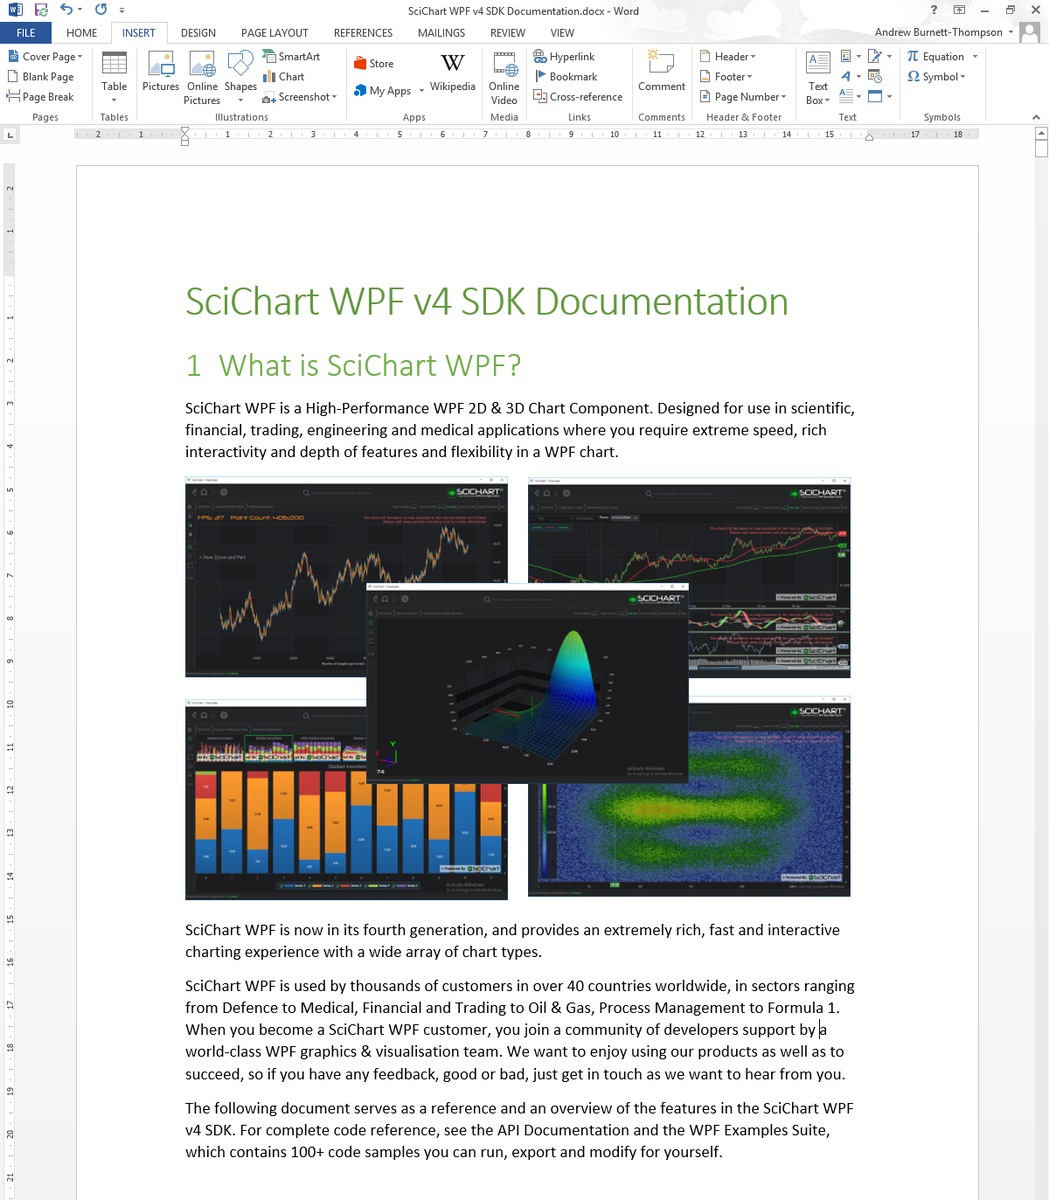
We're furiously writing documentation for #SciChart v4 SDK. Spare a thought for us! 92 pages down, 100 to go!
How Fast is #SciChart's #WPF #Chart? scichart.com/how-fast-is-sc… Comparison of versions & #DirectX #BigData #Performance

Yesterday representatives from SciChart attended a Royal Reception at Buckingham Palace in honour of the #QueensAwards for Enterprise. We are honoured to be part of this prestigious award & for SciChart to be selected as a winner in the #Innovation category, 2019. #SciChart


Well that was quick, we hired an expert to help us create a PoC of SciChart.js with Blazor and the hello-world is here already! Expanding & working on this PoC in the near future to show you #SciChart + #Blazor #JavaScript
Excited to be at the #scichart #scioutreach workshop today @scienceworldca ! Looking forward to meeting all the #scioutreach #scicomm folks in #YVR
This #Android #iOS Vital Signs / ECG monitor demo is coming to the #SciChart examples app soon. Showcasing how to create a realistic real-time medical UI using SciChart with incredible performance on both Android and iOS devices.
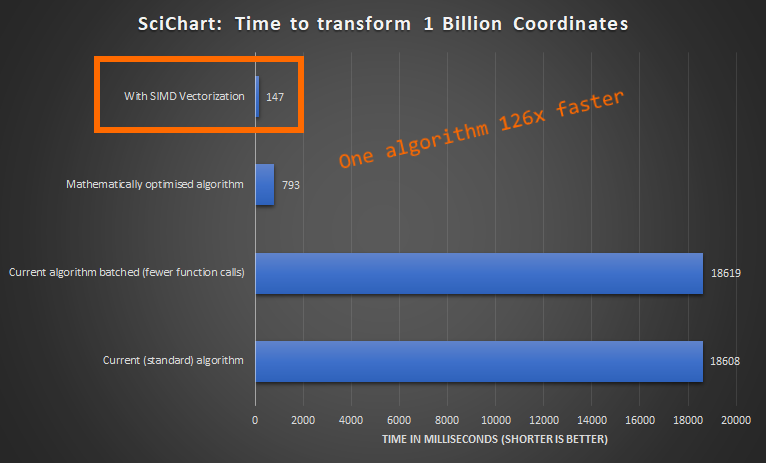
A sneak peak into the extreme measures we go to, to make #SciChart the fastest possible #Charts on the #WPF platform. One key algorithm optimised with Intel SIMD Intrinsics: was 18,000 milliseconds to process 1 Billion coordinates, now 147 milliseconds *126x faster* #dotnet
Need to see Big-Data or ultra realtime graphs in your #Xamarin apps? #SciChart is working on a wrapper for our native, high performance #iOS #Android #Charts in #XamarinForms. More information coming soon! ... #DataVisualization
We did a lines of code count in @scichart and discovered to our surprise that our library now has 3.5 MILLION lines of code across platforms! #SciChart is going strong & represents a huge value-add to your #iOSDev #AndroidDev #wpf #DataVisualization projects

Case study: Medical grade #Android wearable device with real-time physiological data acquisition via Bluetooth, enabling analysis & visualisation of Blood Volume Pulse (BVP), Heart Rate Variability, electrical variations on the skin scichart.com/wp-content/upl… #scichart #wearable

Something went wrong.
Something went wrong.
United States Trends
- 1. Clemson 9,914 posts
- 2. #SmackDown 44.3K posts
- 3. Zack Ryder 13.3K posts
- 4. Dabo 1,737 posts
- 5. Landry Shamet 4,827 posts
- 6. Matt Cardona 2,488 posts
- 7. #OPLive 2,107 posts
- 8. Brohm 1,157 posts
- 9. #CLAWMARK3D 25.5K posts
- 10. Miller Moss N/A
- 11. Steph 31K posts
- 12. #BostonBlue 2,499 posts
- 13. Marjorie Taylor Greene 33.9K posts
- 14. Will Richard 4,475 posts
- 15. Kon Knueppel 2,348 posts
- 16. Ersson N/A
- 17. #TNATurningPoint 7,693 posts
- 18. Tre Mann 5,467 posts
- 19. Bill Clinton 167K posts
- 20. Charles Lee N/A