#visualdata نتائج البحث


Oops, I zoomed in too far, and now I’m best friends with the data. Reset button, please?" Source: devhubby.com/thread/how-to-… #DataGeek #VisualData #InteractiveGraphics #DevCommunity #zoom #reset


🤖🖼️ From medical diagnostics to security and retail, #AIbasedImageAnalysis is reshaping industries by transforming #VisualData into actionable intelligence: bit.ly/3JMm8h2 #ComputerVision #SmartTechnology #AIdrivenImageAnalysis #ImageAnalysis


✨ We are mastering #MasteryConnect together at @APSMLK! Growing, learning, and leveling up to support student success! 💡📊 #UndeniableImpact #VisualData #TeacherTraining #EdTech @APSInstructTech


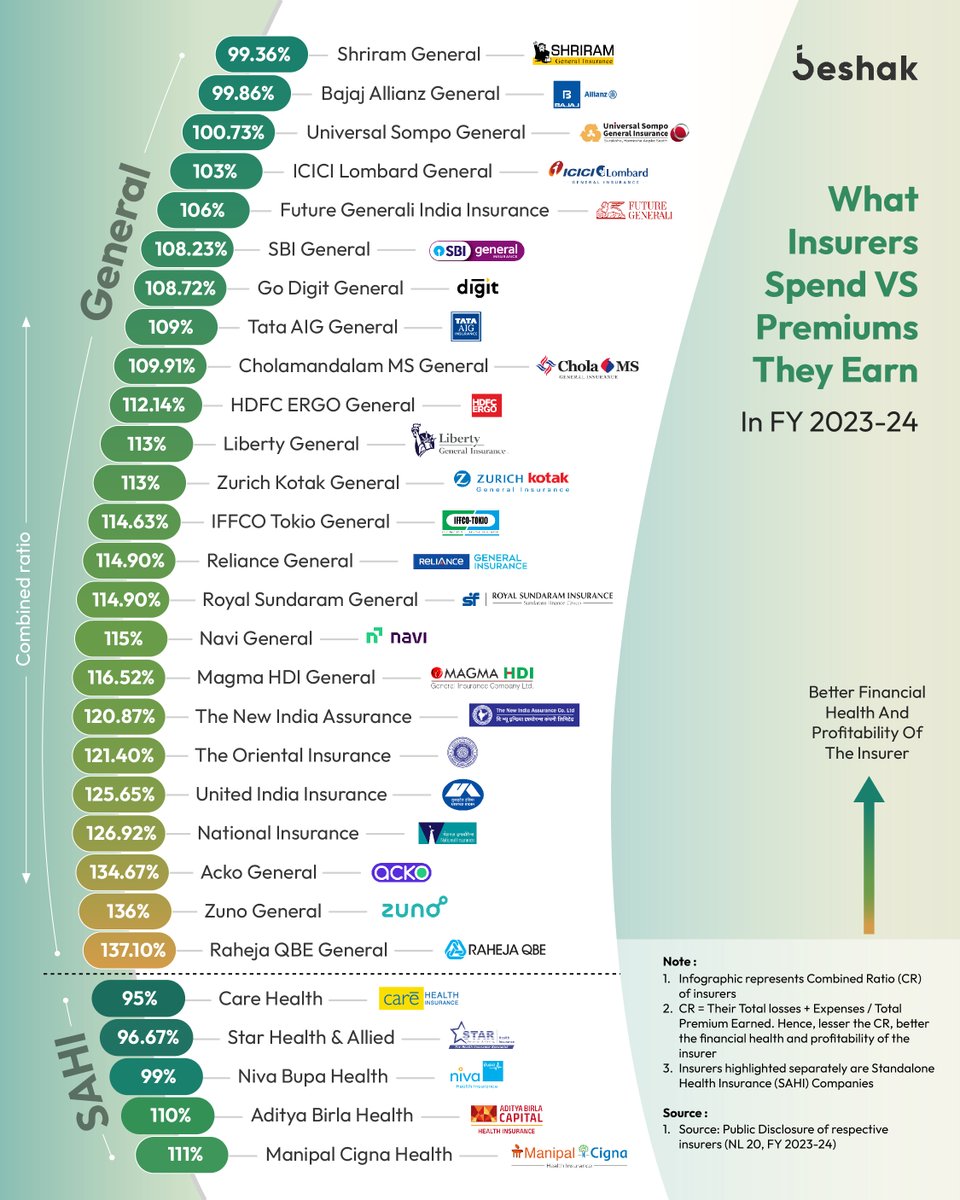
Who's making the monii?! 💰 We dug deep and found out the profitability and financial health of 24 general and 5 Standalone Health Insurance (SAHI) companies. Read on 👇 #visualdata #combinedratio #profitable #generalinsurance #healthinsurance #premium #infographic

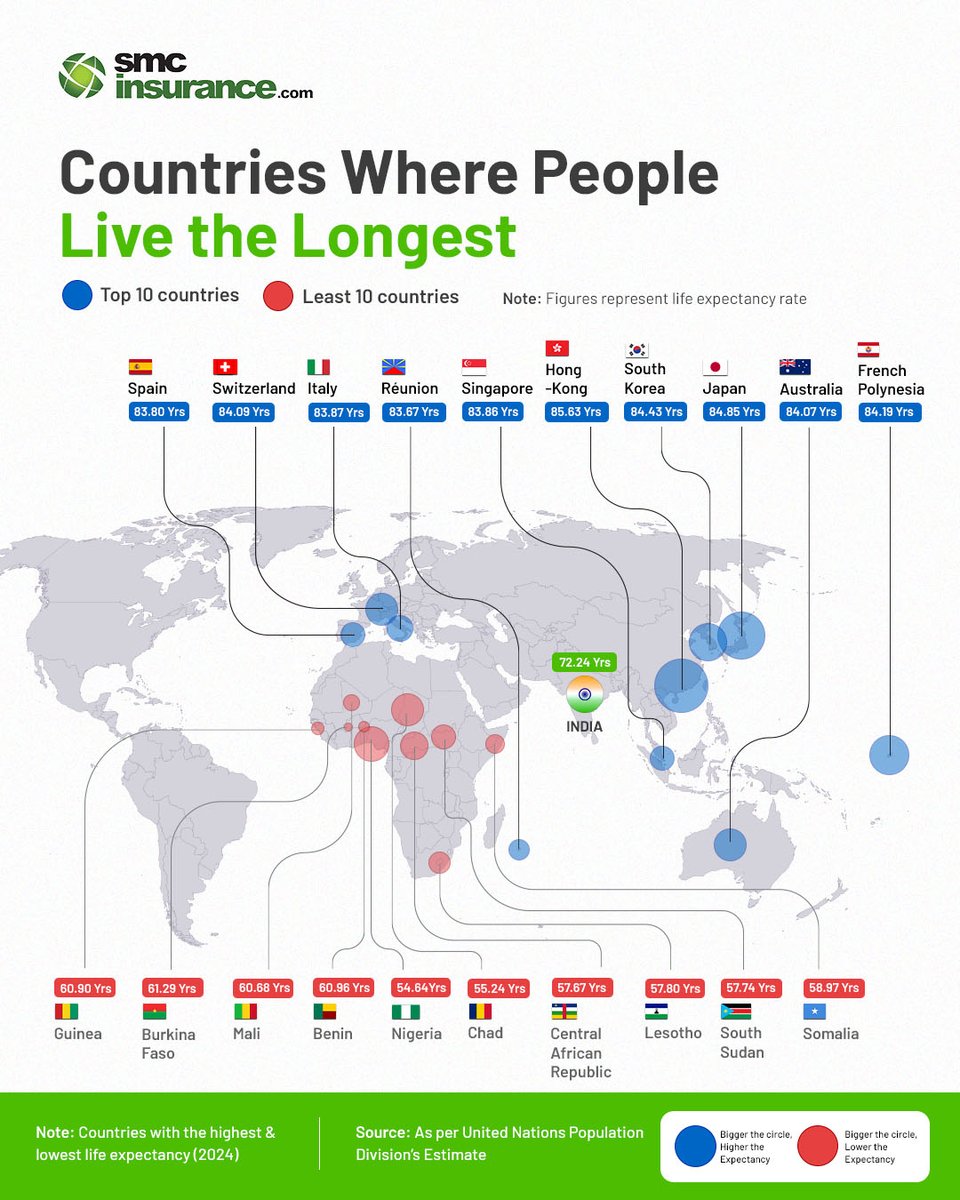
What’s on your plate decides how long you live! 🍜 How? A very interesting infographic and thread 👇 #lifeexpectancy #infographic #visualdata #dataanalysis #healthtips #fitnesstips
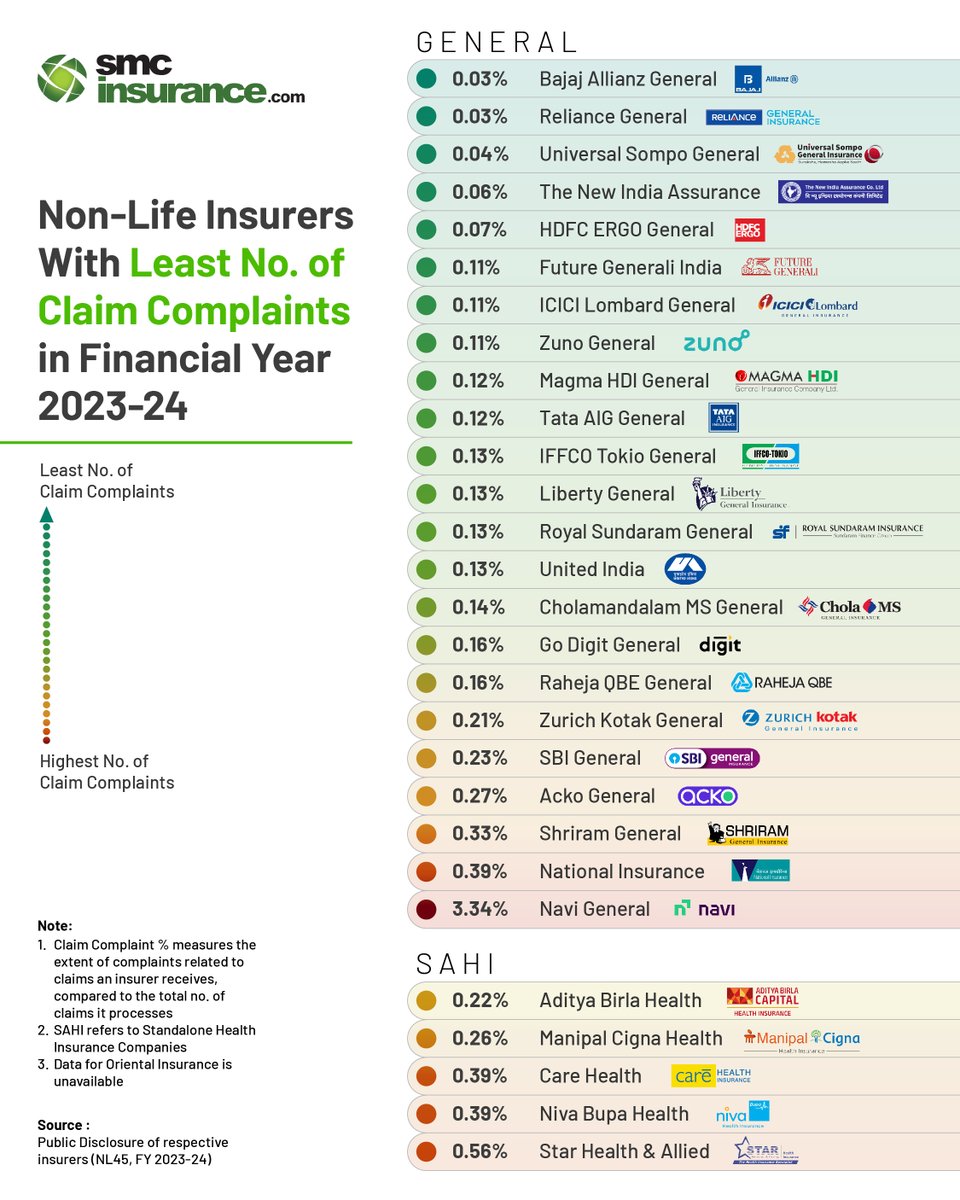
Curious to know how’d your claim experience with non-life insurers be? 🤔 One smart way to get a glimpse is by checking their Claim Complaint %. Check this out 👇 #infographic #visualdata #bestpolicy #claims #healthinsurance #generalinsurance

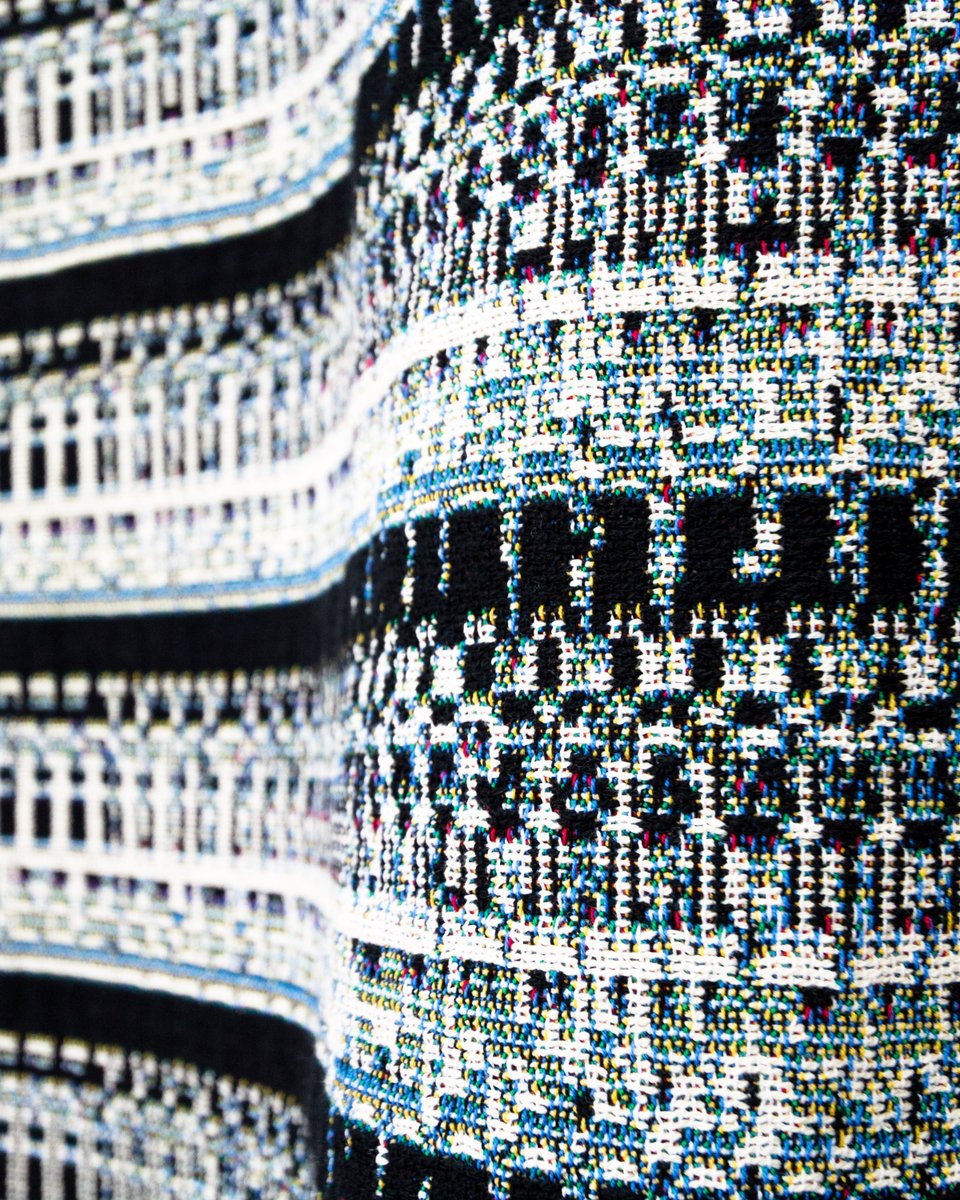
Data Visions Collection Growth Potential Throw - Detail glitchtextiles.com/woven-throws/d… #creativecoding #uniqlo #visualdata #datavis #dataviz #glitchtextiles #textiles #textiledesign #textileart #woven


Gambar ini —dan komentar orang2 tentangnya—mengungkap banyak hal ttg cara pandang orang2 Indonesia tentang Papua. Mari menyimak! Beginilah #IndonesiaDiPapua #PapuaDataNetwork #VisualData


TNI mempermainkan & Melecehkan Gereja Kristen (Rumah Tuhan Yesus) di Nduga Papua. Ini sebuah pelecehan terhadap Agama. Saya ingin tahu apakah ini perintah @jokowi, Panglima TNI. Saya minta PGI dan KWI harus protes ke Markas Besar TNI.

A Year In Code 1. iTunes Binary Throw - Detail 2. iTunes Binary Throw - Detail glitchtextiles.com #processing #datavisualization #visualdata #uniqlo #data #glitchtextiles #textiles #textiledesign #textileart #woven

Communicate complex information in an easily digestible way with visually-stunning infographics. #VisualData #DataVisualisation #InfographicDesign


#Argentina stands out as the only economy to have fallen out of the club of wealthy nations. In 1960, the country’s real GDP per capita was comparable to that of France. By 2000, France’s income attained the level 3.5 times as higher as the global average #econtwitter #visualdata


With visual data science, manufacturers gain a clear view of their production processes to drive performance improvements, enhance product quality, and optimise time management. Tune in to our on-demand webinar: hubs.ly/Q02Vkghk0 #UKMfg #VisualData #DigitalTransformation
1 brand sold more vehicles than the next 3 players combined! 💰 Over 17 lakh units🚗 And one brand came late and still rose up super fast! Check this interesting infographic out👇 #notsponsored #infographic #visualdata #carbrands #indiancars #carsofindia #bestselling #trending

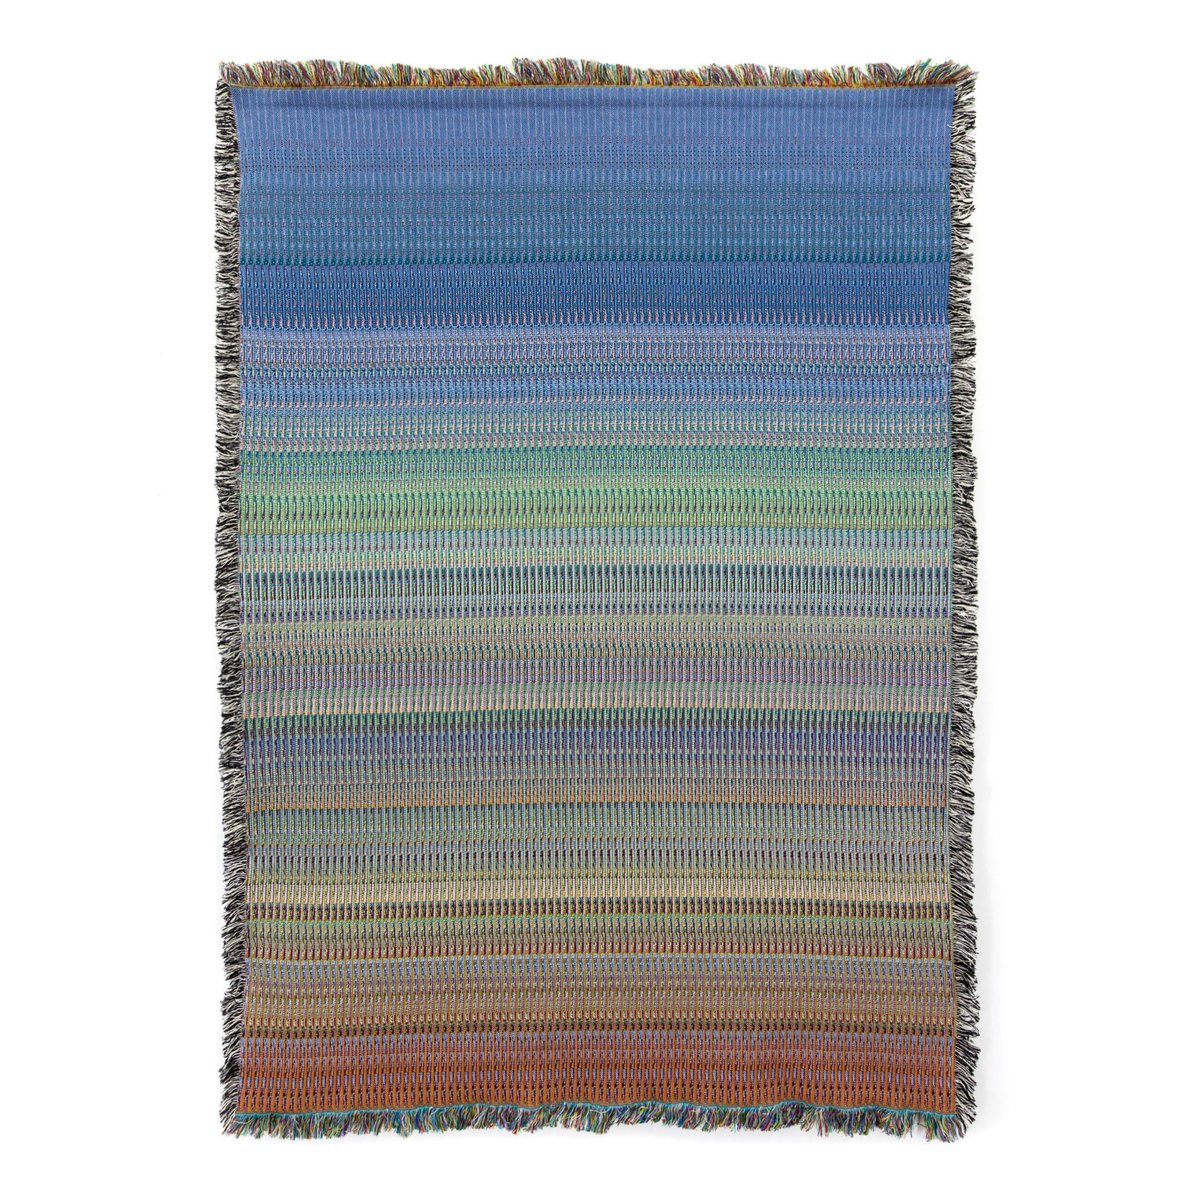
Data Visions Collection 1. Warm Prospects Throw - Detail 2. Emerging Markets Throw - Detail 3. Upward Trend Throw - Detail glitchtextiles.com #datavis #creativecoding #visualdata #processing #datavisualization #glitchtextiles #textiles #textiledesign #textileart #woven


2017 Interior Photoshoot Growth Potential Throw - Mood glitchtextiles.com/woven-throws/d… #uniqlo #creativecoding #visualdata #data #fastretailing #glitchtextiles #textiles #textiledesign #textileart #woven

Data Visions Collection 1. Emerging Markets Throw - Front 2. Upward Trend Throw - Detail glitchtextiles.com #uniqlo #datavis #visualdata #datavisualization #dataviz #glitchtextiles #textiles #textiledesign #textileart #woven


Data Visions Collection 1. Upward Trend Throw - Front 2. Growth Potential Throw - Detail glitchtextiles.com #dataviz #uniqlo #visualdata #datavisualization #processing #glitchtextiles #textiles #textiledesign #textileart #woven


Reveal hidden insights in your data. With Dashtera’s #Statistics Charts, you can generate continuous and discrete distribution charts — embedded, interactive, and ready to consume. Try Dashtera today. hubs.la/Q03MV1mw0 #DataAnalytics #VisualData #BusinessIntelligence

donors, partners, and audits 🔹 Add context that spreadsheets can’t capture Every picture strengthens accountability and builds confidence in your work. Show more than numbers. Start capturing impact with ShareCARD today: sharecardapp.com #VisualData #EvidenceBased


Enterprises ignore image data. Hackers don’t. Read the blog below to get experts insights on solving the biggest threat to enterprise security with AI. linkedin.com/pulse/how-solv… #Cybersecurity #IVDES #VisualData


🌉 Dive into the World of Sankey Charts! 🌊✨ Are you a Sankey fan or looking to become a master? #SankeyChart #SankeyMaster #VisualData 📈 Check out how San #sankeymaster #sankey 👉apps.apple.com/app/apple-stor…

Oops, I zoomed in too far, and now I’m best friends with the data. Reset button, please?" Source: devhubby.com/thread/how-to-… #DataGeek #VisualData #InteractiveGraphics #DevCommunity #zoom #reset
🤖🖼️ From medical diagnostics to security and retail, #AIbasedImageAnalysis is reshaping industries by transforming #VisualData into actionable intelligence: bit.ly/3JMm8h2 #ComputerVision #SmartTechnology #AIdrivenImageAnalysis #ImageAnalysis
✨ We are mastering #MasteryConnect together at @APSMLK! Growing, learning, and leveling up to support student success! 💡📊 #UndeniableImpact #VisualData #TeacherTraining #EdTech @APSInstructTech

Use dashboards that are visual, not just numerical. Make insights accessible. #LearningAnalytics #VisualData
Data Visions Collection Growth Potential Throw - Detail glitchtextiles.com/woven-throws/d… #creativecoding #uniqlo #visualdata #datavis #dataviz #glitchtextiles #textiles #textiledesign #textileart #woven


Oops, I zoomed in too far, and now I’m best friends with the data. Reset button, please?" Source: devhubby.com/thread/how-to-… #DataGeek #VisualData #InteractiveGraphics #DevCommunity #zoom #reset
🤖🖼️ From medical diagnostics to security and retail, #AIbasedImageAnalysis is reshaping industries by transforming #VisualData into actionable intelligence: bit.ly/3JMm8h2 #ComputerVision #SmartTechnology #AIdrivenImageAnalysis #ImageAnalysis
✨ We are mastering #MasteryConnect together at @APSMLK! Growing, learning, and leveling up to support student success! 💡📊 #UndeniableImpact #VisualData #TeacherTraining #EdTech @APSInstructTech

See what your cameras haven't been telling you about your business. 👀 Predictive maintenance uses #visualdata to foresee machine issues, #reducedowntime, and cut costs. Smarter #data, smoother operations. Read now: hubs.ly/Q02LvQrV0


Capture attention with creative infographics. Let’s design something amazing! 📊🎨 #InfographicDesign #VisualData

Data Visions Collection Growth Potential Throw - Detail glitchtextiles.com/woven-throws/d… #creativecoding #uniqlo #visualdata #datavis #dataviz #glitchtextiles #textiles #textiledesign #textileart #woven

🌍🏖️ Public holidays vary by country, influenced by cultural,national and religious events. #Productivity #WorldVisualized #VisualData #VisualInsights Source: Wikipedia

Communicate complex information in an easily digestible way with visually-stunning infographics. #VisualData #DataVisualisation #InfographicDesign
Gambar ini —dan komentar orang2 tentangnya—mengungkap banyak hal ttg cara pandang orang2 Indonesia tentang Papua. Mari menyimak! Beginilah #IndonesiaDiPapua #PapuaDataNetwork #VisualData
TNI mempermainkan & Melecehkan Gereja Kristen (Rumah Tuhan Yesus) di Nduga Papua. Ini sebuah pelecehan terhadap Agama. Saya ingin tahu apakah ini perintah @jokowi, Panglima TNI. Saya minta PGI dan KWI harus protes ke Markas Besar TNI.
A Year In Code 1. iTunes Binary Throw - Detail 2. iTunes Binary Throw - Detail glitchtextiles.com #processing #datavisualization #visualdata #uniqlo #data #glitchtextiles #textiles #textiledesign #textileart #woven
2017 Interior Photoshoot 1. PIC00008 Pillow - Mood 2. Emerging Markets Throw - Mood glitchtextiles.com #glitchart #visualdata #uniqlo #pillow #circuitbending #glitchtextiles #textiles #textiledesign #textileart #woven


Data Visions Collection 1. Warm Prospects Throw - Detail 2. Emerging Markets Throw - Detail 3. Upward Trend Throw - Detail glitchtextiles.com #datavis #creativecoding #visualdata #processing #datavisualization #glitchtextiles #textiles #textiledesign #textileart #woven
2017 Interior Photoshoot Growth Potential Throw - Mood glitchtextiles.com/woven-throws/d… #uniqlo #creativecoding #visualdata #data #fastretailing #glitchtextiles #textiles #textiledesign #textileart #woven
Data Visions Collection 1. Emerging Markets Throw - Front 2. Upward Trend Throw - Detail glitchtextiles.com #uniqlo #datavis #visualdata #datavisualization #dataviz #glitchtextiles #textiles #textiledesign #textileart #woven
Data Visions Collection 1. Upward Trend Throw - Front 2. Growth Potential Throw - Detail glitchtextiles.com #dataviz #uniqlo #visualdata #datavisualization #processing #glitchtextiles #textiles #textiledesign #textileart #woven
Who's making the monii?! 💰 We dug deep and found out the profitability and financial health of 24 general and 5 Standalone Health Insurance (SAHI) companies. Read on 👇 #visualdata #combinedratio #profitable #generalinsurance #healthinsurance #premium #infographic

[Recherche] Jessica Lichy, enseignante-chercheure à l'IDRAC BS, a participé à l’atelier de recherche "Visual Data Ethnography" organisé par le Dr. Derek Watson (@sunderlanduni - Faculty of Business & Technology) le 3 décembre dernier. #research #visualdata #sunderland
![IDRAC_BS's tweet image. [Recherche] Jessica Lichy, enseignante-chercheure à l'IDRAC BS, a participé à l’atelier de recherche "Visual Data Ethnography" organisé par le Dr. Derek Watson (@sunderlanduni - Faculty of Business & Technology) le 3 décembre dernier.
#research #visualdata #sunderland](https://pbs.twimg.com/media/GemjP_5XwAAYywF.jpg)
What’s on your plate decides how long you live! 🍜 How? A very interesting infographic and thread 👇 #lifeexpectancy #infographic #visualdata #dataanalysis #healthtips #fitnesstips
Something went wrong.
Something went wrong.
United States Trends
- 1. Bears 85.3K posts
- 2. Jake Moody 12.3K posts
- 3. Falcons 49.3K posts
- 4. Snell 21.9K posts
- 5. Bills 138K posts
- 6. Josh Allen 25.2K posts
- 7. Caleb 46.6K posts
- 8. #BearDown 2,142 posts
- 9. Jayden 21.4K posts
- 10. Swift 290K posts
- 11. #Dodgers 14.6K posts
- 12. Ben Johnson 3,963 posts
- 13. phil 158K posts
- 14. Turang 4,057 posts
- 15. Bijan 31.1K posts
- 16. #RaiseHail 8,283 posts
- 17. Roki 5,939 posts
- 18. Troy Aikman 5,681 posts
- 19. #NLCS 13.8K posts
- 20. Brewers 46.9K posts