#graphvisualization 검색 결과

Just finished integrating HAND Mode with our SPACEGRAPH engine ✋📷It can now perfectly visualize millions of data points. Navigate massive graph structures in space — using only your hands. #AI #BigData #GraphVisualization #3DVisualization

Exciting news! G.V() now supports Dgraph, bringing interactive graph visualization to your data exploration toolkit. Connect, query, and visualize your Dgraph data effortlessly. Discover more: hypermode.com/blog/G-V-bring… #GraphVisualization #Dgraph #GV


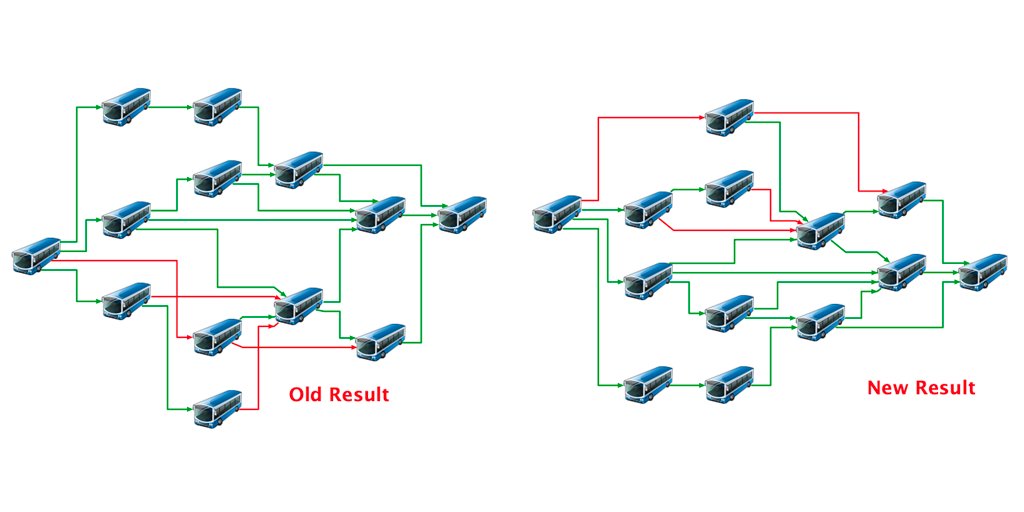
See our new Tom Sawyer Perspectives 13.2. We've spent the last two years improving our nested hierarchical layout. We've been able to reduce crossings by approximately 30% on average and sometimes the improvements are up to 50%. #graphvisualization #graphtechnology

#AdventOfCode 2024 - Day 8 Easy one today. Indexes, MERGEs #Cypher and #GraphVisualization with #Neo4j #Bloom puzzle: adventofcode.com/2024/day/8 solution: github.com/halftermeyer/A…


🚀 @Nitrograph — 초고속 그래프 시각화 도구! 복잡한 네트워크도 실시간으로 렌더링 ⚡ ✅ 대용량 데이터 처리 ✅ 직관적인 인터랙션 ✅ 개발자 친화적 API community.nitrograph.com ref code : I76V5NFK 지금, 시각화의 새로운 기준을 경험하세요. #Nitrograph #데이터시각화 #GraphVisualization

Revolutionize Your Data Analysis with Excel's Built-In Copilot? #ExcelCopilot #DataAnalysis #GraphVisualization #SmartInsights #ExcelFunctions #EfficientExcel #TimeSaver #ExcelTricks #DataCrunching #ExcelTips Full video: youtu.be/q5AlO6xzqQg

G.V() 3.38.90 is out, bringing official support for FalkorDB, quality of life improvements and a better graph style customization user experience. For a detailed breakdown of the features, check out our announcement at gdotv.com/blog/gdotv-rel… #graphvisualization #falkordb

Heatmaps are now available in Data Explorer for @neo4j v2! Use color-coded maps to visualize patterns in your graph and gain new insights. Analyze your data with ease and try it free: yworks.com/neo4j-explorer #Neo4j #DataExplorer #GraphVisualization #DataScience

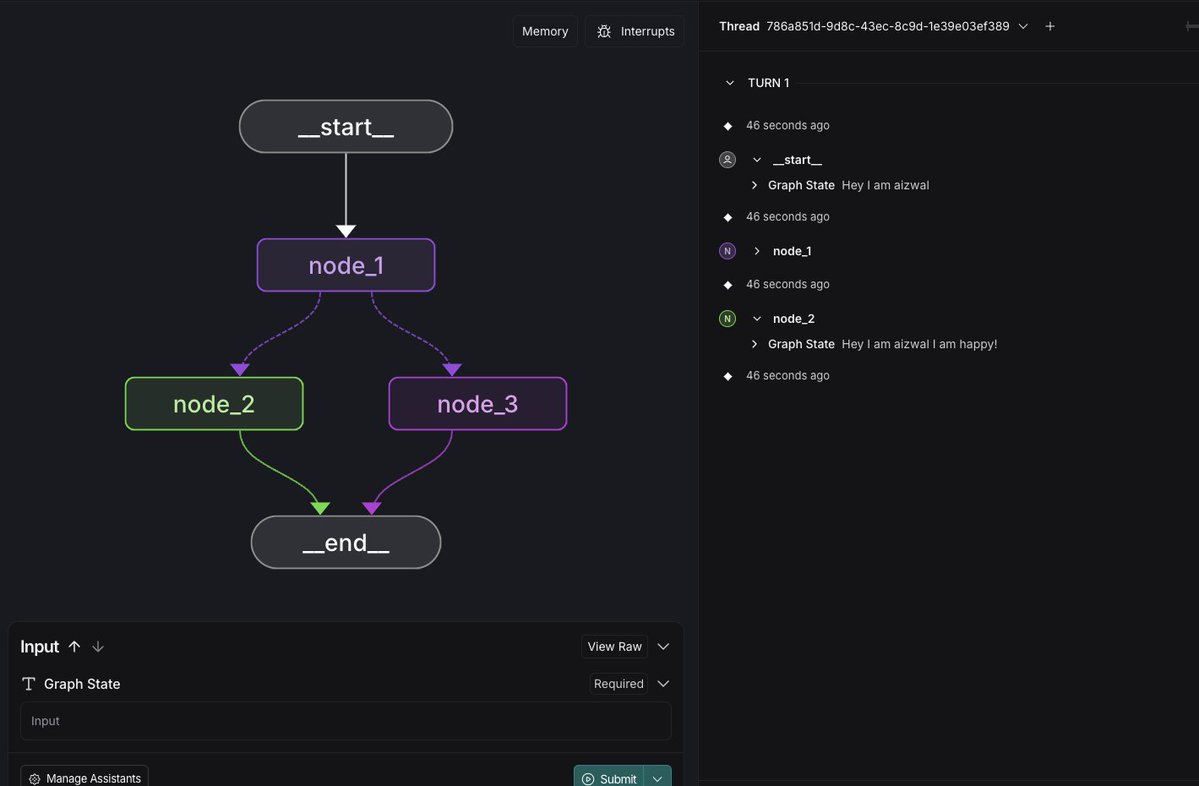
Just learned about LangGraph & it's mind-blowing! 🤩 This graph visualization is awesome. Seriously impressed. #LangGraph #AI #GraphVisualization #NLP

When you think you are the best you can still improve more. Check out our Hierarchical layout with even fewer crossings at bit.ly/4o3kDtL #DataExploration #DataAnalysis #GraphVisualization #GraphTechnology
[DEV PREVIEW] Support for #GQL on @Ultipa_Graph is almost ready for release on G.V()! Check out our quick preview below and stay tuned for the official release! #graphdatabase #graphvisualization
Don't miss out on our webinar series 'The Art of Graph Visualization'! Explore how graphs power our everyday lives, from finance to tech, and learn how #GraphVisualization enables you to understand complex data and create intuitive visual representations. us02web.zoom.us/webinar/regist…?

Don't miss out on the upcoming episode of our 'The Art of #GraphVisualization' #webinar series! Join us on Feb 28 at 5pm CET for 'The ABCs of Graph Styling' 😍 us02web.zoom.us/webinar/regist…

🚀 @Nitrograph — high-speed, high-fidelity graph visualization. Handle millions of nodes with real-time rendering ⚡ Designed for developers, analysts, and data lovers. Fast. Scalable. Beautiful. community.nitrograph.com REF CODE: I76V5NFK #Nitrograph #GraphVisualization #DevTools

With our latest #GraphVisualization SDK versions, you can add images to node labels to make them more meaningful, instantly recognizable and unique. We've also updated our getting started tutorials to use open-source build tool Vite. Find out more: hubs.li/Q02GVMPJ0


Let's explore the benefits of using #graphvisualization to analyze and understand local documents. Learn how this approach can improve #productivity, knowledge management, and decision-making. bit.ly/graph-viz #datavisualization #graphrag

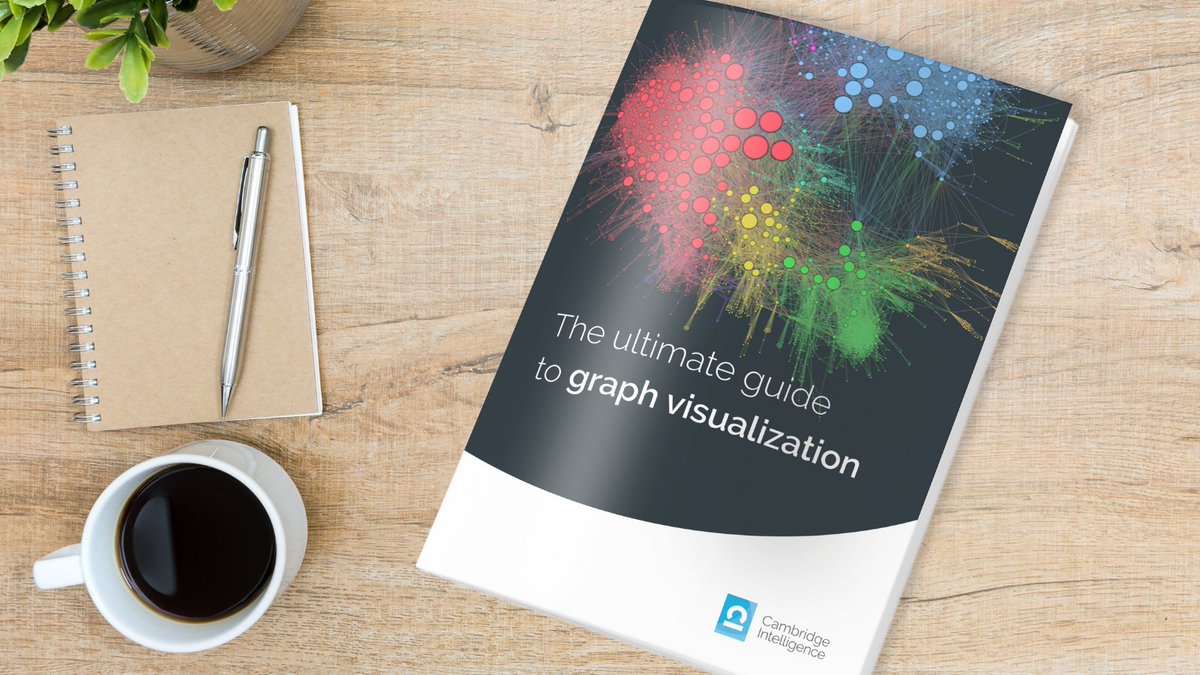
The ultimate guide to graph visualization is our most downloaded white paper. And we’ve just given it a refresh for 2024: hubs.ly/Q02qrJMr0 It’s a must-read resource for anyone interested in #GraphVisualization and #DataVisualization
Could the visualization-AI intelligence cycle be the answer to the $300bn healthcare fraud problem? Anti-fraud teams rely on AI and machine learning to uncover scams, but #GraphVisualization and #Timelines are vital too. hubs.li/Q02kJ_v50

🚀 Exciting News! 'The Art of #GraphVisualization' webinar series is back! Join us TOMORROW, Feb 28 at 5pm CET for 'The ABCs of Graph Styling.' Don't miss out! Register here 👉 us02web.zoom.us/webinar/regist… #DataViz #Webinar #GraphStyling

AI-assisted data analysis is great, but not all of the complex metrics AI provides are important. Our users rely on #GraphVisualization to highlight the ones that are, and we do it in a way that instantly makes sense to analysts and investigators: hubs.li/Q02hR8qB0


Good design does not need explanation. It needs repetition without failure. #Yebox #tech #graphvisualization
Introducing yFiles Graphs for @streamlit🚀 The free component that brings superior #GraphVisualization right into your #Python Streamlit apps. Stop struggling with messy #diagrams. Build beautiful, interactive, data-driven #applications! 🔗 yworks.com/products/yfile…

@Nitrograph Just tried Nitrograph and… wow. Millions of nodes. Zero lag. This thing is a beast. 🧠⚡ community.nitrograph.com ref code: I76V5NFK #Nitrograph #GraphVisualization
🚀 @Nitrograph — high-speed, high-fidelity graph visualization. Handle millions of nodes with real-time rendering ⚡ Designed for developers, analysts, and data lovers. Fast. Scalable. Beautiful. community.nitrograph.com REF CODE: I76V5NFK #Nitrograph #GraphVisualization #DevTools
🚀 @Nitrograph — 초고속 그래프 시각화 도구! 복잡한 네트워크도 실시간으로 렌더링 ⚡ ✅ 대용량 데이터 처리 ✅ 직관적인 인터랙션 ✅ 개발자 친화적 API community.nitrograph.com ref code : I76V5NFK 지금, 시각화의 새로운 기준을 경험하세요. #Nitrograph #데이터시각화 #GraphVisualization
When you think you are the best you can still improve more. Check out our Hierarchical layout with even fewer crossings at bit.ly/4o3kDtL #DataExploration #DataAnalysis #GraphVisualization #GraphTechnology
[DEV PREVIEW] Support for #GQL on @Ultipa_Graph is almost ready for release on G.V()! Check out our quick preview below and stay tuned for the official release! #graphdatabase #graphvisualization
G.V() 3.38.90 is out, bringing official support for FalkorDB, quality of life improvements and a better graph style customization user experience. For a detailed breakdown of the features, check out our announcement at gdotv.com/blog/gdotv-rel… #graphvisualization #falkordb
👉 See our latest blog post about turning complex graph data into clear visual insights. Learn best practices, tool selection, and layout methods for visualizing connected data at any scale. #GraphLayout #GraphVisualization #DataStructures #graphdatab... bit.ly/3HYXU2p
blog.tomsawyer.com
Graph Data Structure Visualization | Tom Sawyer Software
Turn complex graph data into clear visual insights. Learn best practices, tool selection, and layout methods for visualizing connected data at any scale.
Our latest blog post is about large-scale graph visualization. Explore how to visualize massive graphs at scale—reduce complexity, boost interactivity, and reveal insights in cybersecurity, finance, and more! 🌎📈 #graphvisualization #tomsawyersoftwar... hubs.li/Q03zQmmV0
blog.tomsawyer.com
Large-Scale Graph Visualization | Tom Sawyer Software
Discover large-scale graph visualization techniques—reduce complexity, boost interactivity, and reveal insights in cybersecurity, finance, and more.
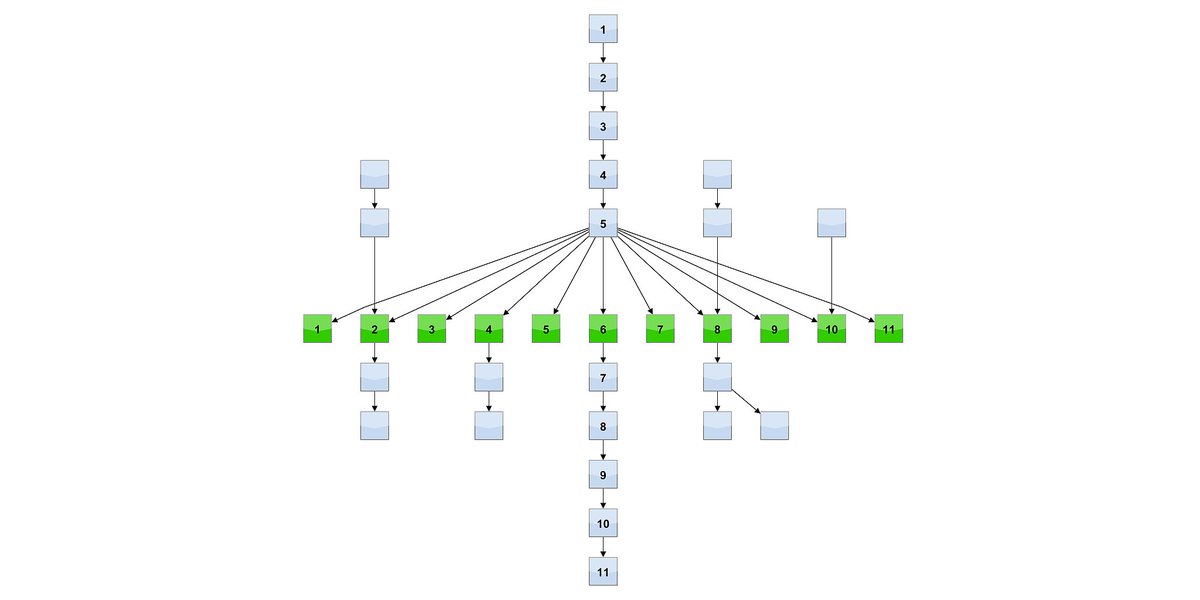
In Tom Sawyer Perspectives, hierarchical layout keeps nodes in order vertically. Use the Sequence layout constraint to maintain horizontal order. Learn more about Sequence and other constraints at bit.ly/44Tr3mX #graphvisualization #graphtechnology
Introducing Perspectives 13.3: New Kuzu database integration with Guest Speaker Semih Salihoğlu, CEO of Kuzu' is now available on YouTube. See it here: bit.ly/3U0iBgT #Kuzu #graphdatabases #graphvisualization #graphtechnology

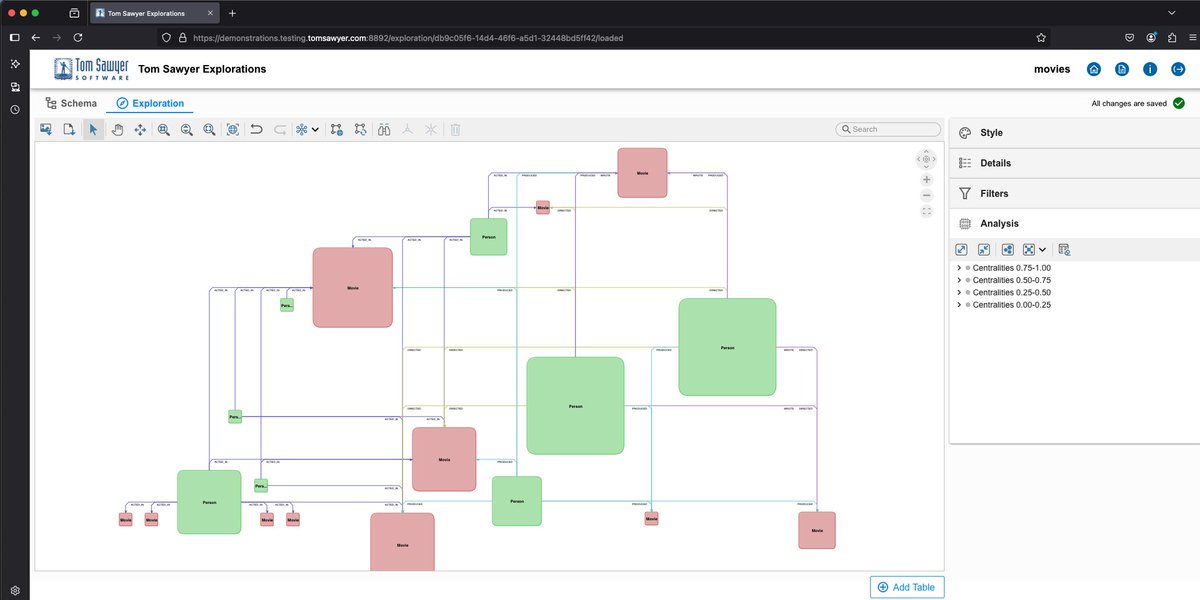
With Tom Sawyer Explorations you can connect, query, and run social network analysis in your data in under a minute! Learn more: bit.ly/44TAqo0 #graphdatabases #analysis #graphvisualization #graphtechnology
Let's explore the benefits of using #graphvisualization to analyze and understand local documents. Learn how this approach can improve #productivity, knowledge management, and decision-making. bit.ly/graph-viz #datavisualization #graphrag

🚀 What if you could see the connections in your local documents? bit.ly/graph-viz explains how graph visualization works and why it's a game-changer for productivity. #graphvisualization #dataviz #localdocs
#AdventOfCode 2024 - Day 8 Easy one today. Indexes, MERGEs #Cypher and #GraphVisualization with #Neo4j #Bloom puzzle: adventofcode.com/2024/day/8 solution: github.com/halftermeyer/A…
Enhance your Dgraph experience with G.V()'s interactive visualization features. Explore complex data relationships intuitively and share insights seamlessly. Learn how: hypermode.com/blog/G-V-bring… #DataExploration #Dgraph #GraphVisualization #GV
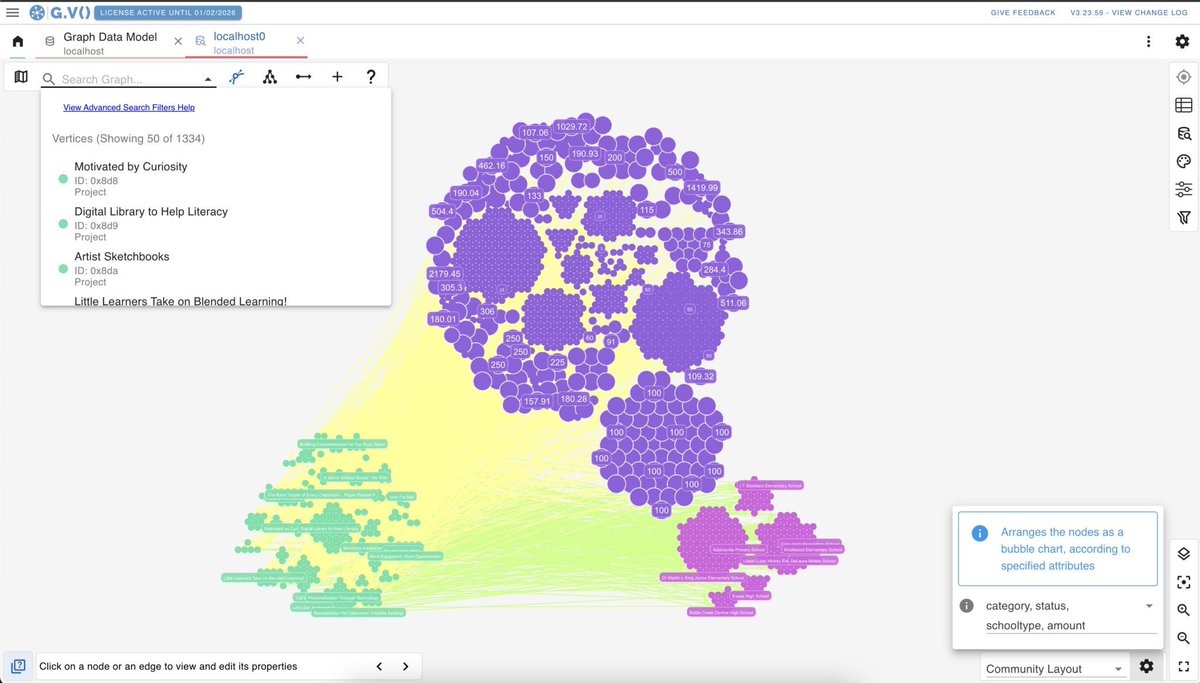
Exciting news! G.V() now supports Dgraph, bringing interactive graph visualization to your data exploration toolkit. Connect, query, and visualize your Dgraph data effortlessly. Discover more: hypermode.com/blog/G-V-bring… #GraphVisualization #Dgraph #GV
Don't miss out on the upcoming episode of our 'The Art of #GraphVisualization' #webinar series! Join us on Feb 28 at 5pm CET for 'The ABCs of Graph Styling' 😍 us02web.zoom.us/webinar/regist…
🚀 Exciting News! 'The Art of #GraphVisualization' webinar series is back! Join us TOMORROW, Feb 28 at 5pm CET for 'The ABCs of Graph Styling.' Don't miss out! Register here 👉 us02web.zoom.us/webinar/regist… #DataViz #Webinar #GraphStyling
Join our free #webinar on August 14th: "Interactive Graph Editing for Devs." Learn advanced #programming and #GraphVisualization techniques. Perfect for all levels! Register now: Register here: us02web.zoom.us/webinar/regist…

See our new Tom Sawyer Perspectives 13.2. We've spent the last two years improving our nested hierarchical layout. We've been able to reduce crossings by approximately 30% on average and sometimes the improvements are up to 50%. #graphvisualization #graphtechnology
Let's explore the benefits of using #graphvisualization to analyze and understand local documents. Learn how this approach can improve #productivity, knowledge management, and decision-making. bit.ly/graph-viz #datavisualization #graphrag
The latest post from our Head of Product, Dan Williams, explores the top six trends shaping the future of #LinkAnalysis, including: 💥 the data explosion ☁️ the chaos of cloud infrastructure 🤖 AI and machine learning hubs.li/Q02KbjV70 #GraphVisualization #DataVisualization

With Tom Sawyer Explorations you can connect, query, and run social network analysis in your data in under a minute! Learn more: bit.ly/44TAqo0 #graphdatabases #analysis #graphvisualization #graphtechnology
In Tom Sawyer Perspectives, hierarchical layout keeps nodes in order vertically. Use the Sequence layout constraint to maintain horizontal order. Learn more about Sequence and other constraints at bit.ly/44Tr3mX #graphvisualization #graphtechnology

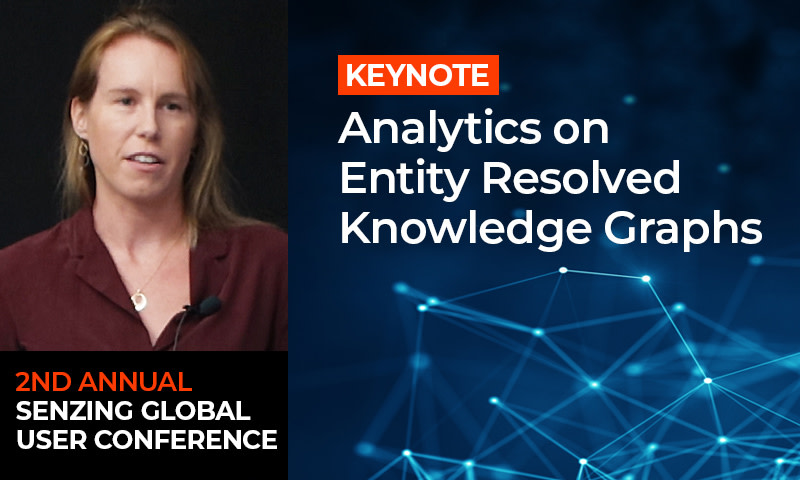
Are you using Entity Resolved #KnowledgeGraphs? The results are night and day when it comes to #GraphAnalytics, #GraphVisualization and more! Watch this fascinating talk by an industry expert. bit.ly/analytics-enti… #EntityResolvedKnowledgeGraph #EntityResolution
Curious about the structure of your #data? Use Perspectives to uncover connections, extract key details, and reveal metadata effortlessly. Insights are just a click away! bit.ly/449177H #dataops #graphvisualization #graphtechnology

Don't miss out on our webinar series 'The Art of Graph Visualization'! Explore how graphs power our everyday lives, from finance to tech, and learn how #GraphVisualization enables you to understand complex data and create intuitive visual representations. us02web.zoom.us/webinar/regist…?
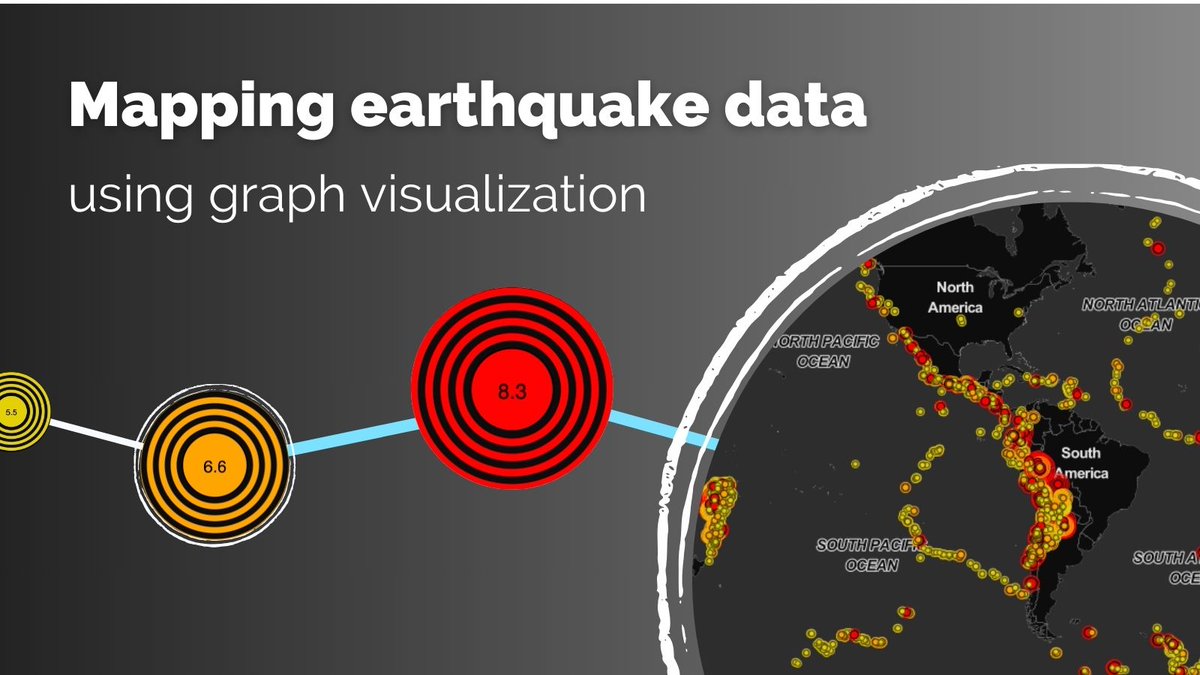
Analysts rely on our #DataVisualization SDKs to spot patterns and predict & prevent future events. But what about unpredictable events like natural disasters? Find out what insights a #Geospatial #GraphVisualization app uncovers from earthquake data: hubs.li/Q028hWMb0
Perspectives Feature: Hierarchical layout offers a choice between routing backward edges directly, or looping to better indicate the overall flow. Check out examples at bit.ly/43HVlZp #dataanalysis #graphvisualization #graphtechnology

Organize your graph database explorations into projects—store connection details, save results, and quickly pick up where you left off! bit.ly/4jAE5Mv #dataviz #analysis #graphvisualization #graphtechnology

Unravel complex crime networks with our cutting-edge graph views powered by analysis algorithms. See connections, patterns, and insights like never before. Learn more: bit.ly/4k5Q593 #dataops #analytics #graphvisualization #graphtechnology

Interested in exploring graph visualization techniques? Our updated guide covers it all: hubs.li/Q02r1vYb0 🛠️ Selecting tech 🤖 AI synergy 💾 Graph databases 🔍 Data modeling 🎨 UX 🗺️ Geospatial & time-based charting #GraphVisualization #DataInsights #DataVisualization

Turn Complex Data into Actionable Intel! Graph technology enables flexible, data-agnostic analysis—helping decision-makers connect the dots faster. Join our free webinar to see it in action: bit.ly/435uXIT #analytics #dataanalysis #graphvisualization #graphtechnology

Something went wrong.
Something went wrong.
United States Trends
- 1. Falcons 12.7K posts
- 2. Drake London 2,166 posts
- 3. Max B 12.2K posts
- 4. Raheem Morris N/A
- 5. Kyle Pitts 1,211 posts
- 6. Alec Pierce 2,039 posts
- 7. #Colts 2,559 posts
- 8. Penix 2,571 posts
- 9. Bijan 2,352 posts
- 10. $SENS $0.70 Senseonics CGM N/A
- 11. Badgley N/A
- 12. $LMT $450.50 Lockheed F-35 N/A
- 13. #ForTheShoe 1,434 posts
- 14. $APDN $0.20 Applied DNA N/A
- 15. Zac Robinson N/A
- 16. #DirtyBirds N/A
- 17. Good Sunday 76K posts
- 18. #AskFFT N/A
- 19. Jessie Bates N/A
- 20. #Talus_Labs N/A