#pandasgui wyniki wyszukiwania

#PandasGUI: Analyzing #Pandas dataframes with a #Graphical #User #Interface 🐼💻 👇🏽 towardsdatascience.com/pandasgui-anal… v/ @SourabhSKatoch #MachineLearning #ML #AI #100DaysOfCode #DEVCommunity #IoT #IIoT #IoTPL #Python #Serverless #womenintech #cybersecurity #RStats #CodeNewbie #DataScience


PandasGUI: Analyzing Pandas dataframes with a Graphical User Interface. towardsdatascience.com/pandasgui-anal… #MachineLearning #AI #100DaysOfCode #DEVCommunity #IoT #flutter #Python #javascript #Serverless #womenintech #cybersecurity #RStats #CodeNewbie #DataScience

Pandas GUI like tool for Web Applications for making charts from Python Data frame without coding stackoverflow.com/questions/6837… #pandas #pandasgui #python #webdeployment

#PandasGUI: Analyzing #Pandas dataframes with a #GUI 🐼 👉🏽towardsdatascience.com/pandasgui-anal… v/@SourabhSKatoch #DataScientists #STEM #AI #MachineLearning #ML #100DaysOfCode #DEVCommunity #IoT #IIoT #IoTPL #IoTCL #Python #womenintech #RStats #CodeNewbie #DataScience #WomenInSTEM #Developers

PandasGUI: Analyzing Pandas dataframes with a Graphical User Interface. towardsdatascience.com/pandasgui-anal… #MachineLearning #AI #100DaysOfCode #DEVCommunity #IoT #flutter #Python #javascript #Serverless #womenintech #cybersecurity #RStats #CodeNewbie #DataScience

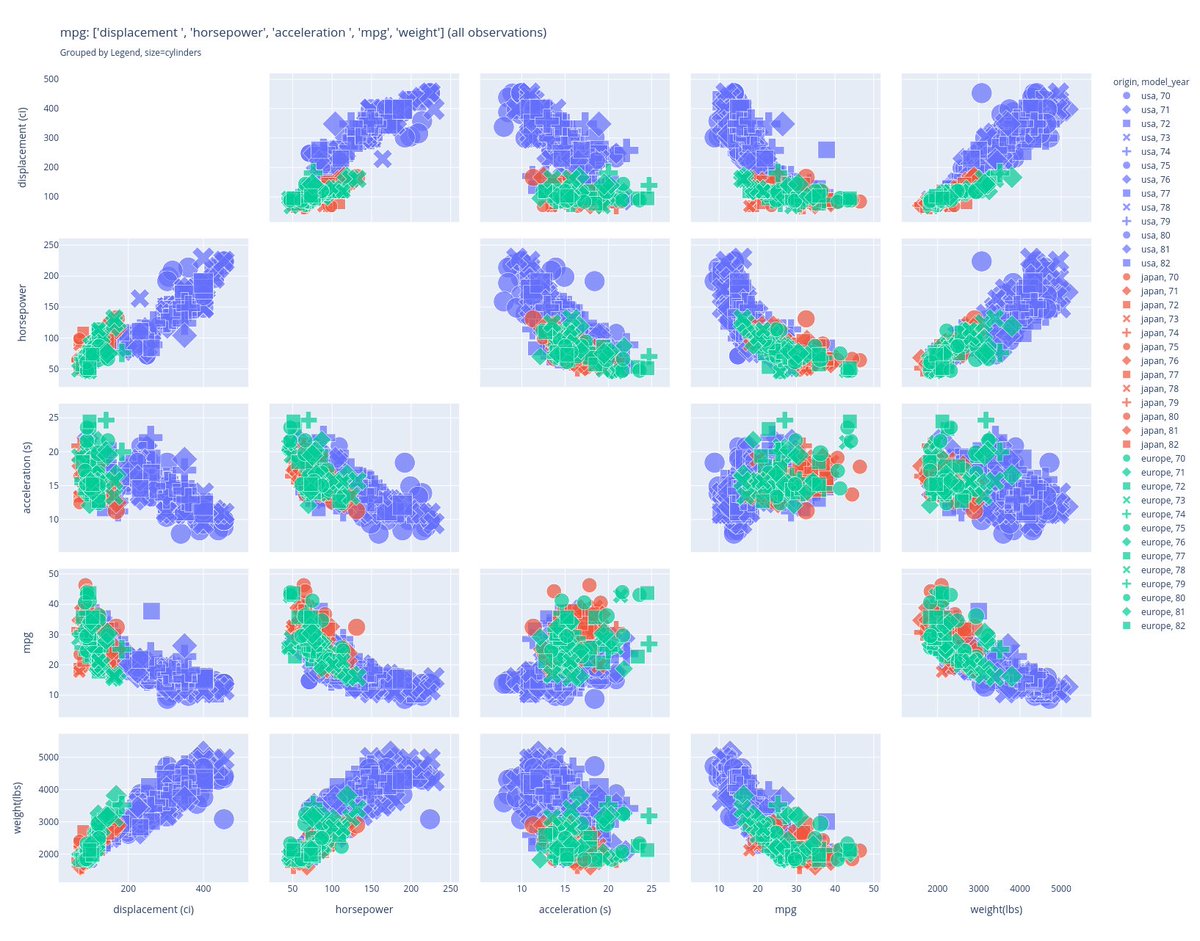
Another example of automated title on a fairly detailed plot, a scatter graph matrix. Title includes the dataframe name, the selected variables (without units, unlike the x and y axis), references the legend, the size that is not on the legend. Good news? PR merged in #pandasGUi

Parul Pandey shows how to extend your EDA with #PandasGUI, an amazing tool that works with pandas and your jupyter console. ow.ly/9n8x30rgFmk


Python PandasGUI(ノーコードEDA)でExcelっぽい感じでグラフィカルにEDA(探索的データ分析) #PythonPandasGUI #PandasGUI salesanalytics.co.jp/datascience/da…

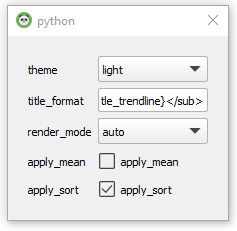
#pandasgui 0.2.10 lets you configure the title format for your charts directly from the GUI. It is a template string with the variables surrounded by curly braces. See the comment here for the definitions: github.com/adamerose/Pand…
For #DataScientists, have a look at #python #pandasgui, super useful. tessarinseve.pythonanywhere.com/nws/2022-06-26… #vlang #sqlite

Has anyone used #pandasgui yet? Some of the viz options look cool. Pandas is one of my favorite libraries for working with data. 🐼 #pandas #Python #DataScience analyticsvidhya.com/blog/2021/07/e…
analyticsvidhya.com
Everything You Need To Know About PandasGUI
PandasGUI is a Python-based library that facilitates data manipulation and summary statistics to be applied on the dataset using GUI.

✅Day 10 - Data preparation 101 - I learnt how to profile and clean data into a desired data set for use in the analytics process. I liked the way I could draw insights from #pandasGUI before proceeding to write any line of code.

#PandasGUI : Analyzing #Pandas dataframes with a Graphical User Interface Thx @TDataScience 👍 towardsdatascience.com/pandasgui-anal…


3 #Python Packages for Interactive #DataAnalysis - Explore data in a more interactive way #PandasGUI #DTale #Mito towardsdatascience.com/3-python-packa…


(g+) Ohne eine Zeile Code: Datenanalyse im Handumdrehen #PandasGUI glm.io/176657?s
Did more improvements on titles, and heard through the grapevine that a new pypi release is coming very soon! Stay tuned! #pandas #pandasgui #plotly #EDA #dataviz #python
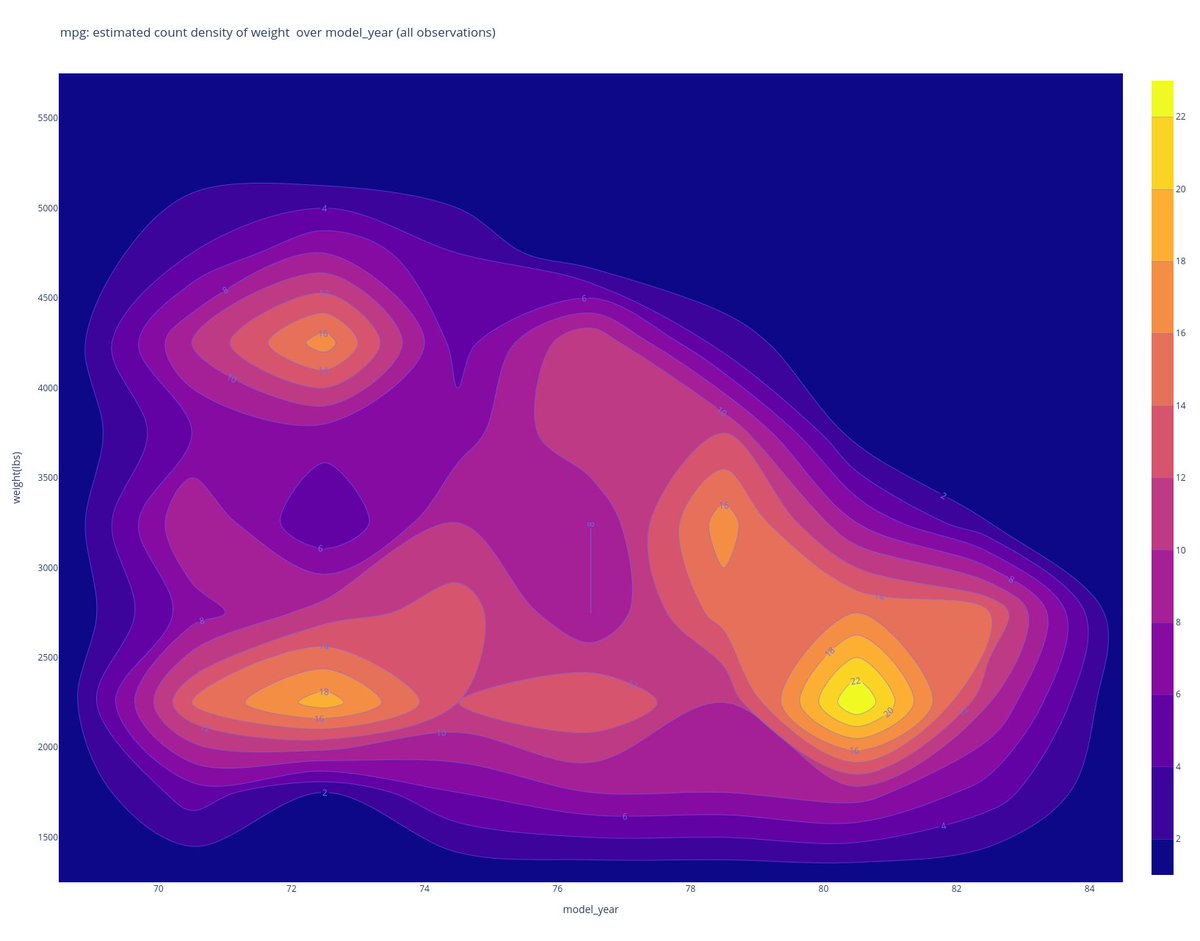
Mpg: estimated count density of weight over model year (all observations) ☝️the above was generated automatically based on the user selection of variables. Coming to PandasGui soon, I just sent a PR. #dataviz

Very nice new Python library for data science 👉 Revolutionizing Data Analysis with PandasGUI @kdnuggets #pandasgui #python #datascience #datavisualization bit.ly/3WUd6Rp


#PandasGUI: Analyzing Pandas dataframes with a Graphical User Interface 📊 #DataScience 🧮 #DataVisualization #DataAnalytics #DataFam towardsdatascience.com/pandasgui-anal…

RT Eli_Krumova RT @Eli_Krumova: #PandasGUI: Analyzing #Pandas dataframes with a #GUI 🐼 👉🏽towardsdatascience.com/pandasgui-anal… v/@SourabhSKatoch #DataScientists #STEM #AI #MachineLearning #ML #100DaysOfCode #DEVCommunity #IoT #IIoT #IoTPL #IoTCL #Python #womenint…

How to use PandasGUI for Exploratory Data Analysis and #DataScience In this video, I will be giving a quick walkthrough of how you can use #PandasGUI to quickly and graphically perform #exploratorydataanalysis in a few mouse click. youtu.be/F8mSlETrcl8 #pandas #python
(g+) Ohne eine Zeile Code: Datenanalyse im Handumdrehen #PandasGUI glm.io/176657?s
Very nice new Python library for data science 👉 Revolutionizing Data Analysis with PandasGUI @kdnuggets #pandasgui #python #datascience #datavisualization bit.ly/3WUd6Rp
Python PandasGUI(ノーコードEDA)でExcelっぽい感じでグラフィカルにEDA(探索的データ分析) #PythonPandasGUI #PandasGUI salesanalytics.co.jp/datascience/da…
✅Day 10 - Data preparation 101 - I learnt how to profile and clean data into a desired data set for use in the analytics process. I liked the way I could draw insights from #pandasGUI before proceeding to write any line of code.
#PandasGUI: Analyzing #Pandas dataframes with a #GUI 🐼 👉🏽towardsdatascience.com/pandasgui-anal… v/@SourabhSKatoch #DataScientists #STEM #AI #MachineLearning #ML #100DaysOfCode #DEVCommunity #IoT #IIoT #IoTPL #IoTCL #Python #womenintech #RStats #CodeNewbie #DataScience #WomenInSTEM #Developers
PandasGUI: Analyzing Pandas dataframes with a Graphical User Interface. towardsdatascience.com/pandasgui-anal… #MachineLearning #AI #100DaysOfCode #DEVCommunity #IoT #flutter #Python #javascript #Serverless #womenintech #cybersecurity #RStats #CodeNewbie #DataScience
For #DataScientists, have a look at #python #pandasgui, super useful. tessarinseve.pythonanywhere.com/nws/2022-06-26… #vlang #sqlite
3 #Python Packages for Interactive #DataAnalysis - Explore data in a more interactive way #PandasGUI #DTale #Mito towardsdatascience.com/3-python-packa…
Has anyone used #pandasgui yet? Some of the viz options look cool. Pandas is one of my favorite libraries for working with data. 🐼 #pandas #Python #DataScience analyticsvidhya.com/blog/2021/07/e…
analyticsvidhya.com
Everything You Need To Know About PandasGUI
PandasGUI is a Python-based library that facilitates data manipulation and summary statistics to be applied on the dataset using GUI.
Pandas GUI like tool for Web Applications for making charts from Python Data frame without coding stackoverflow.com/questions/6837… #pandas #pandasgui #python #webdeployment
#PandasGUI: Analyzing #Pandas dataframes with a #Graphical #User #Interface 🐼💻 👇🏽 towardsdatascience.com/pandasgui-anal… v/ @SourabhSKatoch #MachineLearning #ML #AI #100DaysOfCode #DEVCommunity #IoT #IIoT #IoTPL #Python #Serverless #womenintech #cybersecurity #RStats #CodeNewbie #DataScience
#PandasGUI: Analyzing #Pandas dataframes with a #Graphical #User #Interface 🐼💻 👇🏽 towardsdatascience.com/pandasgui-anal… v/ @SourabhSKatoch #MachineLearning #ML #AI #100DaysOfCode #DEVCommunity #IoT #IIoT #IoTPL #Python #Serverless #womenintech #cybersecurity #RStats #CodeNewbie #DataScience


#pandasgui 0.2.10 lets you configure the title format for your charts directly from the GUI. It is a template string with the variables surrounded by curly braces. See the comment here for the definitions: github.com/adamerose/Pand…
#PandasGUI: Analyzing #Pandas dataframes with a #Graphical #User #Interface 🐼💻 👇🏽 towardsdatascience.com/pandasgui-anal… v/ @SourabhSKatoch #MachineLearning #ML #AI #100DaysOfCode #DEVCommunity #IoT #IIoT #IoTPL #Python #Serverless #womenintech #cybersecurity #RStats #CodeNewbie #DataScience

#PandasGUI: Analyzing #Pandas dataframes with a #Graphical #User #Interface 🐼💻 👇🏽 towardsdatascience.com/pandasgui-anal… v/ @SourabhSKatoch #MachineLearning #ML #AI #100DaysOfCode #DEVCommunity #IoT #IIoT #IoTPL #Python #Serverless #womenintech #cybersecurity #RStats #CodeNewbie #DataScience
Did more improvements on titles, and heard through the grapevine that a new pypi release is coming very soon! Stay tuned! #pandas #pandasgui #plotly #EDA #dataviz #python
Mpg: estimated count density of weight over model year (all observations) ☝️the above was generated automatically based on the user selection of variables. Coming to PandasGui soon, I just sent a PR. #dataviz
#PandasGUI: Analyzing #Pandas dataframes with a #Graphical #User #Interface 🐼💻 👇🏽 towardsdatascience.com/pandasgui-anal… v/ @SourabhSKatoch #MachineLearning #ML #AI #100DaysOfCode #DEVCommunity #IoT #IIoT #IoTPL #Python #Serverless #womenintech #cybersecurity #RStats #CodeNewbie #DataScience
#PandasGUI: Analyzing #Pandas dataframes with a #Graphical #User #Interface 🐼💻 👇🏽 towardsdatascience.com/pandasgui-anal… v/ @SourabhSKatoch #MachineLearning #ML #AI #100DaysOfCode #DEVCommunity #IoT #IIoT #IoTPL #Python #Serverless #womenintech #cybersecurity #RStats #CodeNewbie #DataScience
Another example of automated title on a fairly detailed plot, a scatter graph matrix. Title includes the dataframe name, the selected variables (without units, unlike the x and y axis), references the legend, the size that is not on the legend. Good news? PR merged in #pandasGUi
#PandasGUI: Analyzing #Pandas dataframes with a #Graphical #User #Interface 🐼💻 👇🏽 towardsdatascience.com/pandasgui-anal… v/ @SourabhSKatoch #MachineLearning #ML #AI #100DaysOfCode #DEVCommunity #IoT #IIoT #IoTPL #Python #Serverless #womenintech #cybersecurity #RStats #CodeNewbie #DataScience

PandasGUI: Analyzing Pandas dataframes with a Graphical User Interface. towardsdatascience.com/pandasgui-anal… #MachineLearning #AI #100DaysOfCode #DEVCommunity #IoT #flutter #Python #javascript #Serverless #womenintech #cybersecurity #RStats #CodeNewbie #DataScience
#PandasGUI: Analyzing #Pandas Dataframes with a #GUI 👉🏽towardsdatascience.com/pandasgui-anal… v/ @SourabhSKatoch #MachineLearning #ML #AI #100DaysOfCode #DEVCommunity #IoT #IIoT #IoTPL #Python #Serverless #Cloud #RPA #NLP #5G #cybersecurity #RStats #CodeNewbie #DataScience #programming #coding

PandasGUI: Analyzing Pandas dataframes with a Graphical User Interface. towardsdatascience.com/pandasgui-anal… #MachineLearning #AI #100DaysOfCode #DEVCommunity #IoT #flutter #Python #javascript #Serverless #womenintech #cybersecurity #RStats #CodeNewbie #DataScience
#PandasGUI: Analyzing #Pandas dataframes with a #Graphical #User #Interface 🐼💻 👇🏽 towardsdatascience.com/pandasgui-anal… v/ @SourabhSKatoch #MachineLearning #ML #AI #100DaysOfCode #DEVCommunity #IoT #IIoT #IoTPL #Python #Serverless #womenintech #cybersecurity #RStats #CodeNewbie #DataScience
PandasGUI: Analyzing Pandas dataframes with a Graphical User Interface. towardsdatascience.com/pandasgui-anal… #MachineLearning #AI #100DaysOfCode #DEVCommunity #IoT #flutter #Python #javascript #Serverless #womenintech #cybersecurity #RStats #CodeNewbie #DataScience
Pandas GUI like tool for Web Applications for making charts from Python Data frame without coding stackoverflow.com/questions/6837… #pandas #pandasgui #python #webdeployment
#PandasGUI: Analyzing #Pandas dataframes with a #Graphical #User #Interface 🐼💻 👇🏽 towardsdatascience.com/pandasgui-anal… v/ @SourabhSKatoch #MachineLearning #ML #AI #100DaysOfCode #DEVCommunity #IoT #IIoT #IoTPL #Python #Serverless #womenintech #cybersecurity #RStats #CodeNewbie #DataScience
PandasGUI: Analyzing Pandas dataframes with a Graphical User Interface. towardsdatascience.com/pandasgui-anal… #MachineLearning #AI #100DaysOfCode #DEVCommunity #IoT #flutter #Python #javascript #Serverless #womenintech #cybersecurity #RStats #CodeNewbie #DataScience
#PandasGUI: Analyzing #Pandas dataframes with a #GUI 🐼 👉🏽towardsdatascience.com/pandasgui-anal… v/@SourabhSKatoch #DataScientists #STEM #AI #MachineLearning #ML #100DaysOfCode #DEVCommunity #IoT #IIoT #IoTPL #IoTCL #Python #womenintech #RStats #CodeNewbie #DataScience #WomenInSTEM #Developers
PandasGUI: Analyzing Pandas dataframes with a Graphical User Interface. towardsdatascience.com/pandasgui-anal… #MachineLearning #AI #100DaysOfCode #DEVCommunity #IoT #flutter #Python #javascript #Serverless #womenintech #cybersecurity #RStats #CodeNewbie #DataScience
Parul Pandey shows how to extend your EDA with #PandasGUI, an amazing tool that works with pandas and your jupyter console. ow.ly/9n8x30rgFmk
Another example of automated title on a fairly detailed plot, a scatter graph matrix. Title includes the dataframe name, the selected variables (without units, unlike the x and y axis), references the legend, the size that is not on the legend. Good news? PR merged in #pandasGUi
#pandasgui 0.2.10 lets you configure the title format for your charts directly from the GUI. It is a template string with the variables surrounded by curly braces. See the comment here for the definitions: github.com/adamerose/Pand…
Something went wrong.
Something went wrong.
United States Trends
- 1. #WWERaw 15.8K posts
- 2. Logan Paul 1,860 posts
- 3. Koa Peat N/A
- 4. Cuomo 120K posts
- 5. Cowboys 31.2K posts
- 6. #OlandriaxCFDAAwards 7,482 posts
- 7. Monday Night Football 9,084 posts
- 8. Cardinals 16.2K posts
- 9. Caleb Wilson N/A
- 10. Walt Weiss 2,772 posts
- 11. Harvey Weinstein 8,693 posts
- 12. CM Punk 14.5K posts
- 13. #RawOnNetflix N/A
- 14. Teen Vogue 5,246 posts
- 15. Braves 11.8K posts
- 16. Sliwa 34K posts
- 17. Schwab 5,974 posts
- 18. Hamburger Helper 2,903 posts
- 19. Myles Turner 1,726 posts
- 20. Diane Ladd 6,726 posts