你可能會喜歡


A sequential framework for teaching how to write good research questions buff.ly/2J06BaO The biggest challenge for my graduate students is without a doubt formulating research questions. If you're an educator you can use my sequential framework to teach how to craft them

How to draw a ggplot2 plot with two different continuous color scales in the R programming language: statisticsglobe.com/draw-ggplot2-p… #RStats #Rpackage #tidyverse #DataVisualization #DataViz
statisticsglobe.com
Draw ggplot2 Plot with Two Different Continuous Color Scales in R
How to use two different color ranges in a continuous ggplot2 plot in R - R programming example code - Actionable R code in RStudio

We have an online R for Biologists course coming up on the 10th-12th July! Check out the course page for info and sign-up:genomics.ed.ac.uk/services/r-bio… #R #DataScience #DataVisualization #rstats #biology #Bioinformatics


How to create a heatmap in R datasciencetut.com/how-to-create-… #rstats #programming #statistics #DataScience #RStudio
Tutorial that compares the pros & cons of data.frame vs. data.table objects in the R programming language. The tutorial was created in collaboration with @AWolwer: statisticsglobe.com/data-table-vs-… #RStats #Data #R #database
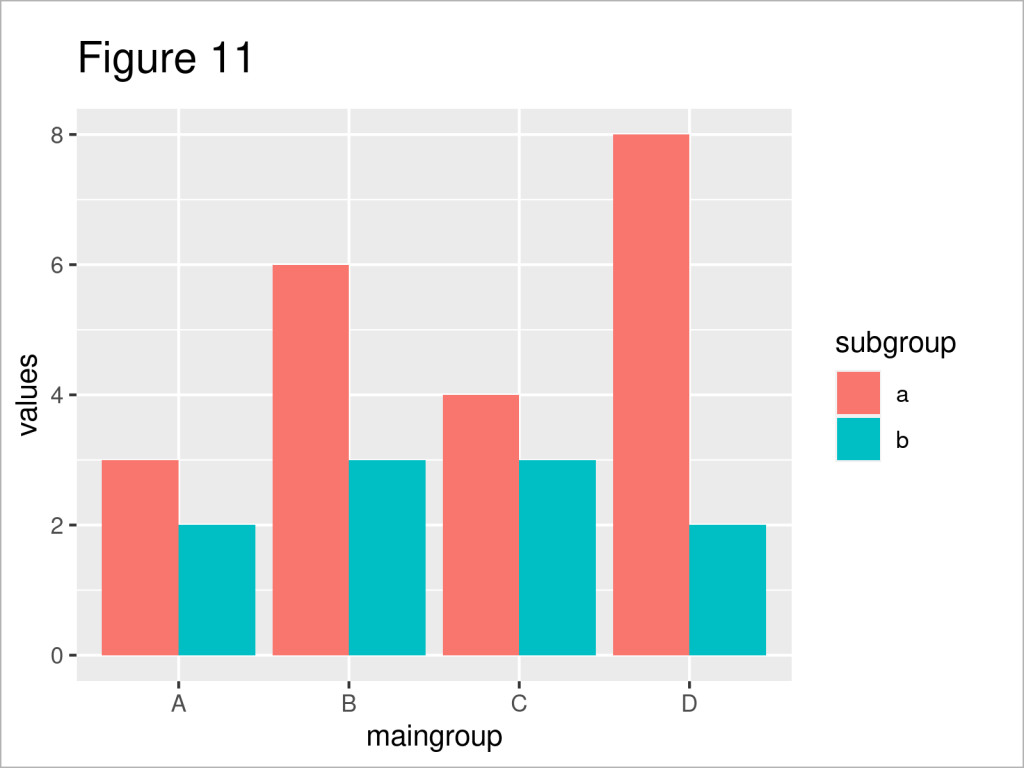
How to plot frequencies on top of a stacked barplot using the ggplot2 package of the R programming language: statisticsglobe.com/r-plot-frequen… #datascienceenthusiast #Rpackage #tidyverse #RStudio #DataVisualization #ggplot2 #programming #VisualAnalytics #RStats
Introduction on how to draw barplots using R programming language. The tutorial shows examples for Base R & the ggplot2 package: data-hacks.com/draw-barplot-r #Statistical #ggplot2 #tidyverse #datavis #RStats #Rpackage #DataVisualization #DataScientist

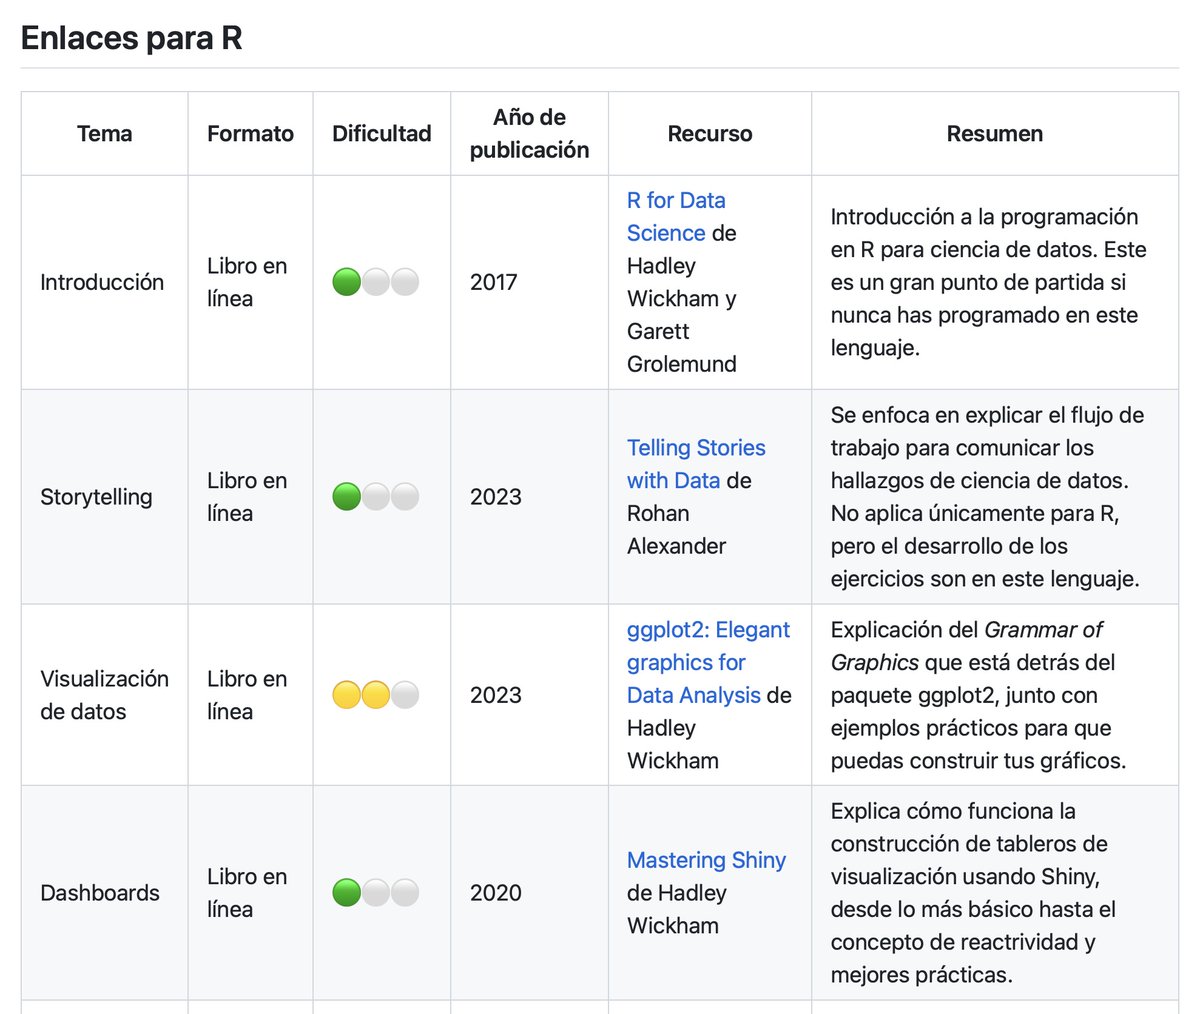
🤔¿Quieres arrancar a estudiar ciencia de datos? Acabo de montar un repositorio de Github en el que compilo mis recursos favoritos para aprender de este tema. El plan es irlo actualizando a medida que encuentre nuevas cosas. ¡Ojalá te sirva! github.com/camartinezbu/r…

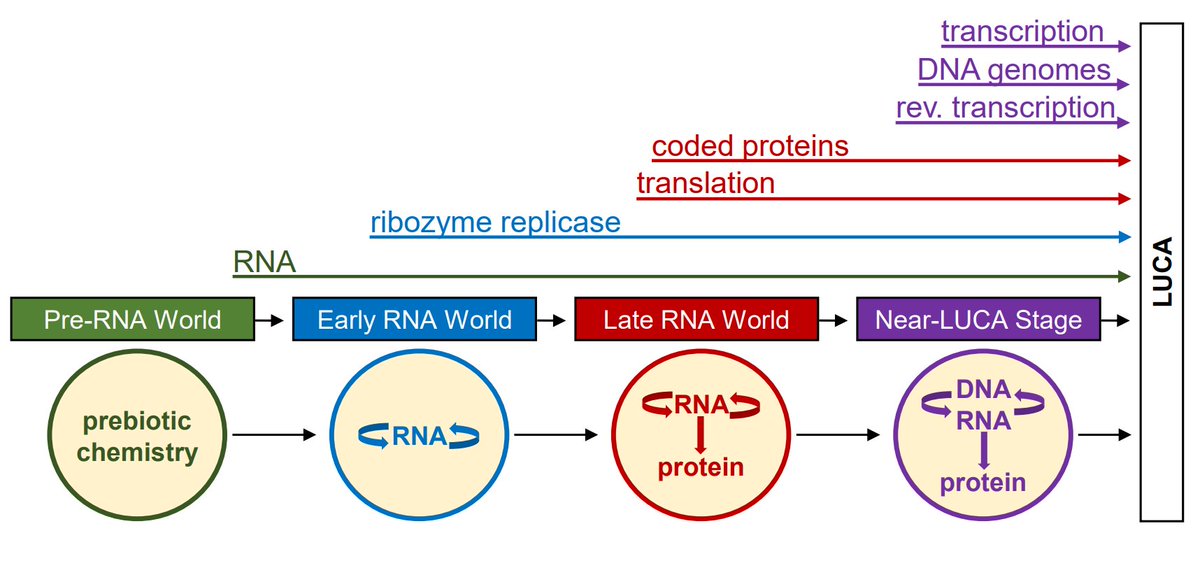
A synthesis of origin of life research demonstrates how inanimate matter evolved into the first cells, indicating that RNA arose before coded proteins and played a central role in life’s origins #OriginofLife #RNAWorld #Evolution bit.ly/3LTeDmV
How to compute z-scores in the R programming language: statisticsglobe.com/z-score-in-r #RStats #DataAnalytics #datasciencetraining
Want to learn R? Can't believe I missed this gem by @Jake_Lawlor1 et al in @PLOSCompBiol "Ten simple rules for teaching yourself R". doi.org/10.1371/journa… 🧵▶️ #RStats
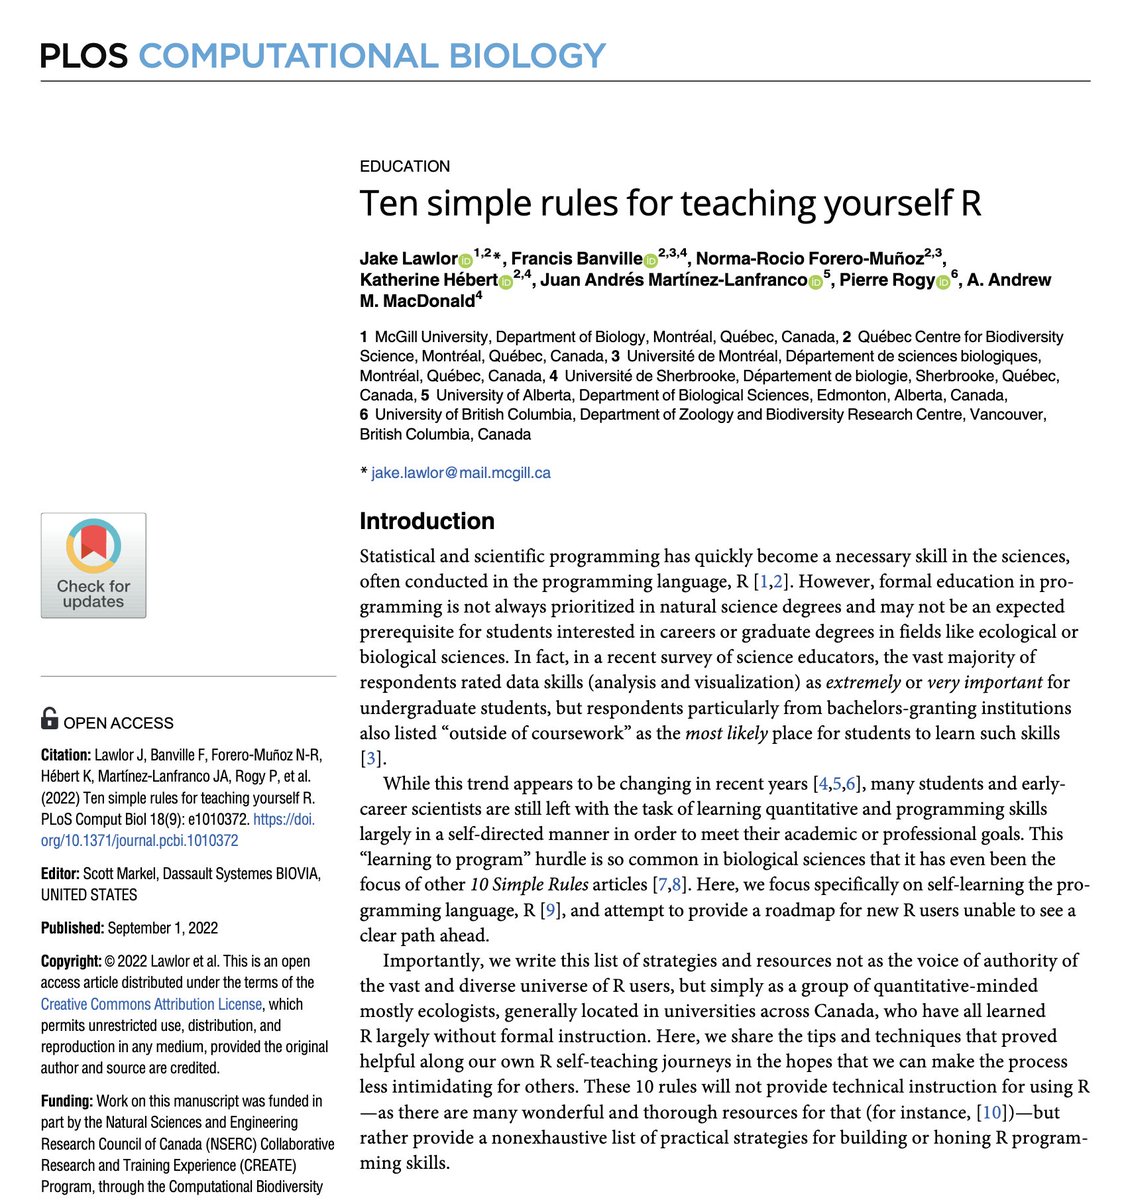
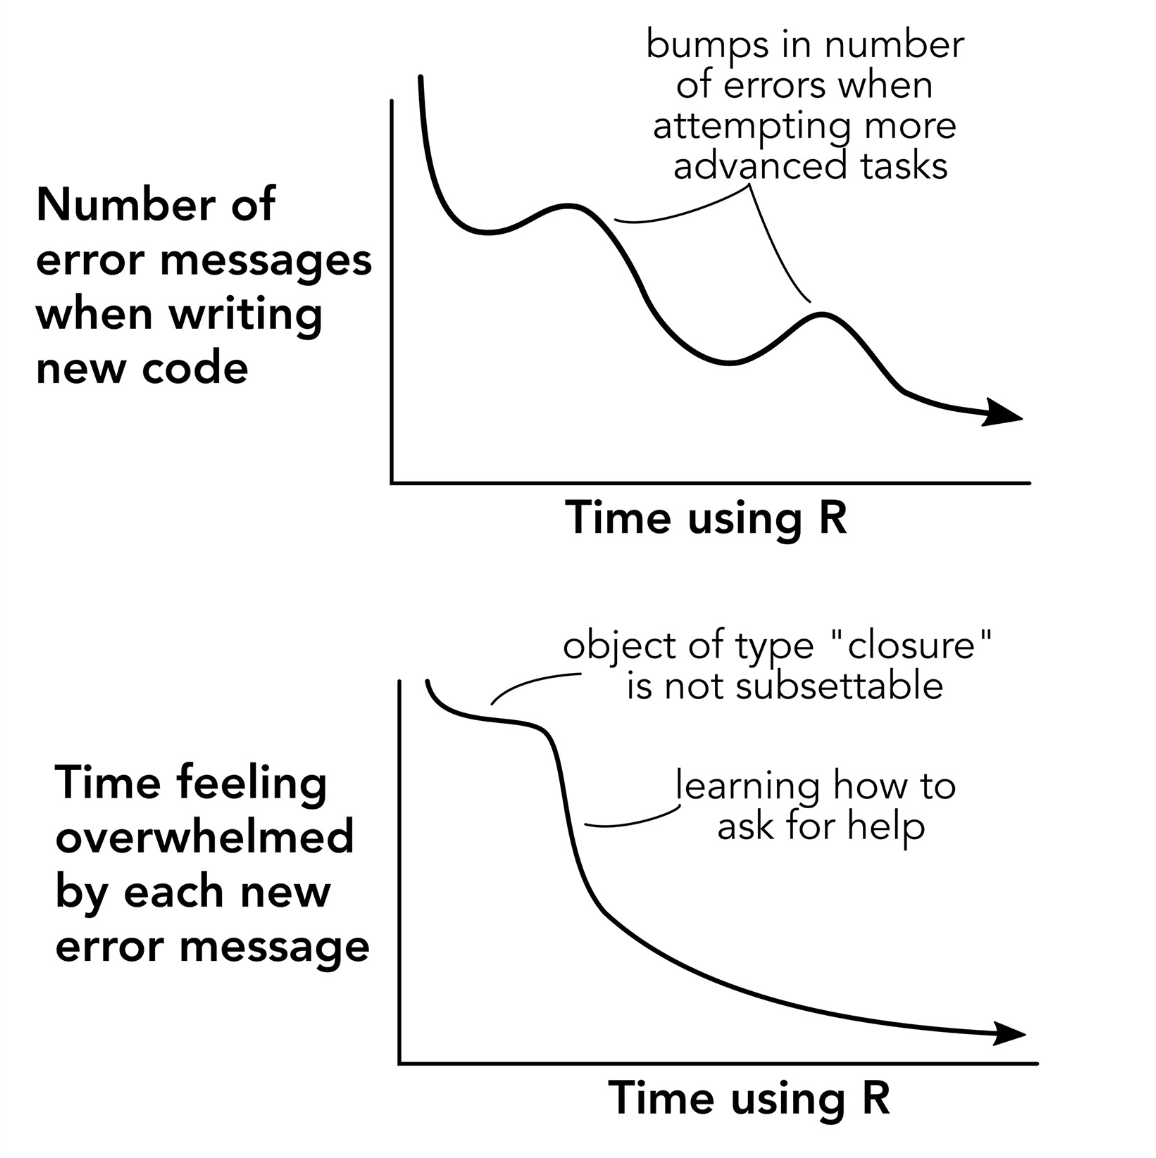

Do you want to learn #RStats, but aren't quite sure where to start? Myself and some great colleagues from @_bios2 wrote down our best tips for learning R on your own, out today in @PLOSCompBiol 🔓 ✨Ten Simple Rules for Teaching Yourself R✨ journals.plos.org/ploscompbiol/a… 🧵:

My thesis examiners passed my PhD thesis with ZERO corrections. One of their comments was that 'it was extremely well written'. How? I used to read a lot of papers and take note of their writing style. Now, hundreds of commonly-used phrases can be found in this phrasebook:

NORMSEQ: a tool for evaluation, selection and visualization of RNA-Seq normalization methods #bioinformatics #transcriptomics academic.oup.com/nar/advance-ar…
Hey, I've created an extensive introduction to the R programming language for beginners. The tutorial shows how to manipulate, visualize, and analyze different types of data: statisticsglobe.com/r-programming-… #RStats #DataAnalytics #DataScientist #RStudio

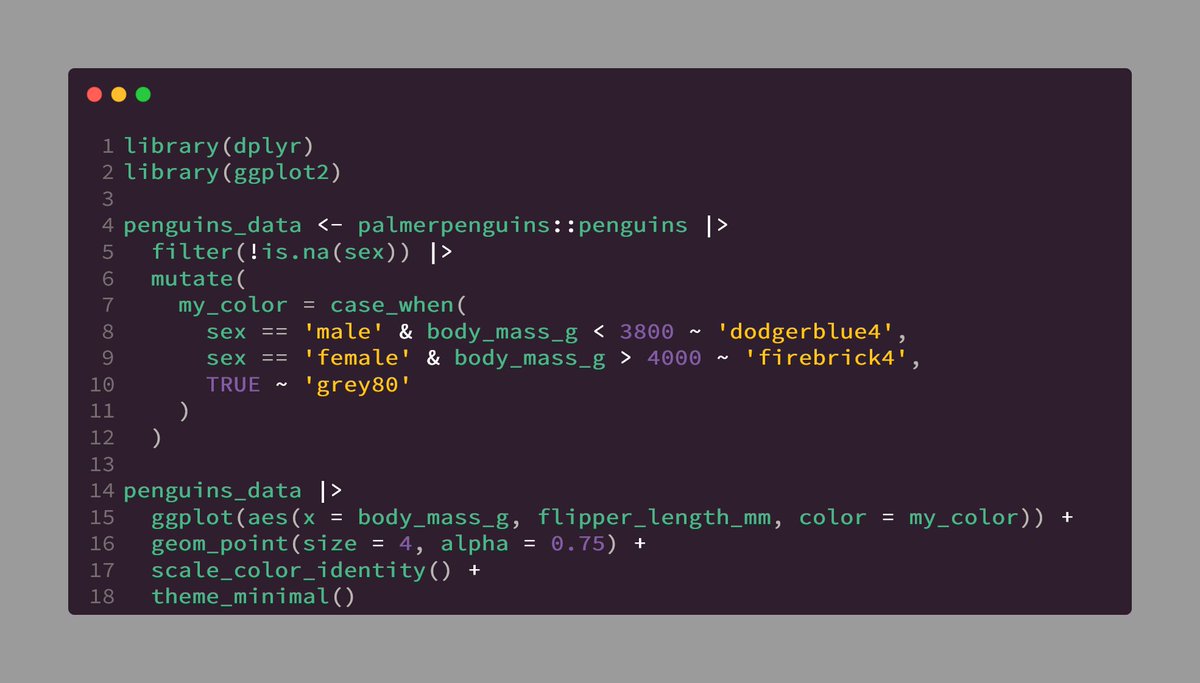
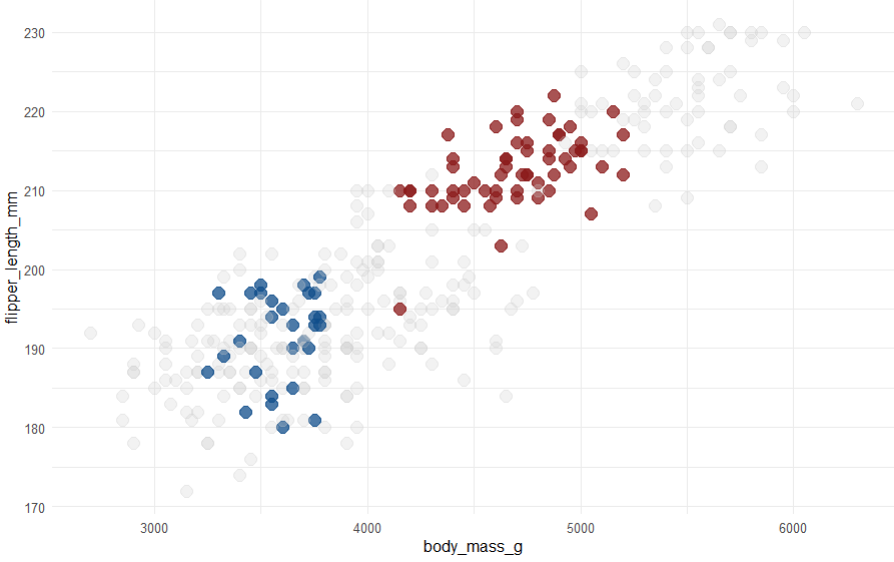
Here's a simple {ggplot2} + {dplyr} combo for using colors: 1️⃣ Create a new column with color names using case_when() 2️⃣ Use new column in aes() and add a scale_color_identity() layer. Great trick to draw your reader's attention to specific parts of your plot. #rstats


How to Transpose a Dataframe or Matrix in R with the t() Function marsja.se/how-to-transpo… #programming #r

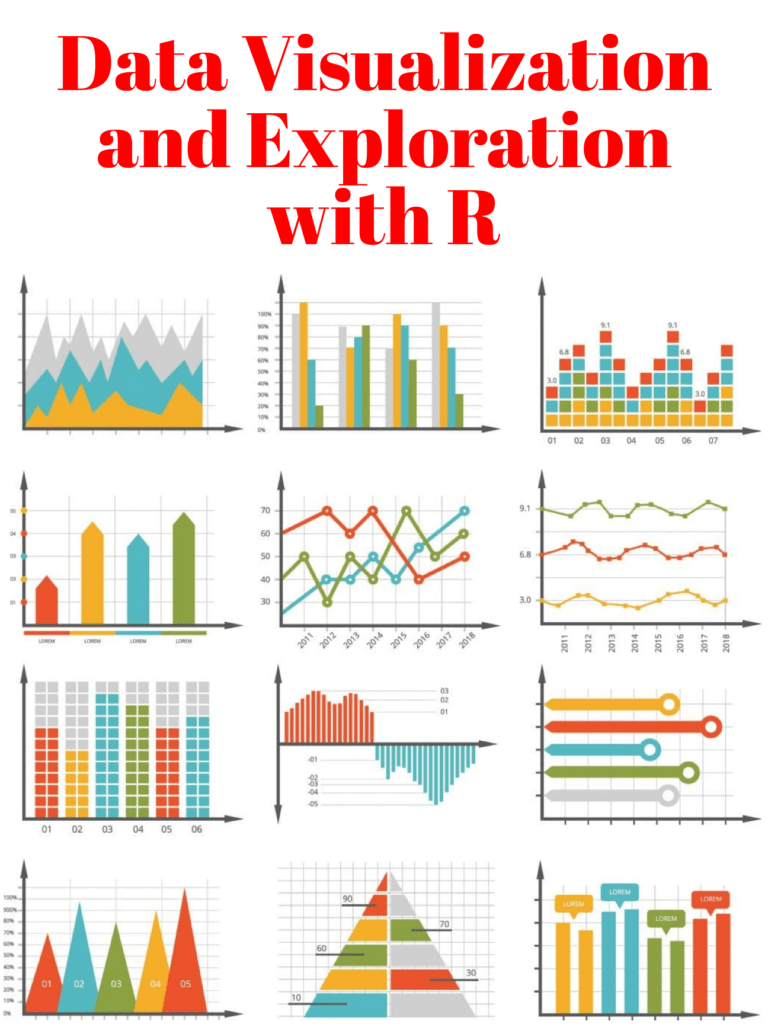
In this practical guide, we will explore the use of R, RStudio, and Tidyverse for data visualization and exploration. pyoflife.com/data-visualiza… #DataScience #RStats #Datavisualization #DataScientist #r #programming

DAAD Scholarship in Germany 2023-24 for International students (Fully Funded) Details: bit.ly/3SsZhqM Scholarship Coverage: ☆ Full tuition fees ☆ Monthly stipend ☆ Travel allowance ☆ Monthly rent subsidy ☆ Accommodation, accident and health insurance.

This book will give you superpowers: R for Data Science 2 Years ago, I started my #rstats journey with this book. And since then, I've used what this book taught me every single day. Absolutely best place to get started with R. And it's free. 🥳 r4ds.had.co.nz


United States 趨勢
- 1. Happy Thanksgiving 465K posts
- 2. Turkey Day 22K posts
- 3. #Thankful 5,805 posts
- 4. Afghan 433K posts
- 5. #Gratitude 5,704 posts
- 6. Feliz Día de Acción de Gracias 1,492 posts
- 7. #Grateful 3,203 posts
- 8. #StrangerThings5 372K posts
- 9. #CalleBatallaYVictoria 6,133 posts
- 10. Good Thursday 25.1K posts
- 11. DYTD TRAILER 251K posts
- 12. Taliban 54.9K posts
- 13. Gobble Gobble 17K posts
- 14. Tini 14.7K posts
- 15. God for His 19.6K posts
- 16. The CIA 161K posts
- 17. For the Lord 34K posts
- 18. God in Christ Jesus 5,687 posts
- 19. Mayorkas 62.8K posts
- 20. Asylum 152K posts


Something went wrong.
Something went wrong.