#datavisualizationtool resultados da pesquisa

How can data visualisation unlock the full potential of digital transformation? Discover how user-friendly design can make your digital transformation more intuitive, collaborative, and successful. Register for your free pass 👉 bit.ly/4mC7I0v


🔍 Type a domain. Uncover insights. The SEO Website Metric Analyzer by AIREV on Agent Forge helps you explore estimated traffic, ranking, and visibility trends for any website domain, empowering data-driven decision-making with AI-powered insights. 🔗 agents.aitech.io


أقوى قوالب إحترافية للـPower Bi نماذج مالية ومحاسبية وللموارد البشرية، كل الأنواع اللي تحتاجها بالرابط هذا تجد أفضل 10 قوالب موصّى بها : numerro.io/guides/top-10-…


I present to you. The single greatest Aave portal the world has ever seen. 113 charts across 9 dashboards... incredible.


A list of tools for prediction market analytics that will definitely be useful to you: A convenient dashboard for Polymarket analytics: defillama.com/protocol/dexs/… 42 charts for Myriad, Limitless, Polymarket, Kalshi: dune.com/dunedata/predi… 30 useful charts for Polymarket:…


Midway through October - some amazing @Deepvue updates 🚀 Theme Tracker Holdings Mini Chart Features Market Breadth / Report Widget New Data Panel / Bookmark UI 💨

![rDataIsBeautifu's tweet image. [OC] Nearly A Year Of Emotions Visualized redd.it/1o97n19](https://pbs.twimg.com/media/G3ermjeWcAAmBGn.png)

A very well done website that shows you the many options you have to visualize data: datavizproject.com


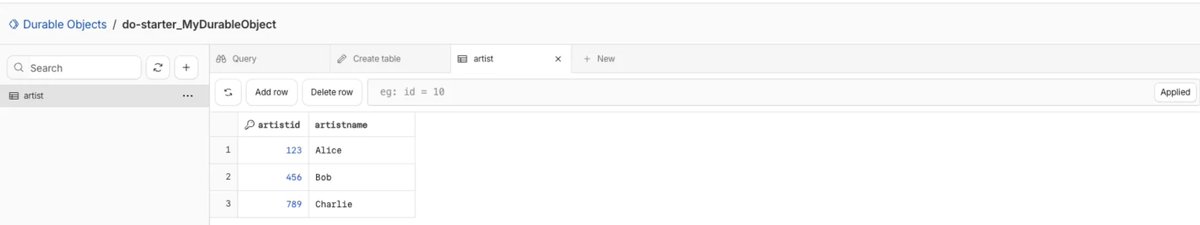
You can now view and edit your Durable Objects storage directly in the dashboard with Data Studio! No more deploying Workers just to query data. Data Studio works with SQLite-backed DOs—perfect for prototyping and debugging production storage. Details👇

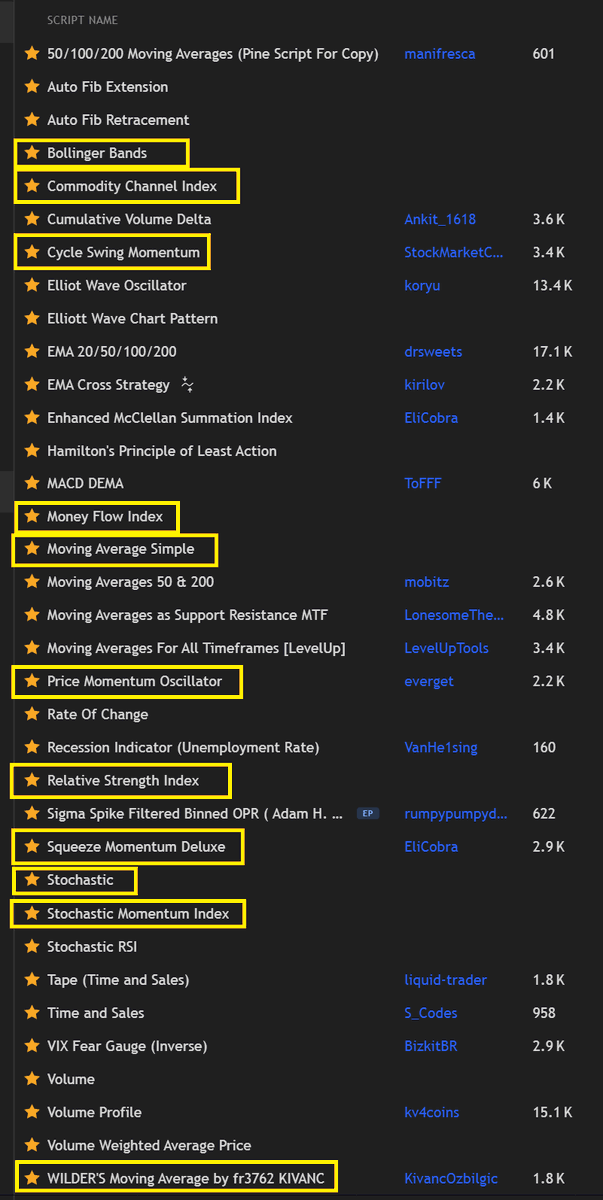
If you're curious which chart indicators I have on file for @tradingview and which ones I tend to use more often, here's the list: 👇 I've slightly modified each one, so yours may look different.

You can now direct Minara to create the specific chart types you need. Clarity at the start. Control at the finish. Optimize your queries instantly with Sample Prompts. Then, Preferred Charts ensure your research is visualized exactly how you need it. From initial query to…

Day 36 Datamind a web analytics platform that helps businesses track, visualize, and understand how visitors interact with their website in real time.


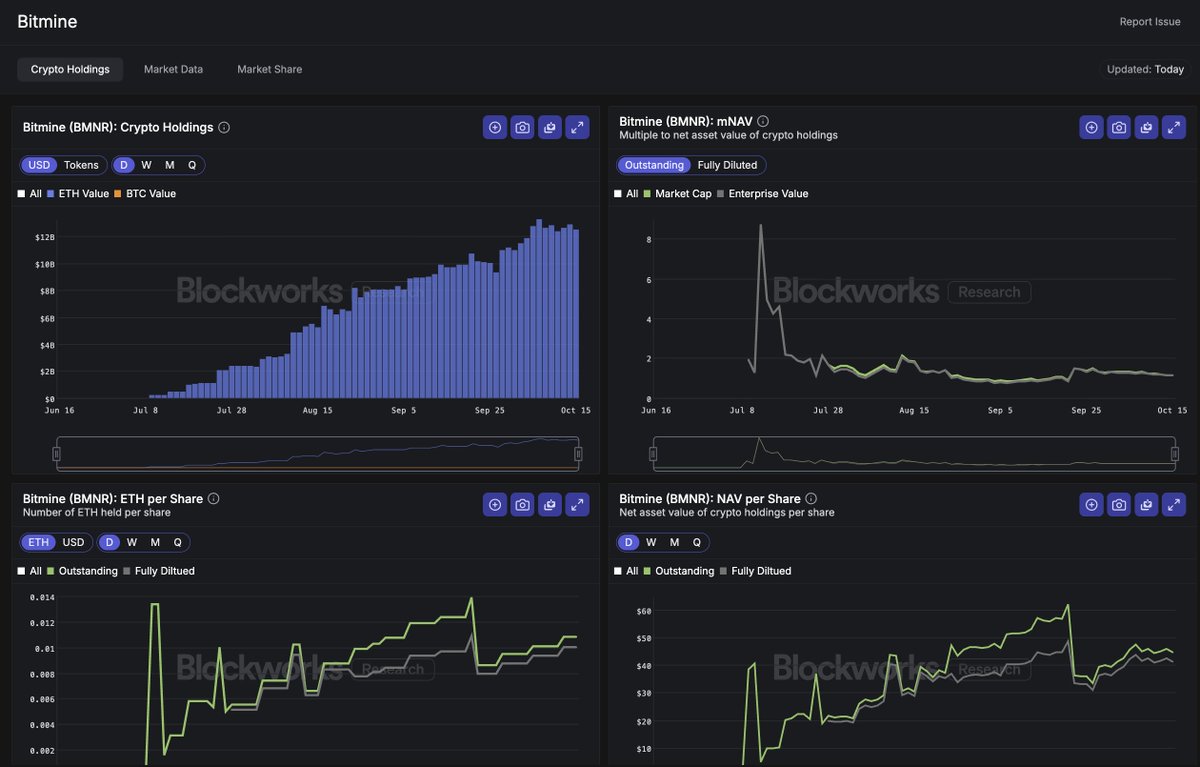
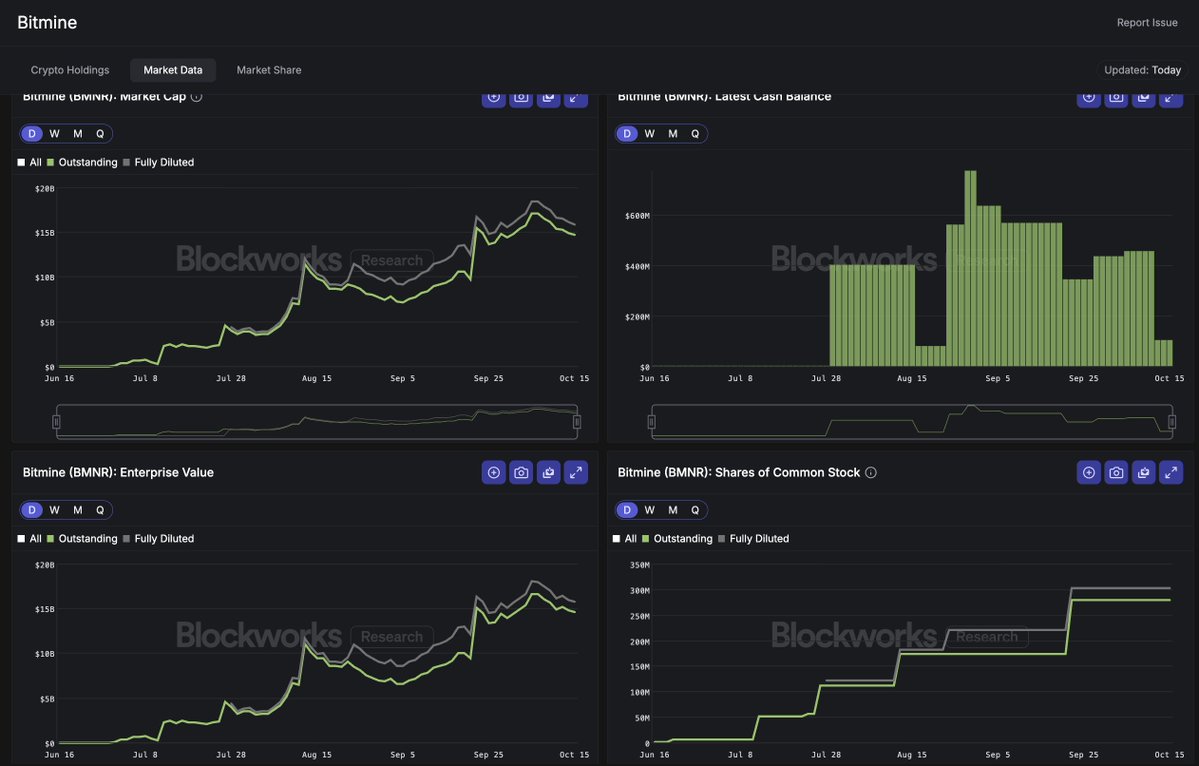
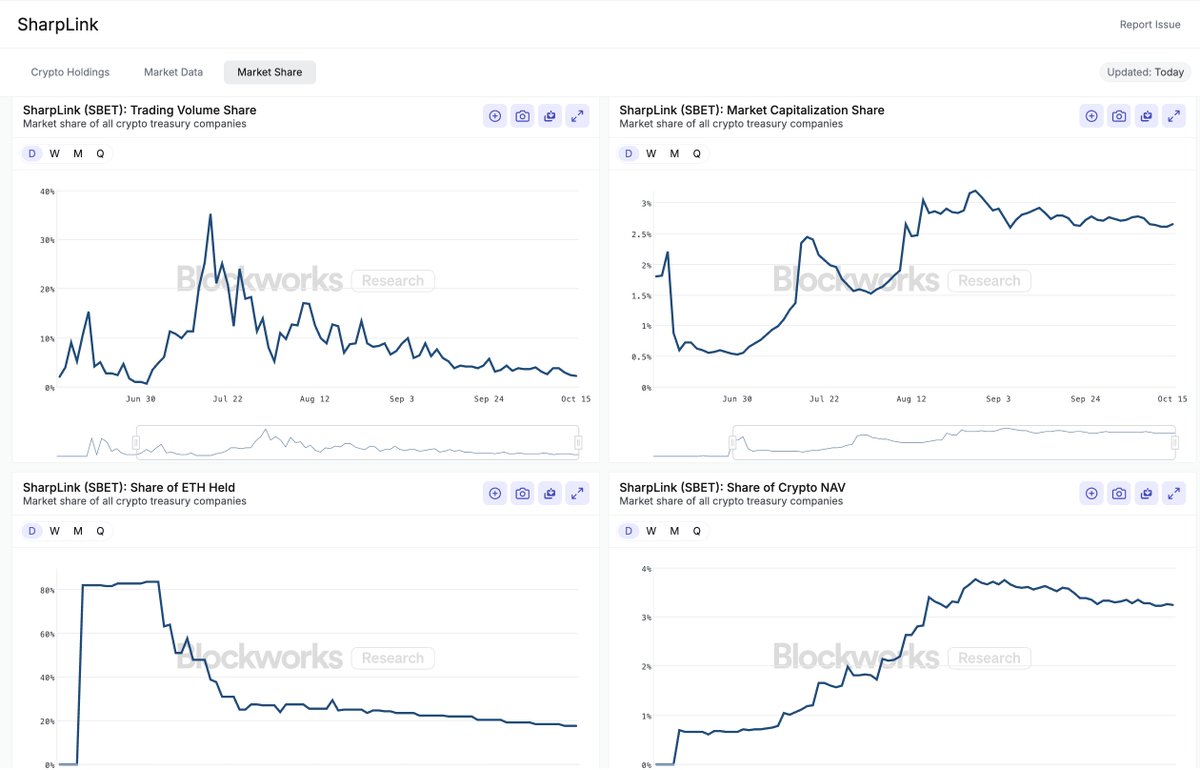
Continuing our push into DAT data, we now have dashboards for specific DATs. First two: BMNR and SBET More coming soon.


Shiloh’s NSights tool allows us to put together all of the pieces of your data so you can see the full picture. Learn more about our NSights visualization tool by scheduling a free demo: shilohnext.com/demo/ #NSights #DataSolutions #DataVisualizationTool #ShilohTechnologies


#DataVisualizationTool Market is projected to register a CAGR of 11% from 2024 to 2032 @Google @klipfolio @salesforce #Dashboardsoftware #Analyticsplatform #Chartingtools gminsights.com/industry-analy…

But guess what? You can join us too! Enrol in any of our open programs to be a part of this learning experience (Link in bio)! OR contact our support team on - 08131637601 #datavisualizationtool #Powerbi #freebootcamp #powerbibootcamp #dataanalysis #datavisualization

𝐖𝐡𝐲 𝐓𝐚𝐛𝐥𝐞𝐚𝐮 𝐢𝐬 𝐚 𝐜𝐫𝐮𝐜𝐢𝐚𝐥 𝐩𝐥𝐚𝐲𝐞𝐫 𝐢𝐧 𝐭𝐡𝐞 𝐰𝐨𝐫𝐥𝐝 𝐨𝐟 𝐛𝐮𝐬𝐢𝐧𝐞𝐬𝐬 𝐢𝐧𝐭𝐞𝐥𝐥𝐢𝐠𝐞𝐧𝐜𝐞? rb.gy/qvrwn #Tableau #BusinessIntelligence #DataVisualizationtool #DataAnalytics #DataVisualization #AI #AINews #AnalyticsInsight


🤔 Want to identify the right #datavisualizationtool for your data set? Here are some of the most impressive instances of data visualization 👉 bit.ly/3YrAx5a #Fusioncharts #datavisualization #developers #jscharts #FusionchartsSuite

Data visualization tools in finance help in serving clients with better efficiency and transparency. Watch our video to understand the role of data visualization in financial and wealth management: youtu.be/YVT_kVkjZ8g #Datavisualization #Datavisualizationtool #Excellarate

youtube.com
YouTube
The Importance of Data Visualization in FinTech

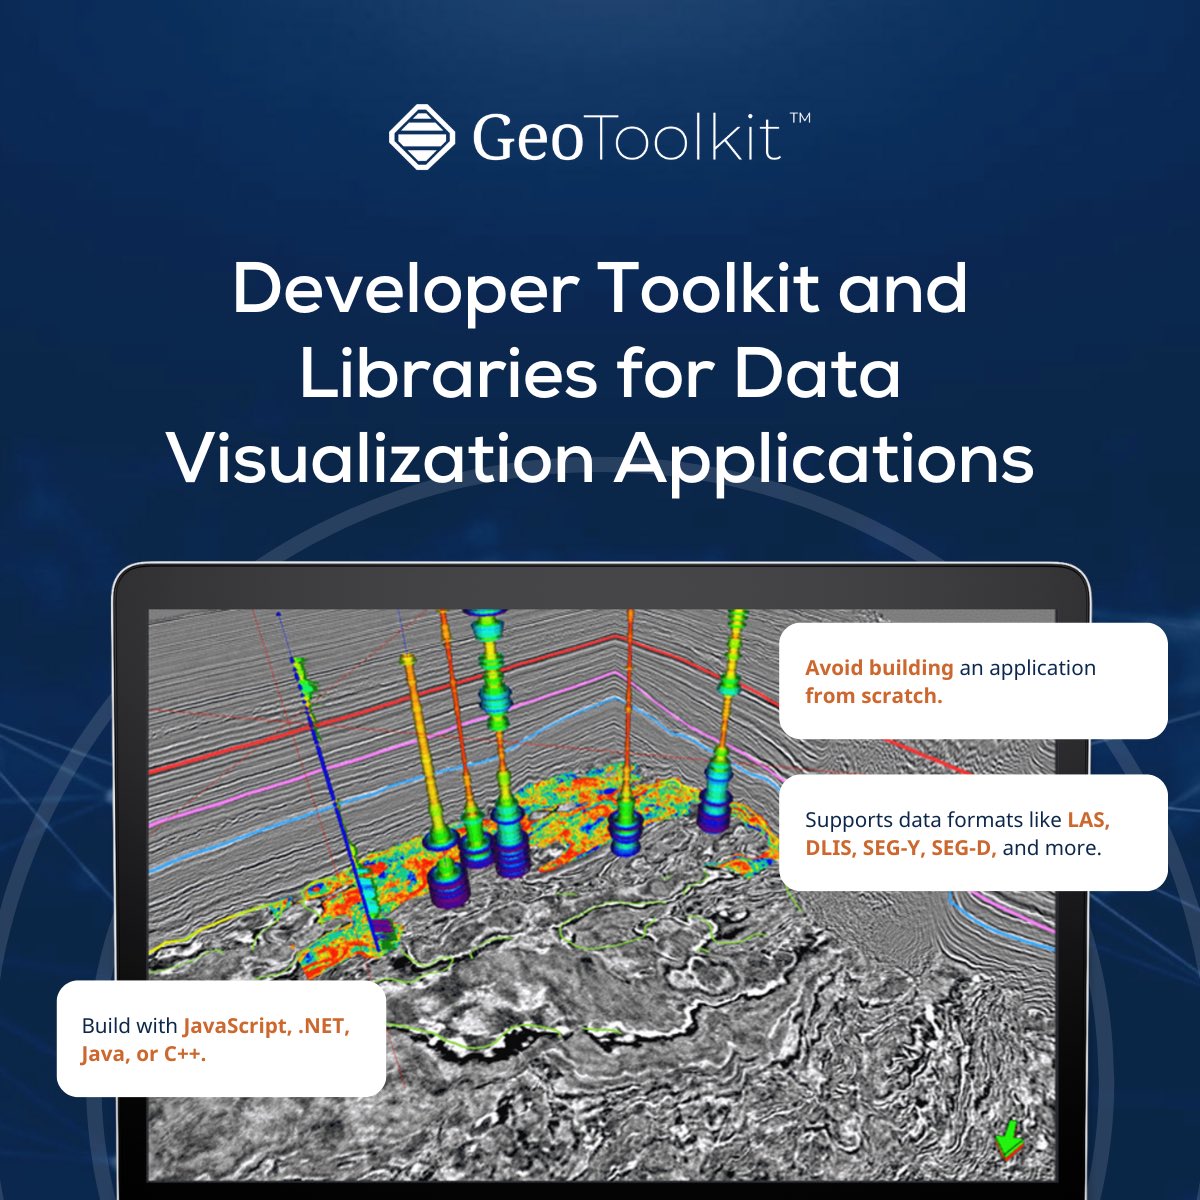
Whether looking for the easiest data visualization tools or simplifying customizations of widgets using well-documented APIs, you can save more than 120 hours per widget using GeoToolkit™. Try it for yourself: int.com/demo-gallery/ #DataVisualizationTool #CloudApplication #API

Top Data Analytics Tools #dataanalyticstools #datavisualizationtools #datavisualizationtool #dataanalytics #dataanalysistraining #learndataanalytics #businessintelligencetraining #datascience #datascientist #datasciencetraining #dataanalysis #dataanalytic #dataanalyticscourse

𝐖𝐡𝐲 𝐓𝐚𝐛𝐥𝐞𝐚𝐮 𝐢𝐬 𝐚 𝐜𝐫𝐮𝐜𝐢𝐚𝐥 𝐩𝐥𝐚𝐲𝐞𝐫 𝐢𝐧 𝐭𝐡𝐞 𝐰𝐨𝐫𝐥𝐝 𝐨𝐟 𝐛𝐮𝐬𝐢𝐧𝐞𝐬𝐬 𝐢𝐧𝐭𝐞𝐥𝐥𝐢𝐠𝐞𝐧𝐜𝐞? rb.gy/qvrwn #Tableau #BusinessIntelligence #DataVisualizationtool #DataAnalytics #DataVisualization #AI #AINews #AnalyticsInsight

Happy Friday! Here at @SynGlyphX, we're rolling out an exclusive offer for the first 250 members to sign up to our mailing list. (Spoiler Alert - it's almost a 90% discount!) Try us out today! #datavisualizationtool #softwaretool #dataviztool #datavisualization #visualization

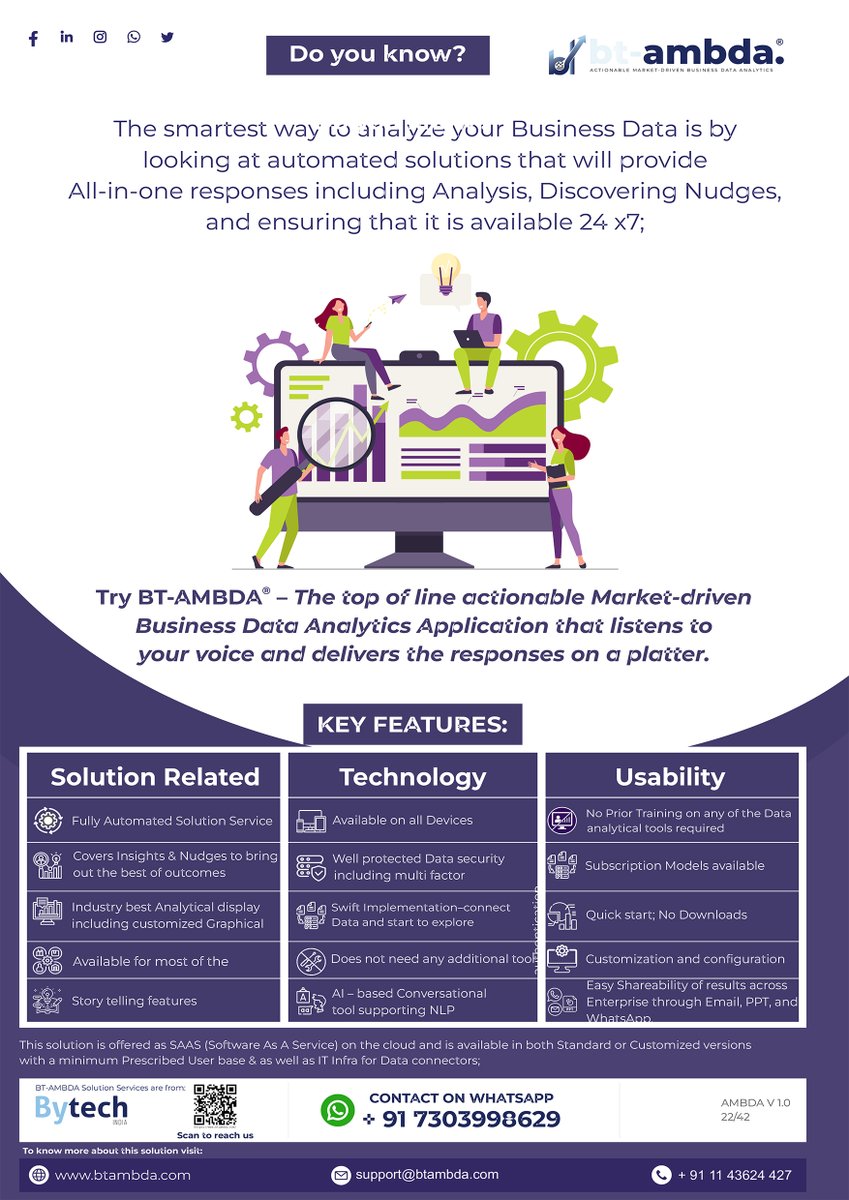
Bt-ambda Wishing you a blessed Karwa Chauth... May the sight of a full moon fill your heart with happiness. @bt_ambda @Bytechindia #btambda #bestanalyticstool #datavisualizationtool #discovery #analyze #dataanalysis #festival #karwachauth2022 #technology #datasecurity


Is business intelligence analyst a good career? Read more 👉 lttr.ai/pttu #BusinessIntelligenceAnalysts #BusinessIntelligenceAnalyst #DataVisualizationTool #VisualizeData #GoodCareer

The smartest way to analyze your Business is by looking at automated solution with Bt-ambda... @bytechindia @btambda #DataAnalytics #btambda #datavisualizationtool #dataanalyst #businesstool #nudges #solution #technology #usability #smarttool #analyze #data


Check out these open source #DataVisualizationTool helping you in understanding your complex #data. #Kibana #grafana #Datamonitoring #Datamanagement #techtrends #DataViz #BigData @meisshaily @BIScorecard @rtehrani @WorldTrendsInfo @mark_torr bit.ly/31IvQH5

Yes, it is really growing, but what do business intelligence analysts do? Read more 👉 lttr.ai/pY4H #BusinessIntelligenceAnalysts #BusinessIntelligenceAnalyst #DataVisualizationTool #VisualizeData #GoodCareer

Is Business Intelligence Analyst A Good Career? Read the full article: Is Business Intelligence Analyst A Good Career ▸ lttr.ai/o6Cy #BusinessIntelligenceAnalysts #BusinessIntelligenceAnalyst #DataVisualizationTool #VisualizeData #GoodCareer

Business Intelligence Analyst must have advanced skills in excel and should learn at least the fundamentals of sql. Read more 👉 lttr.ai/qhFy #BusinessIntelligenceAnalysts #BusinessIntelligenceAnalyst #DataVisualizationTool #VisualizeData #GoodCareer

Whether looking for the easiest data visualization tools or simplifying customizations of widgets using well-documented APIs, you can save more than 120 hours per widget using GeoToolkit™. Try it for yourself: int.com/demo-gallery/ #DataVisualizationTool #CloudApplication #API

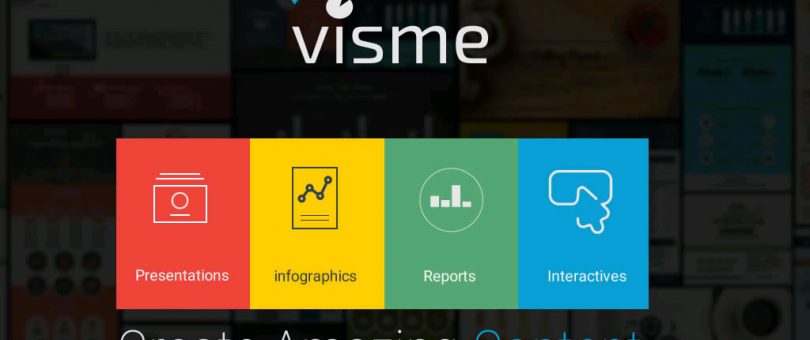
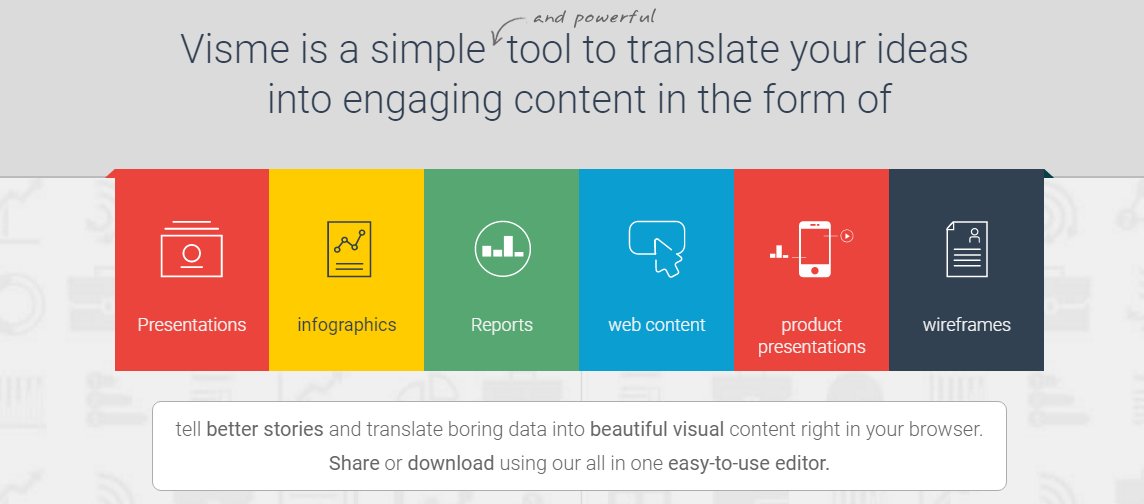
Why We Love @VismeApp at @wpdevrix - The WordPress Development Agency bit.ly/2pSKRSh #DataVisualizationTool
🤔 Want to identify the right #datavisualizationtool for your data set? Here are some of the most impressive instances of data visualization 👉 bit.ly/3YrAx5a #Fusioncharts #datavisualization #developers #jscharts #FusionchartsSuite
With our NSights visualization tool, you can easily see what products are doing well at your store and why with the simple click of a button! Schedule a FREE demo to learn just how easy our NSights tool is. shilohnext.com/demo/ #NSights #DataVisualizationTool


Tableau is one of the fastest evolving #BusinessIntelligence ( #BI ) and #datavisualizationtool. It is very fast to deploy, easy to #learn and very intuitive to use for a #customer . #whatsapp :+91 8681884318 #website : bit.ly/3xnaxtk Software ONLINE Training


WANT to learn best Visualization tool in the industry? #Tableautraining #datavisualizationtool #PREPconcept #ETLtool #TableauCourse Learn complete Tableau course in 45 days with #SterlingIT For more info visit this link sterlingittrainings.com contact no:+91 7799225639

Shiloh’s NSights tool allows us to put together all of the pieces of your data puzzle so you can see the full picture. Learn more about our NSights visualization tool by scheduling a free demo: shilohnext.com/demo/ #NSights #DataSolutions #DataVisualizationTool

Shiloh’s NSights tool allows us to put together all of the pieces of your data so you can see the full picture. Learn more about our NSights visualization tool by scheduling a free demo: shilohnext.com/demo/ #NSights #DataSolutions #DataVisualizationTool #ShilohTechnologies

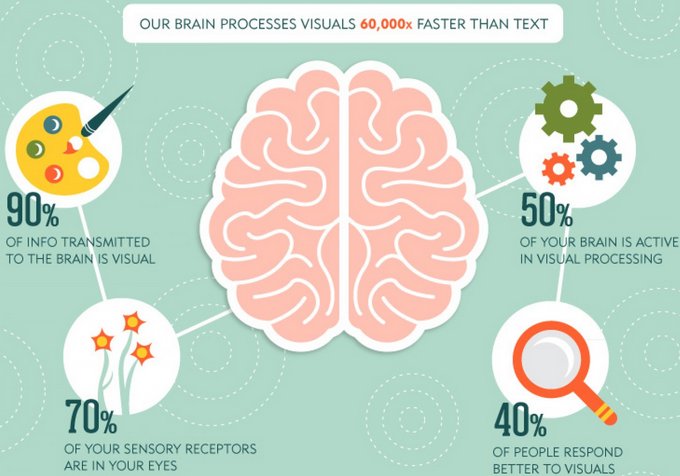
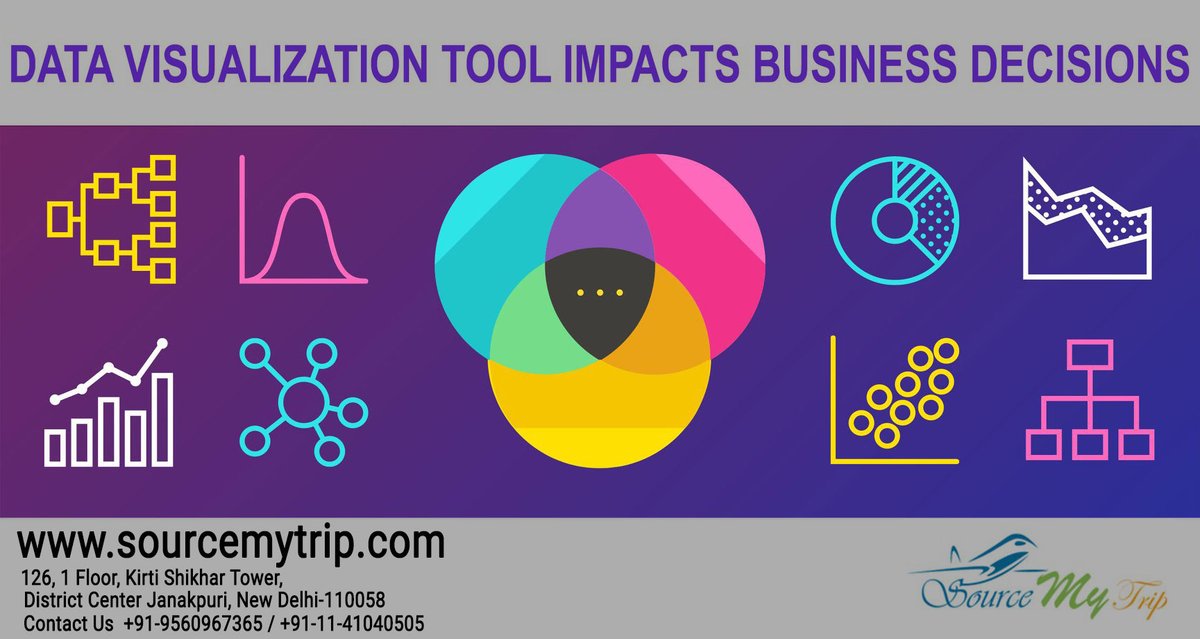
This is where data visualization provides a solution by using visual elements like graphs or tables to see and understand patterns, outliers, and trends in data. #datavisualizationtool #datavisualization #travelmarketing Follow us: @sourcemytrip Visit us: sourcemytrip.com
Something went wrong.
Something went wrong.
United States Trends
- 1. zendaya 6,757 posts
- 2. Apple TV 11.1K posts
- 3. No Kings 241K posts
- 4. trisha paytas 2,382 posts
- 5. #FursuitFriday 14.8K posts
- 6. #FridayVibes 8,559 posts
- 7. #FanCashDropPromotion 1,579 posts
- 8. Arc Raiders 5,667 posts
- 9. TPOT 20 SPOILERS 3,219 posts
- 10. Trevon Diggs 1,066 posts
- 11. GAME DAY 33.1K posts
- 12. #DoritosF1 N/A
- 13. Karoline Leavitt 48.1K posts
- 14. Andrea Bocelli 4,249 posts
- 15. #Yunho 30.1K posts
- 16. LINGORM ONLY YOU FINAL EP 2.06M posts
- 17. Mamdani 305K posts
- 18. Ramesh 4,683 posts
- 19. Don Lemon 22.7K posts
- 20. Glen Powell N/A