#rprogramming 検索結果

📌📘In the realm of biomedical and health applications, predictive analytics can be a lifesaver, guiding clinicians towards personalized treatments and preventive measures. pyoflife.com/data-science-a… #DataScience #rprogramming #rstats #DataScientist #statisticalanalysis

📌📚This step-by-step guide will explore the intricacies of analyzing complex survey data using the powerful R programming language. pyoflife.com/step-by-step-g… #DataScience #rprogramming #DataScientist #MachineLearning #RStats #Datavisualization #dataanalysis #statisticalanalysis

Growth rate of FBR(2001-10) & BRA(2016-23) in Sales tax services. @Noorbaloch72 @BRA_Quetta #Rprogramming


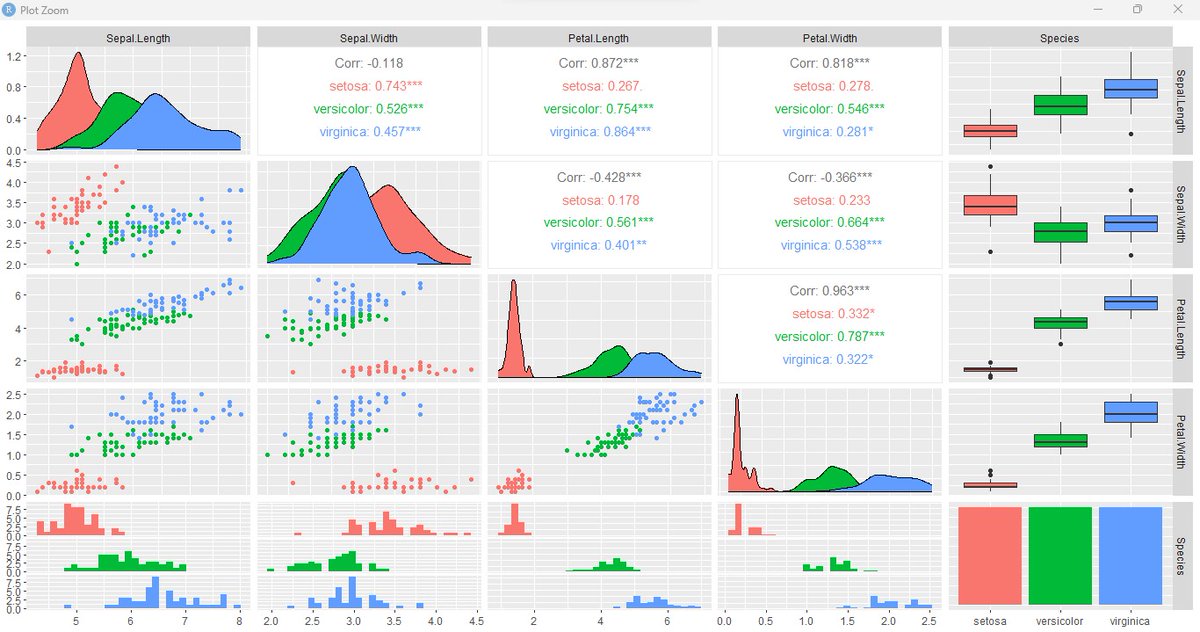
Still on R programming, while ggplot uses multiple lines of code, GGally produces a lot more information for a single line of code. library(GGally) ggpairs(iris, mapping=ggplot2::aes(colour = Species)) #Rprogramming #RStats #RStudio #DataScience #DataAnalytics

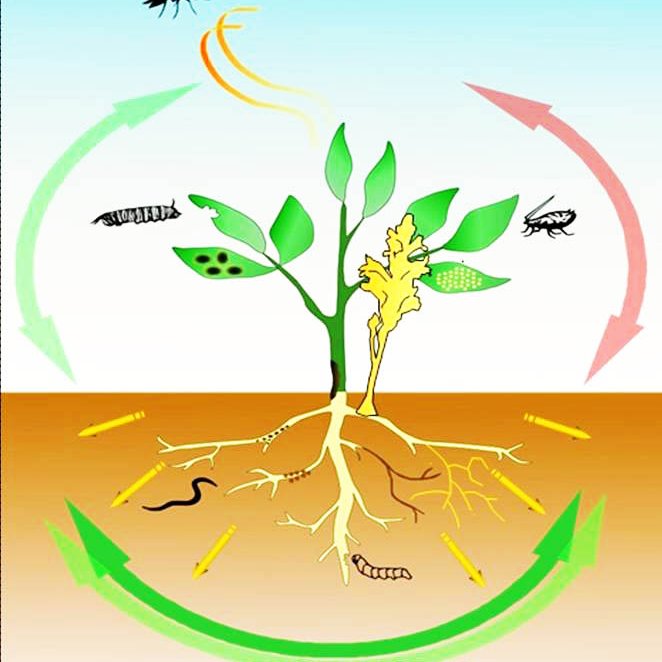
📊 Excited to have Bea as our guide into the world of analyzing biological data with statistics in R! 🧬🔬 #BiologicalData #Statistics #RProgramming"


Day 17: Flow #30daymapchallenge Sri Lanka rivers and streams another map made with my package ceylon #rstats #rprogramming


Our R for Biochemists 101 course is tailor-made for newcomers, guiding you to master R at your comfort speed. Enrol today for a knowledge boost starting 11 September! #RProgramming ow.ly/A51650PyrKQ

Linear regression is a widely used statistical modeling technique for predicting the relationship between a dependent variable and one or more independent variables. pyoflife.com/how-to-build-l… #DataScience #rprogramming #mathematics #DataScientists #MachineLearning #codinglife

I just made exciting graphs exploring the life expectancy of West African countries from 1960-2020! Check out the code on my Github to see how I used R to analyze the data and create the visualizations. github_url : github.com/sadatyussuf/R_… #dataanalysis #Rprogramming #Rstats


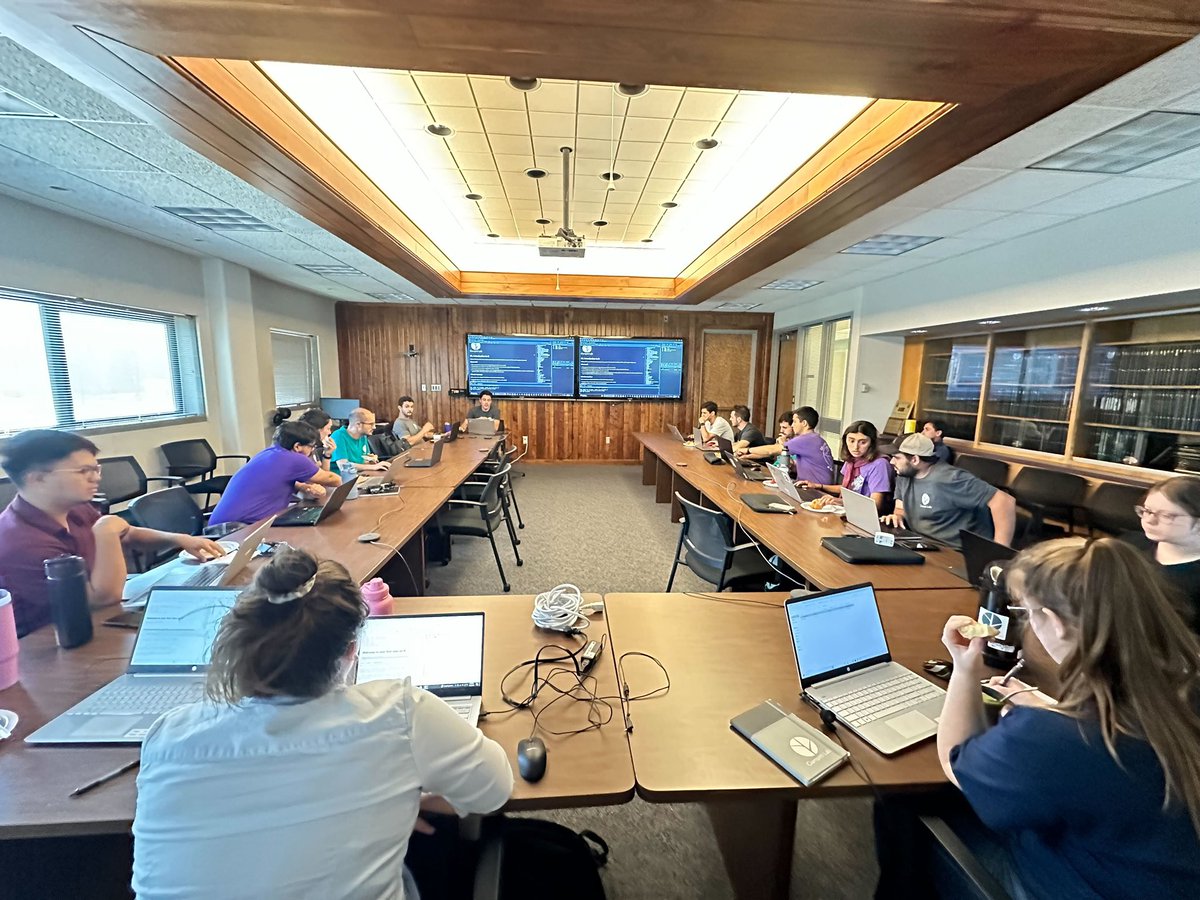
💻 Our team in action at the R workshop! 📊 Every year, our Ph.D. and MS students lead insightful lessons on R, sharing their knowledge with our visiting scholars. It’s always inspiring to see collaboration and learning in full swing! #DataScience #RProgramming #Collaboration


📌📘R provides a powerful set of tools for advanced analytics and graphics. In this textbook, we’ll discuss the features of R that make it suitable for advanced analytics and graphics. pyoflife.com/r-for-everyone… #DataScience #rprogramming #rstats #DataScientists #datavisualization


DDCS Dept. is hosting a Hybrid Training Program on Data Science with Python & R from 20–24 May 2025, 7:00 PM daily. Focus: Stats, visualization, real-world applications & industry skills. #DataScience #Python #RProgramming #DDCS #HybridTraining #CareerSkills


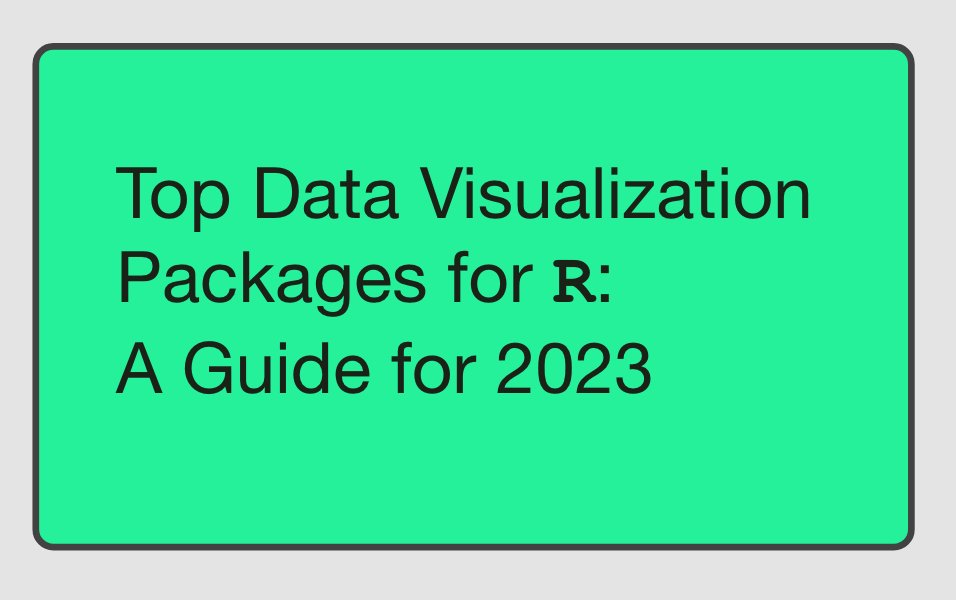
Exploring the best 2023 data visualization tools in R? 📊 Dive into our comprehensive guide: datanautes.com/en/top-data-vi… #rstats #DataViz #RProgramming

Join our Spatial Data Science (self-paced) online course—now partially sponsored at just R1500 per delegate! Learn cutting-edge techniques like regression, Kriging, and more. zurl.co/4UvO #SpatialDataScience #DataAnalytics #RProgramming #Geospatial #DataScience

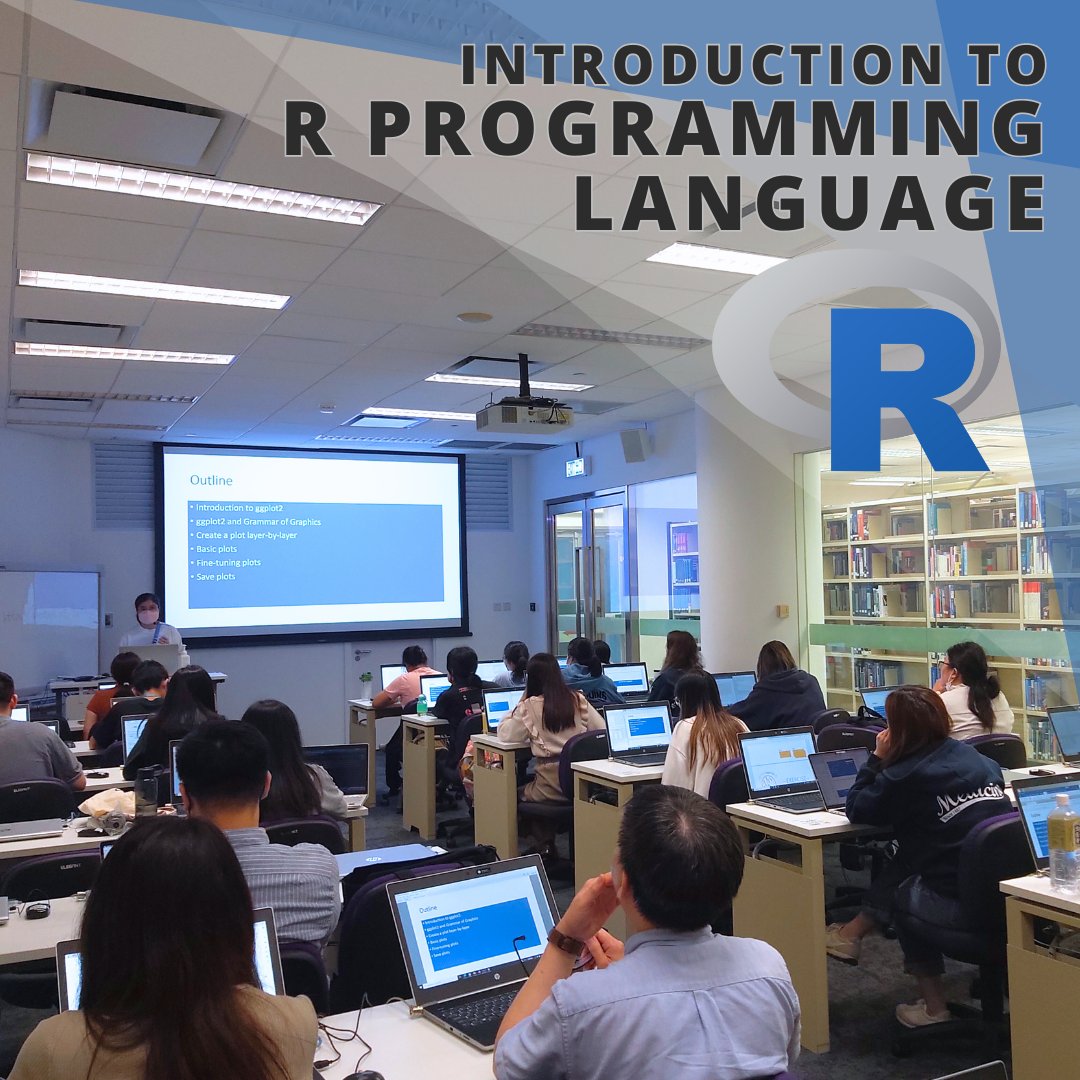
Our workshop on 26/4 introduced participants to basics of R and RStudio. With practical sessions focused on manipulating biological data tables, participants gained valuable hands-on experience. #Bioinformatics #RProgramming #RProgrammingLanguage #DataManipulation #BiologicalData
Day 2 of our R Programming Workshop featured sessions on Data Visualization, a Q&A segment, and certificate distribution. Dr. Ajay Kumar Koli was felicitated for his contribution. Vote of Thanks by Dr. Harchand Ram wrapped up the event. #RProgramming #DataAnalysis


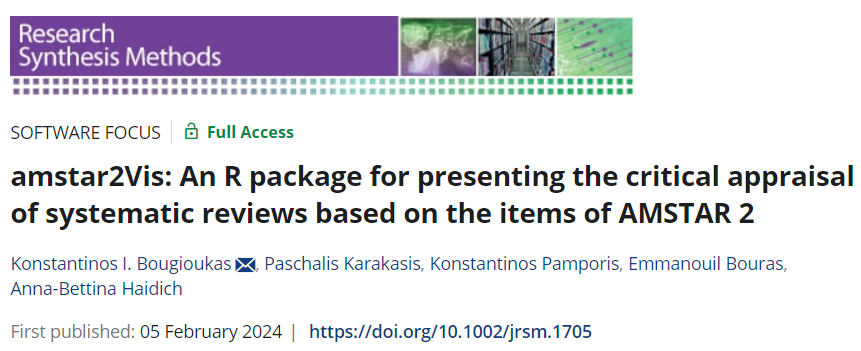
New paper has just been published! amstar2Vis is our new R package for AMSTAR 2 assessment presentation➡️ onlinelibrary.wiley.com/doi/full/10.10… #RPackages #rstats #RProgramming #dataviz #RiskofBias #MetaAnalysis #EvidenceSynthesis #SystematicReviews #healthcare @EvidenceRobot @srtoolbox
Something went wrong.
Something went wrong.
United States Trends
- 1. Good Wednesday 30.6K posts
- 2. #NXXT_GridReform N/A
- 3. #wednesdaymotivation 2,689 posts
- 4. #MerryChristmasJustin 8,934 posts
- 5. Hump Day 11.7K posts
- 6. Oslo 275K posts
- 7. María Corina Machado 245K posts
- 8. María Corina Machado 245K posts
- 9. Happy Hump 8,095 posts
- 10. Met Gala 12.6K posts
- 11. Happy Birthday Lawrence N/A
- 12. Immanuel 3,394 posts
- 13. #ดีว่าราวีวันนี้ในโรงภาพยนตร์ 992K posts
- 14. #Wednesdayvibe 2,174 posts
- 15. Waffle House 3,555 posts
- 16. Act III 1,161 posts
- 17. LINGORM CHRISTMAS FAIRIES 456K posts
- 18. Premio Nobel de la Paz 158K posts
- 19. Gowdy 6,920 posts
- 20. FOMC 35.7K posts