#rprogramming 검색 결과

📌📚This step-by-step guide will explore the intricacies of analyzing complex survey data using the powerful R programming language. pyoflife.com/step-by-step-g… #DataScience #rprogramming #DataScientist #MachineLearning #RStats #Datavisualization #dataanalysis #statisticalanalysis

Quarto combines content & code for outputs like PDFs & dashboards. It creates reproducible documents, updating automatically as data changes. Control look & feel, plus code visibility. #RProgramming #Quarto
📌📘In the realm of biomedical and health applications, predictive analytics can be a lifesaver, guiding clinicians towards personalized treatments and preventive measures. pyoflife.com/data-science-a… #DataScience #rprogramming #rstats #DataScientist #statisticalanalysis


📊 Master R for Bioinformatics! 🧬 𝘑𝘰𝘪𝘯 𝘰𝘶𝘳 10-𝘥𝘢𝘺 𝘵𝘳𝘢𝘪𝘯𝘪𝘯𝘨 𝘱𝘳𝘰𝘨𝘳𝘢𝘮 𝘧𝘰𝘳 𝘩𝘢𝘯𝘥𝘭𝘪𝘯𝘨 𝘢𝘯𝘥 𝘢𝘯𝘢𝘭𝘺𝘻𝘪𝘯𝘨 𝘣𝘪𝘰𝘭𝘰𝘨𝘪𝘤𝘢𝘭 𝘥𝘢𝘵𝘢. More Information: ✉️ [email protected] 📞 +91 6398142849 #Bioinformatics #RProgramming #DataAnalysis
Why R beats SPSS, Stata & SAS! (Data Science) #Rprogramming #DataAnalysis #OpenSource #DataVisualization #StatisticalAnalysis #ReproducibleResearch #ProgrammingTutorial #LearnR #DataScience #RStats
Day 2 of our R Programming Workshop featured sessions on Data Visualization, a Q&A segment, and certificate distribution. Dr. Ajay Kumar Koli was felicitated for his contribution. Vote of Thanks by Dr. Harchand Ram wrapped up the event. #RProgramming #DataAnalysis


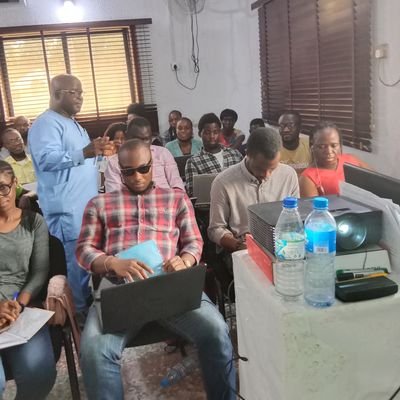
🚀 Hosted a full-day R programming session today! Introduced the R language, uncovered the potentials of tidyverse, and got creative with ggplot. It was a day filled with enjoyable and interactive learning! #RProgramming #DataScience #InteractiveLearning 📊👨🏫📘🎉

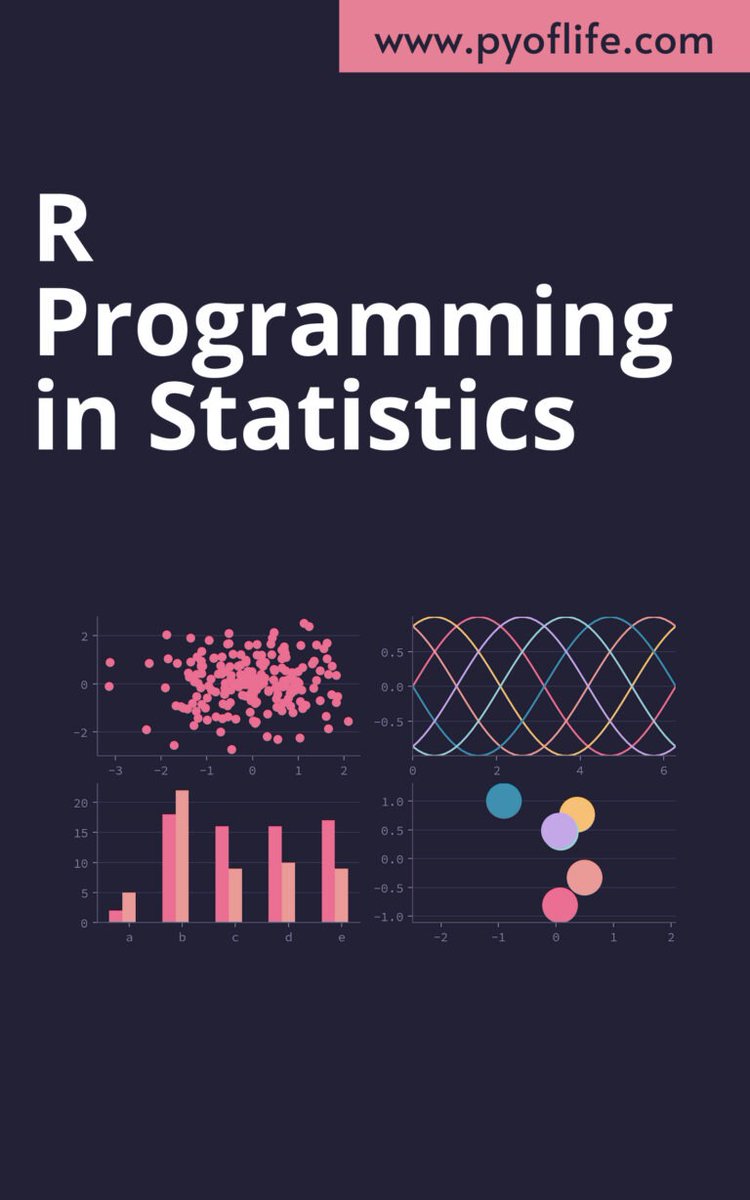
📌📘R provides a powerful set of tools for advanced analytics and graphics. In this textbook, we’ll discuss the features of R that make it suitable for advanced analytics and graphics. pyoflife.com/r-for-everyone… #DataScience #rprogramming #rstats #DataScientists #datavisualization

Logistic regression uses a binary outcome (like diabetes) & multiple predictors. Which combo best predicts the outcome? This video breaks down building the model in R, step-by-step. #LogisticRegression #RProgramming

DDCS Dept. is hosting a Hybrid Training Program on Data Science with Python & R from 20–24 May 2025, 7:00 PM daily. Focus: Stats, visualization, real-world applications & industry skills. #DataScience #Python #RProgramming #DDCS #HybridTraining #CareerSkills

Exploring the configuration of sidebar layouts in R, including the use of slider inputs for dynamic data manipulation and graphic rendering. Learn how to create interactive elements and reference input values within your code. #Rprogramming #ShinyApp


Statistics, the art of deciphering patterns and insights from data, is akin to unraveling the intricate threads of a tapestry. pyoflife.com/r-programming-… #DataScience #rprogramming #statistics #Rstats #MachineLearning #datavisualizations #datascientists

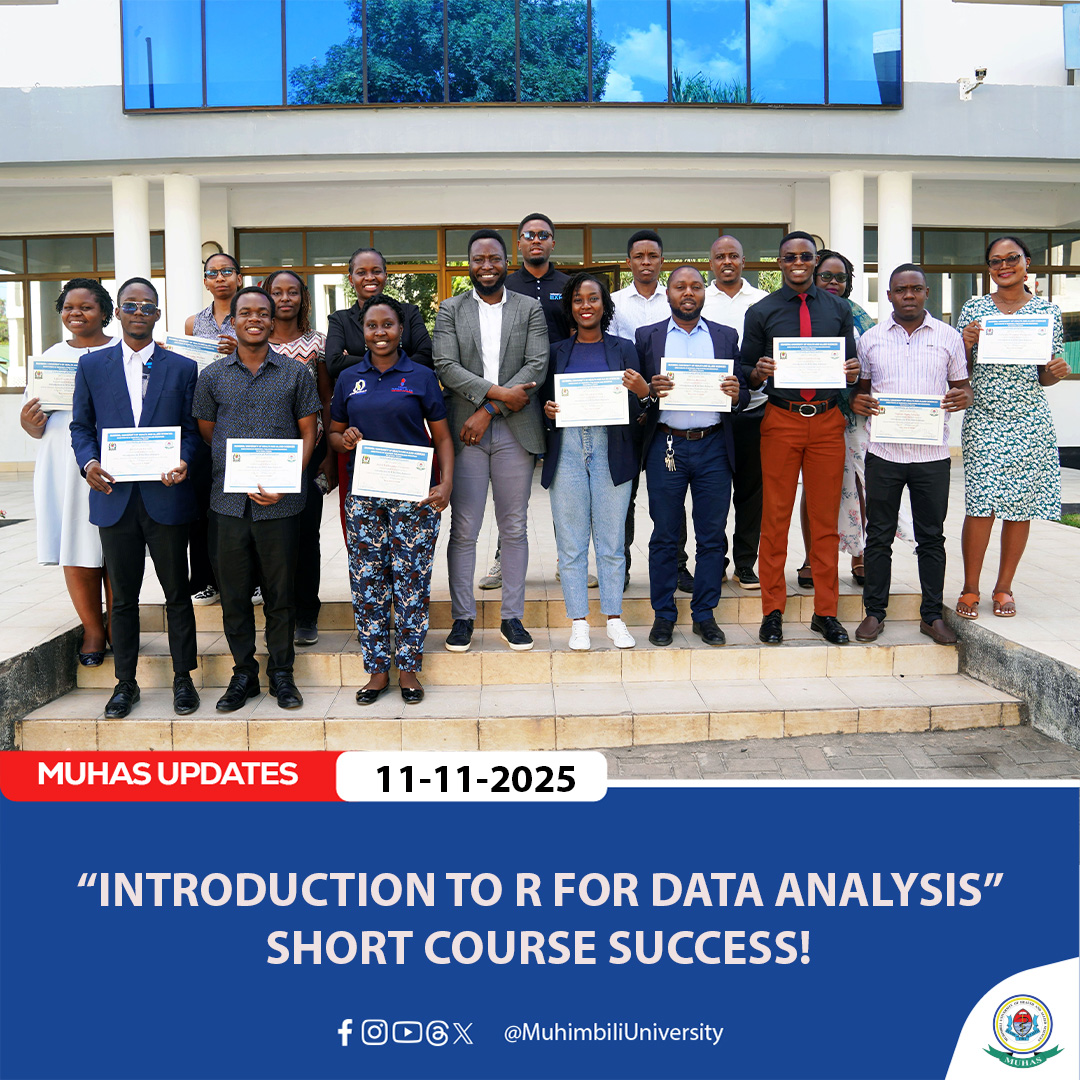
Participants of the recent short course, held at the MUHAS Harvard Boardroom (CHPE), are now equipped with essential data analysis skills. #MUHAS #DataAnalysis #RProgramming #ShortCourse #CHPE

Does anyone have a copy or know if this was published? "R Pocket Guide" by Joseph Adler @jadler #RLang #RProgramming

How to start a project in R studio #RProgramming #RStudio #DataAnalysis #DataScience #ProgrammingTutorial #LearnR #DataImport #DataManipulation #Coding #DataScienceTips
Master Geospatial Plots with R: A Code Walkthrough #Rprogramming #ggplot2 #geospatial #dataviz #Rstats #mapping #visualization #tidyverse #gis #coding


Chi-Squared Test: Finally Understand It! (R Tutorial) #ChiSquaredTest #RProgramming #DataAnalysis #GoodnessOfFit #Tidyverse #Forcats #DataVisualization #HypothesisTesting #NestedKnowledge #StatisticsTutorial

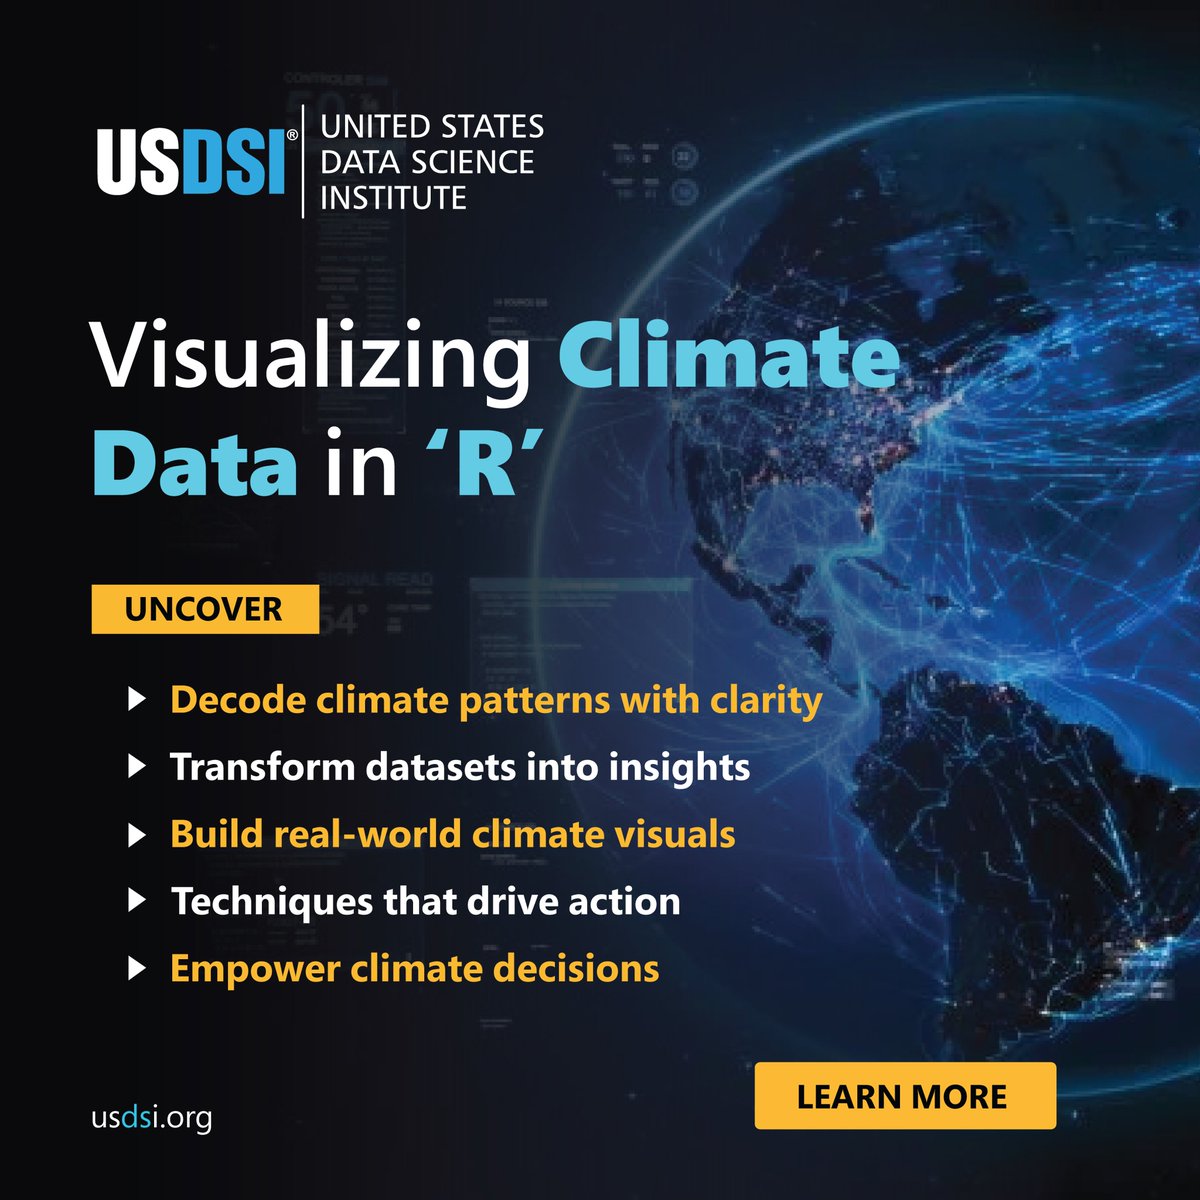
Climate change impact is real, but decoding its complex data shouldn’t be overwhelming. Discover how visualization using R brings clarity, meaning, and precision to climate insights. Discover more tinyurl.com/yz9vkphh #ClimateData #RProgramming #DataVisualization

What Are The Advantages Of R Programming? 𝐑𝐞𝐚𝐝 𝐎𝐮𝐫 𝐋𝐚𝐭𝐞𝐬𝐭 𝐁𝐥𝐨𝐠𝐬: cromacampus.com/blogs/what-are… 𝐅𝐨𝐫 𝐅𝐫𝐞𝐞 𝐂𝐨𝐧𝐬𝐮𝐥𝐭𝐚𝐭𝐢𝐨𝐧 𝐂𝐚𝐥𝐥/𝐖𝐡𝐚𝐭𝐬𝐚𝐩𝐩:+91-9711526942 #RProgramming #LearnR #RStats #RLanguage #RForDataScience #RDev #RCode

Participants of the recent short course, held at the MUHAS Harvard Boardroom (CHPE), are now equipped with essential data analysis skills. #MUHAS #DataAnalysis #RProgramming #ShortCourse #CHPE
Logistic regression uses a binary outcome (like diabetes) & multiple predictors. Which combo best predicts the outcome? This video breaks down building the model in R, step-by-step. #LogisticRegression #RProgramming

🚀 Your Pathway to Becoming a Successful Python / R Programmer Starts Here! 💻 📞 Call: +91 88005 95295 🌐 Visit: pinakiithub.com #PythonProgramming #RProgramming #DataScience #MachineLearning #PinakiITConsultant #TechEducation #FutureReady #LearnCoding #CareerGrowth


On 27 October 2025, I hosted an Intro to #RProgramming session for our 1st year MSc Data Science with Business Analysis class, focusing on definition analysis! 🚀 Gamification bridges all generations Millennials, Boomers, Gen Z alike boosting engagement & skills. #BusinessAnalyz


Your First Multiple Linear Regression in R - A Complete Tutorial with Code | The Academic Papers UK Learn more here: theacademicpapers.co.uk/blog/2025/10/2… - - - #RProgramming #DataAnalysis #StatisticsTutorial #MachineLearning #LinearRegression #DataScience #CodingForBeginners


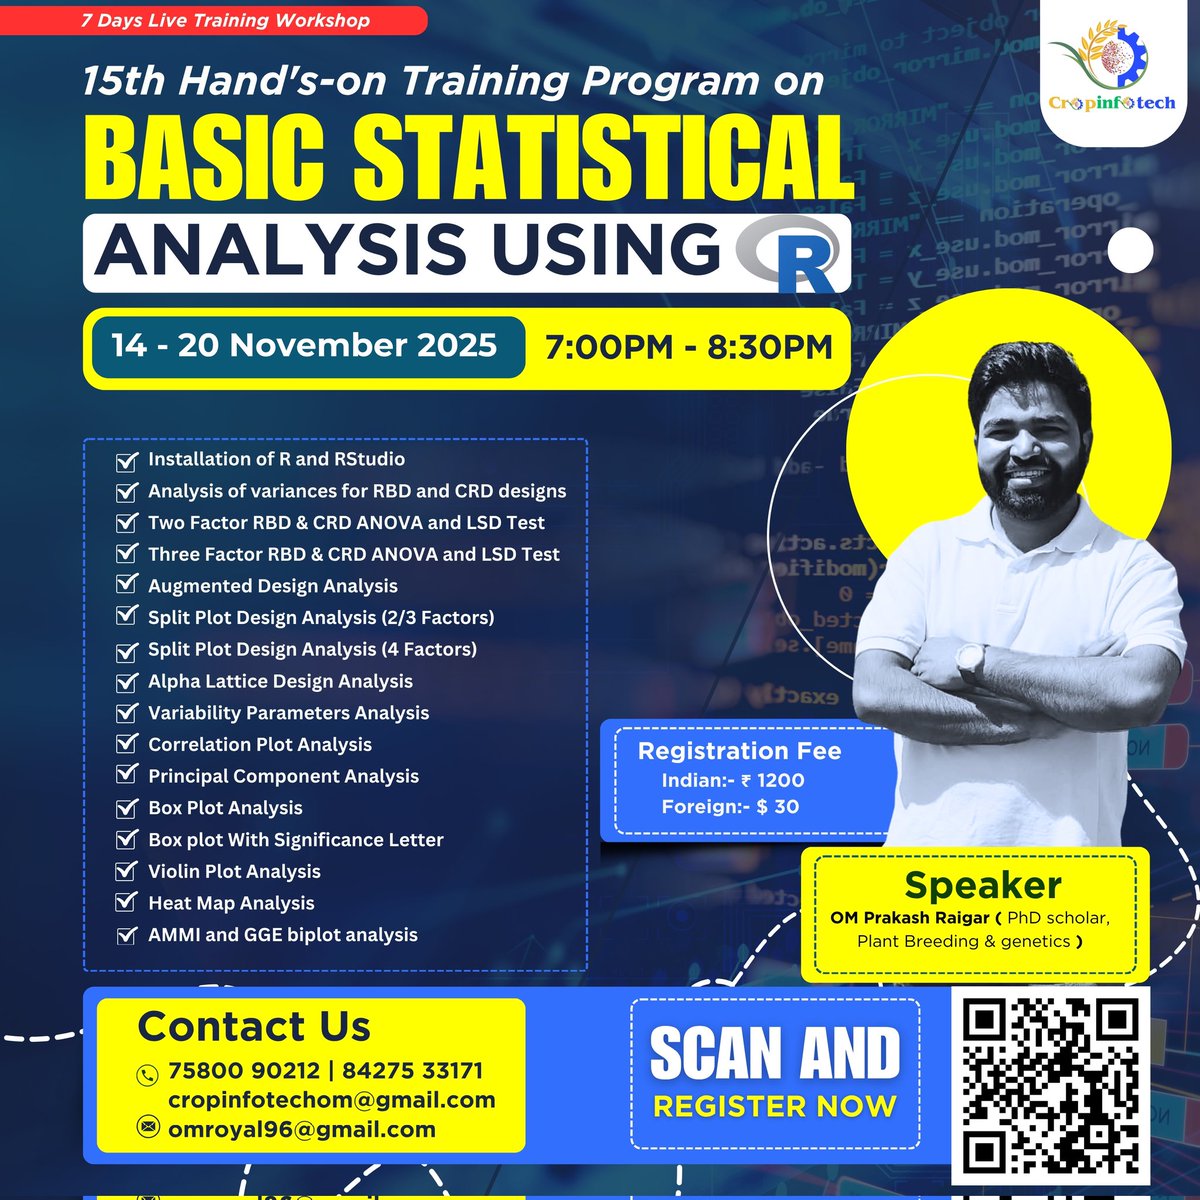
🚀 Master the Power of Data with R! 👉 Register Now – Limited Seats Available! 🔗 cropinfotech.in #RProgramming #StatisticalAnalysis #CropInfotech #DataScience #RTraining #PlantBreeding #AgriculturalResearch #Workshop #LearningByDoing #ResearchTools
Quarto combines content & code for outputs like PDFs & dashboards. It creates reproducible documents, updating automatically as data changes. Control look & feel, plus code visibility. #RProgramming #Quarto


📌📘In the realm of biomedical and health applications, predictive analytics can be a lifesaver, guiding clinicians towards personalized treatments and preventive measures. pyoflife.com/data-science-a… #DataScience #rprogramming #rstats #DataScientist #statisticalanalysis
📌📚This step-by-step guide will explore the intricacies of analyzing complex survey data using the powerful R programming language. pyoflife.com/step-by-step-g… #DataScience #rprogramming #DataScientist #MachineLearning #RStats #Datavisualization #dataanalysis #statisticalanalysis

Growth rate of FBR(2001-10) & BRA(2016-23) in Sales tax services. @Noorbaloch72 @BRA_Quetta #Rprogramming


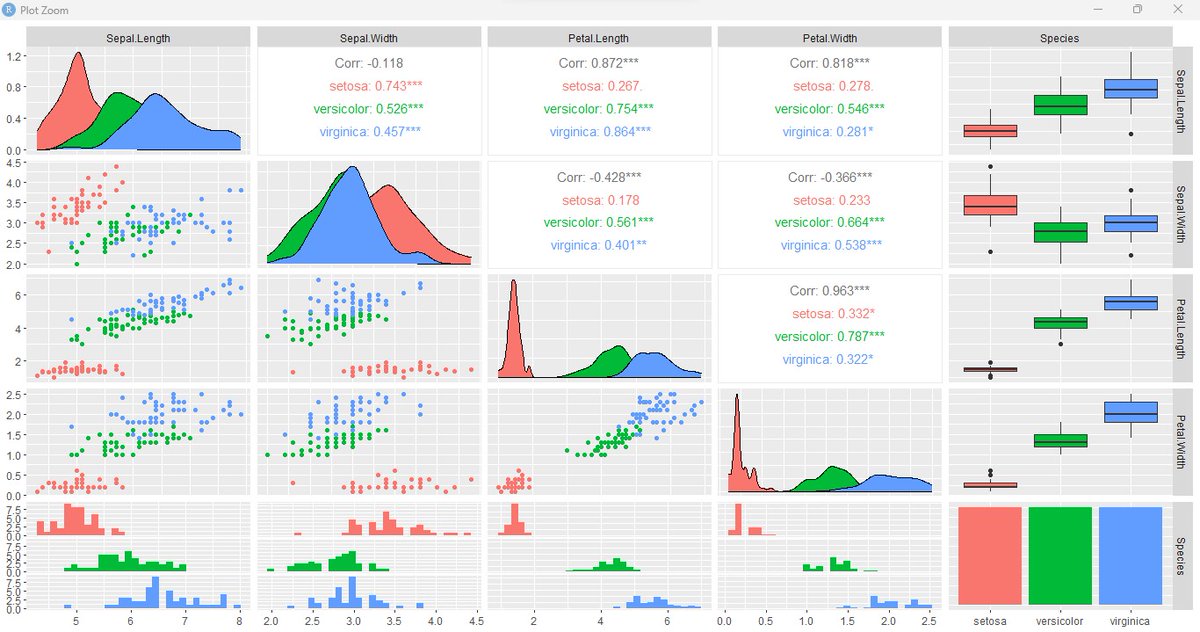
Still on R programming, while ggplot uses multiple lines of code, GGally produces a lot more information for a single line of code. library(GGally) ggpairs(iris, mapping=ggplot2::aes(colour = Species)) #Rprogramming #RStats #RStudio #DataScience #DataAnalytics

Statistics, the art of deciphering patterns and insights from data, is akin to unraveling the intricate threads of a tapestry. pyoflife.com/r-programming-… #DataScience #rprogramming #statistics #Rstats #MachineLearning #datavisualizations #datascientists

Our R for Biochemists 101 course is tailor-made for newcomers, guiding you to master R at your comfort speed. Enrol today for a knowledge boost starting 11 September! #RProgramming ow.ly/A51650PyrKQ


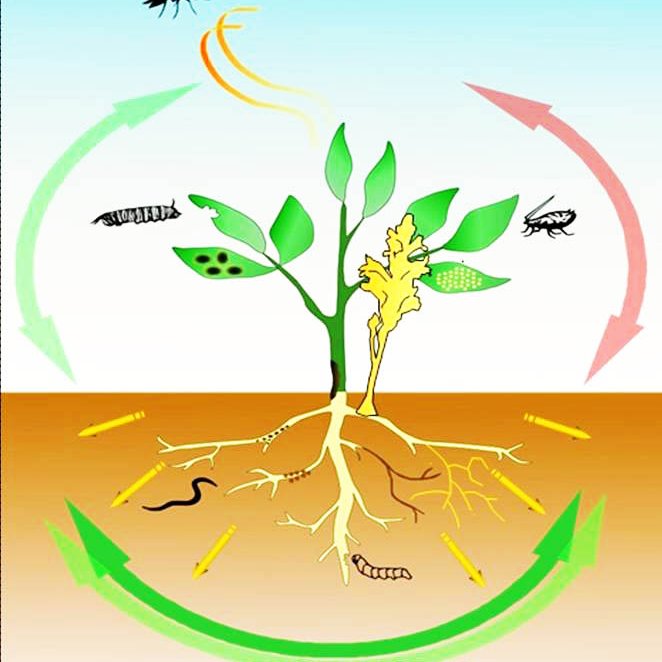
📊 Excited to have Bea as our guide into the world of analyzing biological data with statistics in R! 🧬🔬 #BiologicalData #Statistics #RProgramming"


Exploring the best 2023 data visualization tools in R? 📊 Dive into our comprehensive guide: datanautes.com/en/top-data-vi… #rstats #DataViz #RProgramming

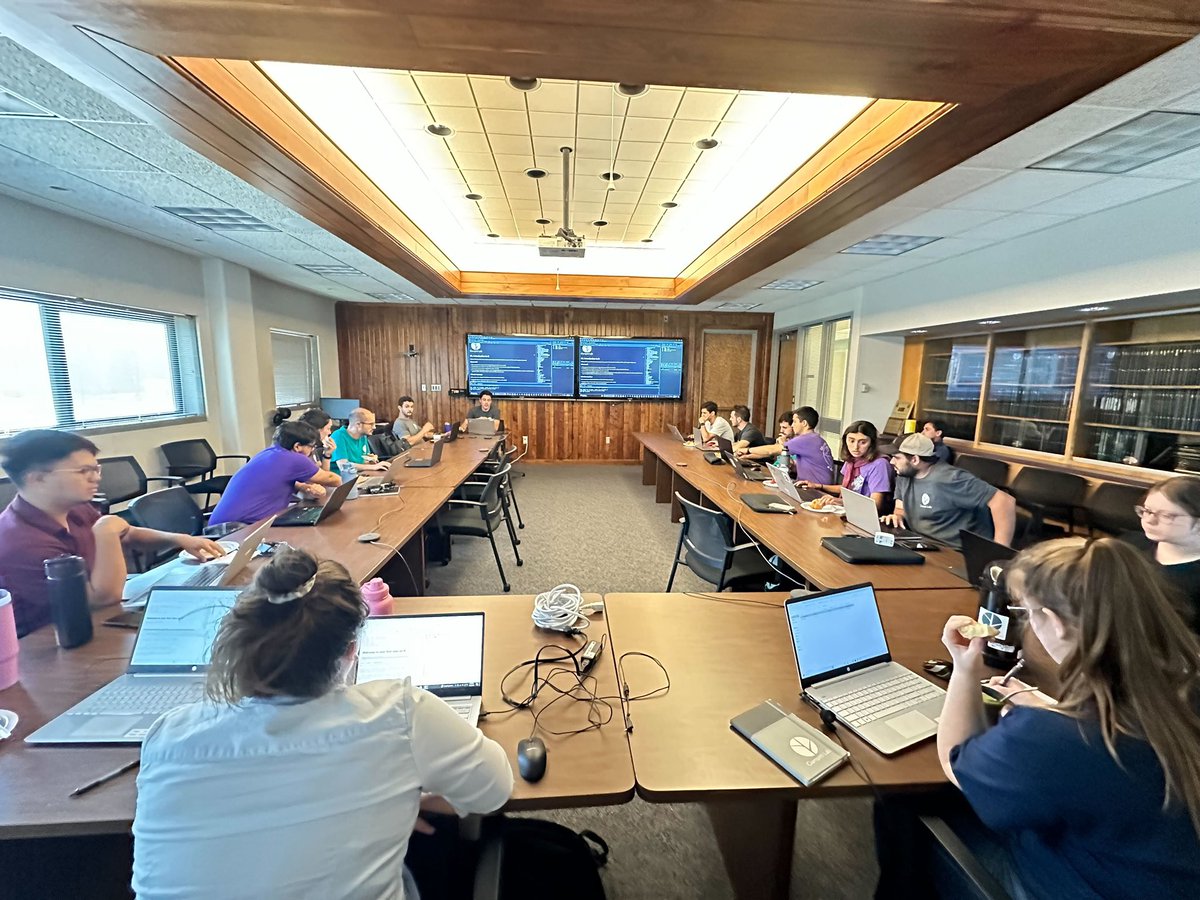
💻 Our team in action at the R workshop! 📊 Every year, our Ph.D. and MS students lead insightful lessons on R, sharing their knowledge with our visiting scholars. It’s always inspiring to see collaboration and learning in full swing! #DataScience #RProgramming #Collaboration


Day 17: Flow #30daymapchallenge Sri Lanka rivers and streams another map made with my package ceylon #rstats #rprogramming


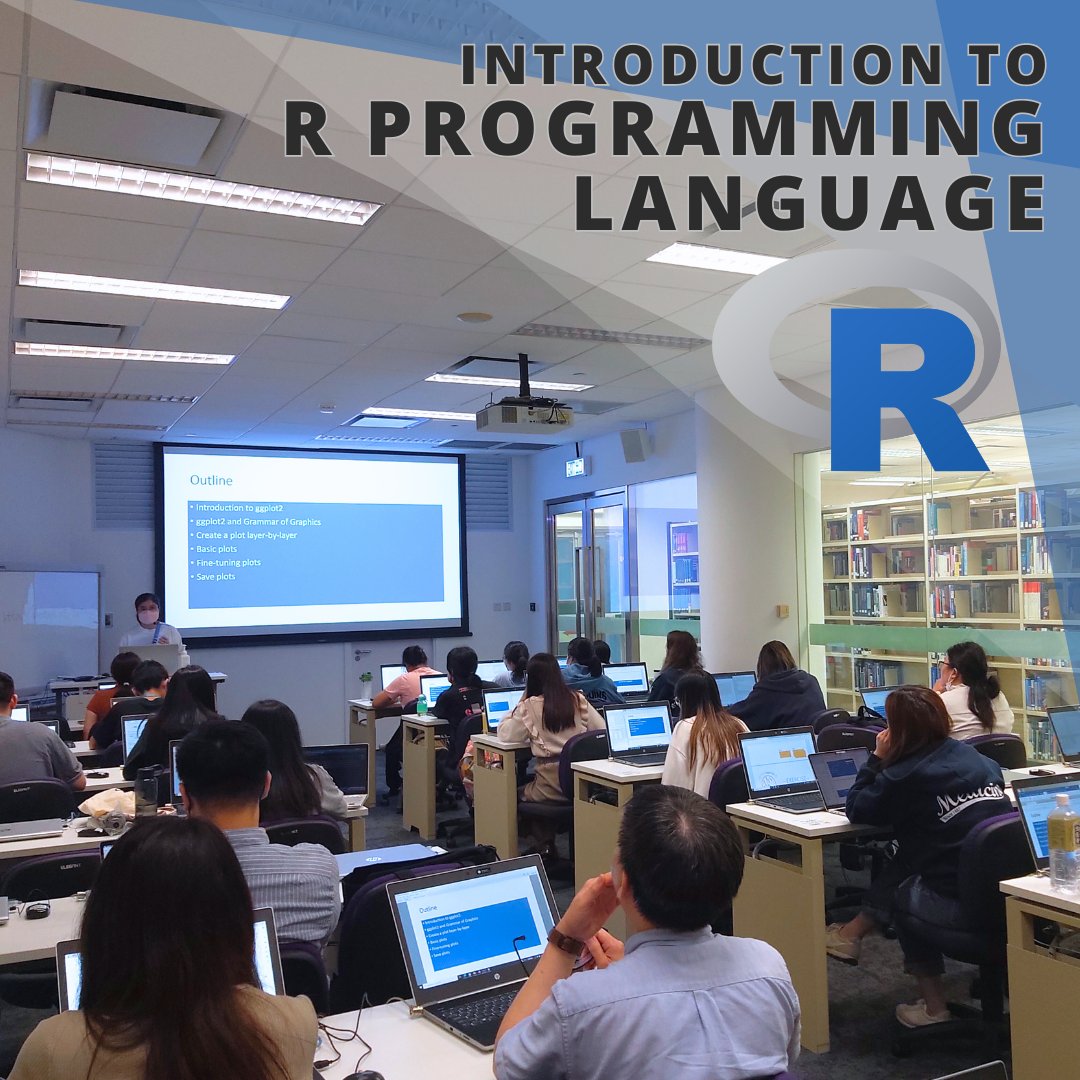
Our workshop on 26/4 introduced participants to basics of R and RStudio. With practical sessions focused on manipulating biological data tables, participants gained valuable hands-on experience. #Bioinformatics #RProgramming #RProgrammingLanguage #DataManipulation #BiologicalData
📌📘R provides a powerful set of tools for advanced analytics and graphics. In this textbook, we’ll discuss the features of R that make it suitable for advanced analytics and graphics. pyoflife.com/r-for-everyone… #DataScience #rprogramming #rstats #DataScientists #datavisualization
DDCS Dept. is hosting a Hybrid Training Program on Data Science with Python & R from 20–24 May 2025, 7:00 PM daily. Focus: Stats, visualization, real-world applications & industry skills. #DataScience #Python #RProgramming #DDCS #HybridTraining #CareerSkills

Final reminder to register for the Statistics Globe online course on "Principal Component Analysis (PCA): From Theory to Application in R" before pre-sell registration closes today: statisticsglobe.com/online-course-… #rstats #rprogramming #machinelearning #datascience #statistics


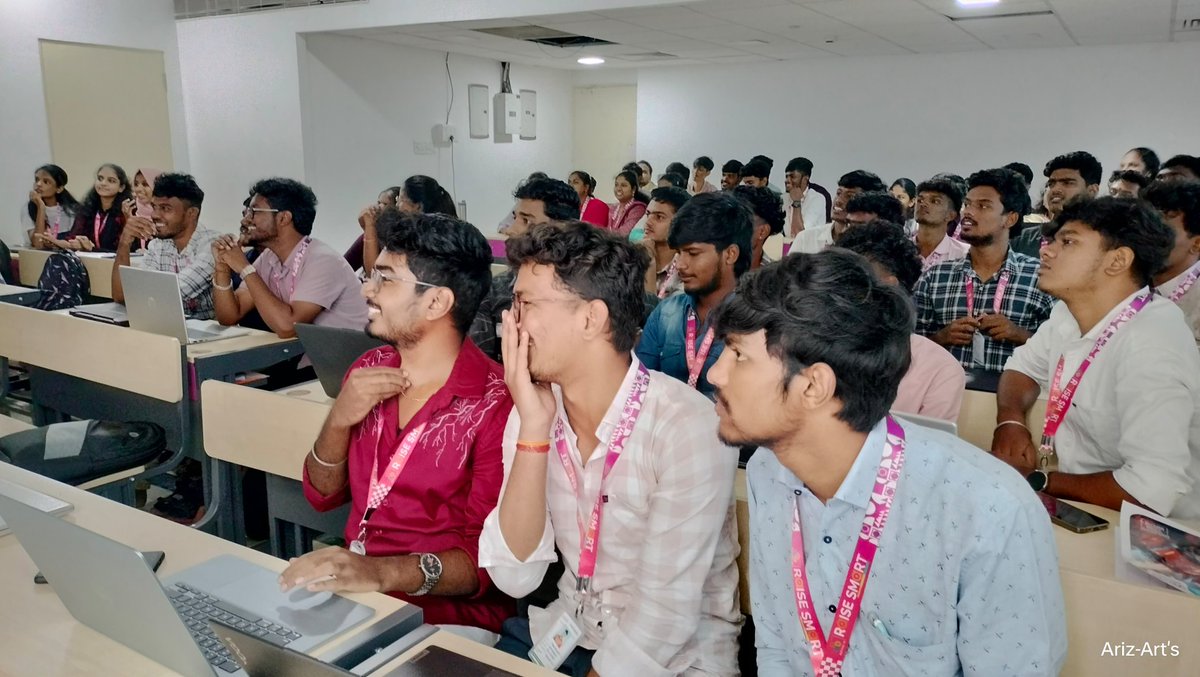
🌟 Thank you to all the amazing attendees who joined today's #Rprogramming session hosted by #gdev! 🙌 Your enthusiasm and engagement made it a truly incredible learning experience. Let's keep exploring the power of R together and continue our data-driven journeys. 💪 #Thankful


I just made exciting graphs exploring the life expectancy of West African countries from 1960-2020! Check out the code on my Github to see how I used R to analyze the data and create the visualizations. github_url : github.com/sadatyussuf/R_… #dataanalysis #Rprogramming #Rstats


Day 2 of our R Programming Workshop featured sessions on Data Visualization, a Q&A segment, and certificate distribution. Dr. Ajay Kumar Koli was felicitated for his contribution. Vote of Thanks by Dr. Harchand Ram wrapped up the event. #RProgramming #DataAnalysis

Join our Spatial Data Science (self-paced) online course—now partially sponsored at just R1500 per delegate! Learn cutting-edge techniques like regression, Kriging, and more. zurl.co/4UvO #SpatialDataScience #DataAnalytics #RProgramming #Geospatial #DataScience

Something went wrong.
Something went wrong.
United States Trends
- 1. #SpotifyWrapped 64K posts
- 2. Chris Paul 18.2K posts
- 3. Clippers 27.7K posts
- 4. #NSD26 9,788 posts
- 5. Good Wednesday 31.3K posts
- 6. #WednesdayMotivation 3,647 posts
- 7. Hump Day 11.6K posts
- 8. National Signing Day 3,971 posts
- 9. Nashville 32.6K posts
- 10. #Wednesdayvibe 2,014 posts
- 11. Happy Hump 7,684 posts
- 12. Wordle 1,628 X N/A
- 13. #PutThatInYourPipe N/A
- 14. Wonderful Wednesday 6,237 posts
- 15. Welcome Home 15.5K posts
- 16. TOP CALL 10.9K posts
- 17. The BIGGЕST 310K posts
- 18. Somalis 105K posts
- 19. Fisherman 11.5K posts
- 20. FELIX LV VISIONARY SEOUL 29.5K posts