#datavisulization search results

Join us on November 11 to put your data visualization & creativity skills to the test and enter the very first York University Libraries Data Storytelling Challenge! Register now: bit.ly/3Xe2vld #YorkU #LibraryWorkshop #DataVisulization


I jumped on @Adordev_ Flood disaster data set. • 50,000+ data set cleaned using Excel and Power Query. • Geographical impact analyzed. • Insights and Recommendations were also made. •Full documentation @ github.com/bjstardom001/D… #PowerBI #DataVisulization #DataAnalytics


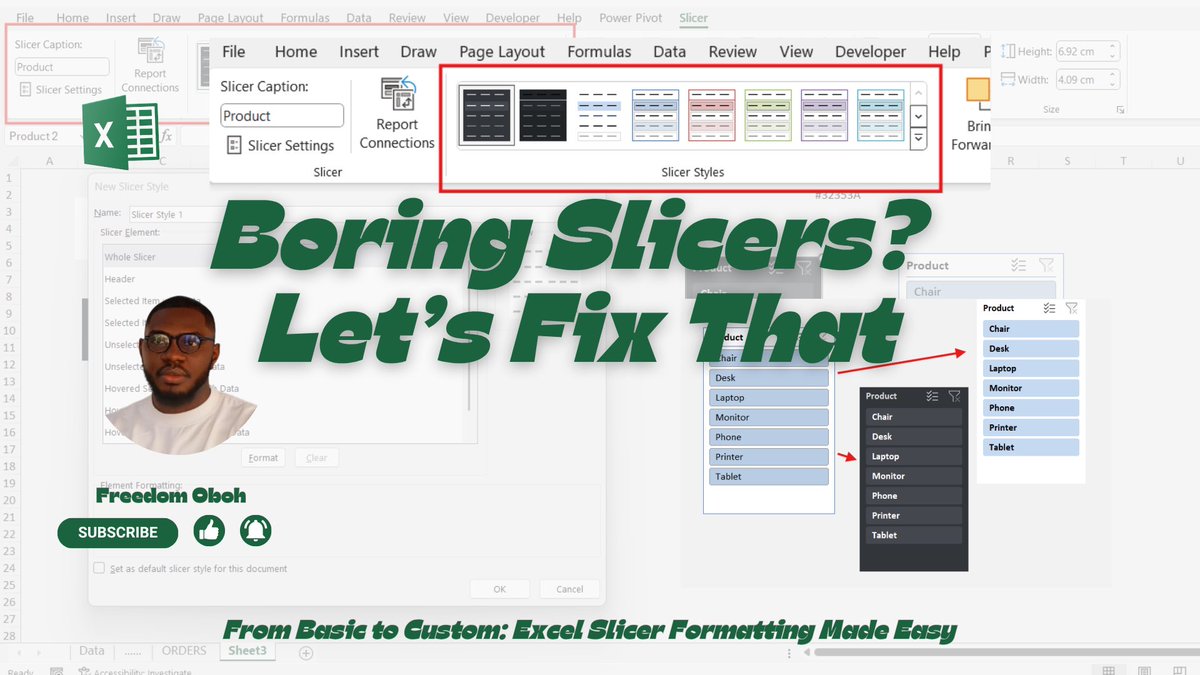
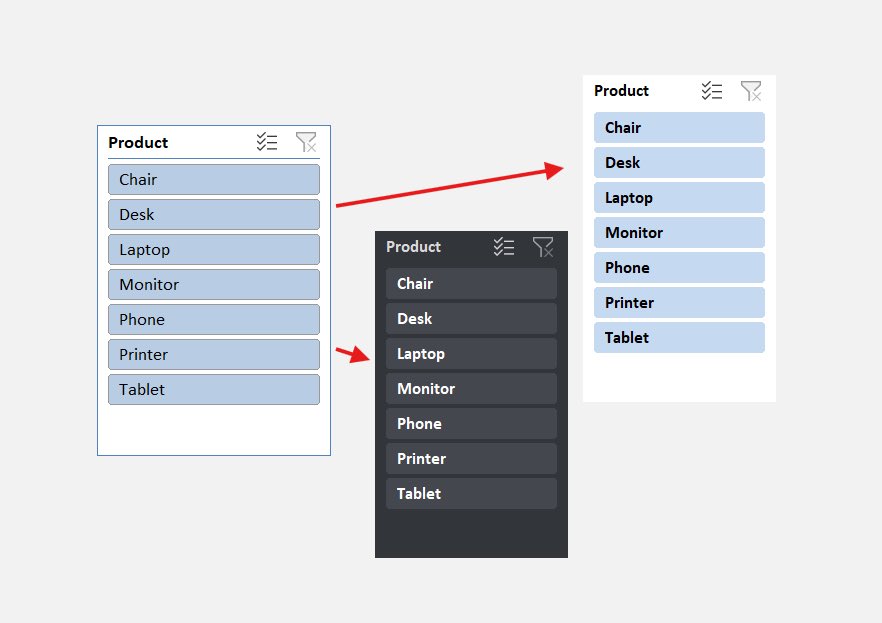
Boring Excel Slicers ? Let’s Fix that … VIDEO IS OUT NOW on my YouTube channel Here 👉 youtu.be/UsCvD57-PbI?si… #Excel #Datavisulization #Slicer


🚀 Thrilled to share my latest project: an interactive deep dive into Romania's last 30 years through 16 socio-economic indicators. 400+ maps & charts, plus #sonified county rankings (yes, #data you can hear 🎹). #datavisulization Check it out! 👇 panorama.ro/romania-30-yea…


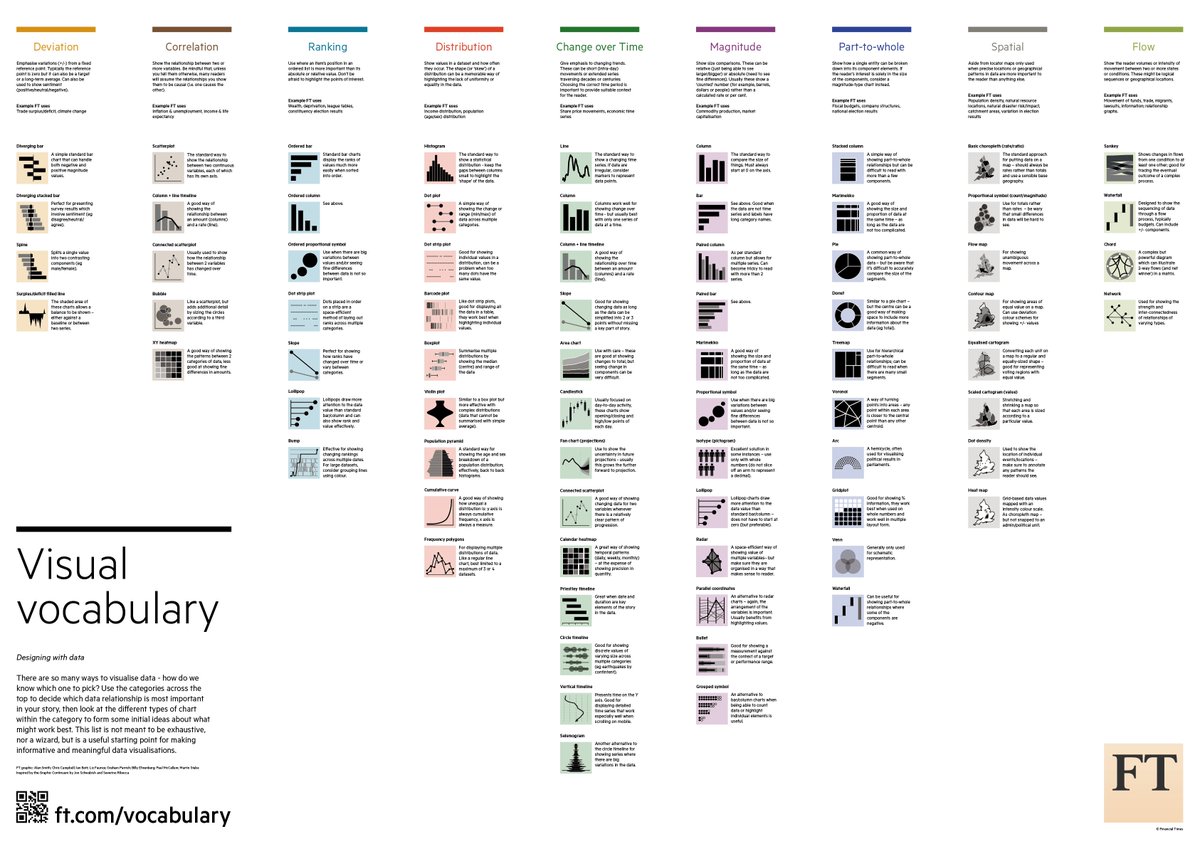
All the #dataviztips: an impressive compendium of #datavisulization best practices from @martinstabe and @ftdata. 💯👏 #dataviz buff.ly/2G43LxR
Drop-in to Markham Campus Library on September 30 to discover the combined abilities of the newly opened Markham Library’s Visualization Studio and Gaming Lab! Register now: bit.ly/3W88mbd #YorkU #DataVisulization #LibraryWorkshop


Faster tree maps on the latest version of Kx Dashboards provides user with the ability to improve existing visualizations. Learn more about the power of Kx Dashboards here : bit.ly/2NG8Y5R #DataVisulization #FastData


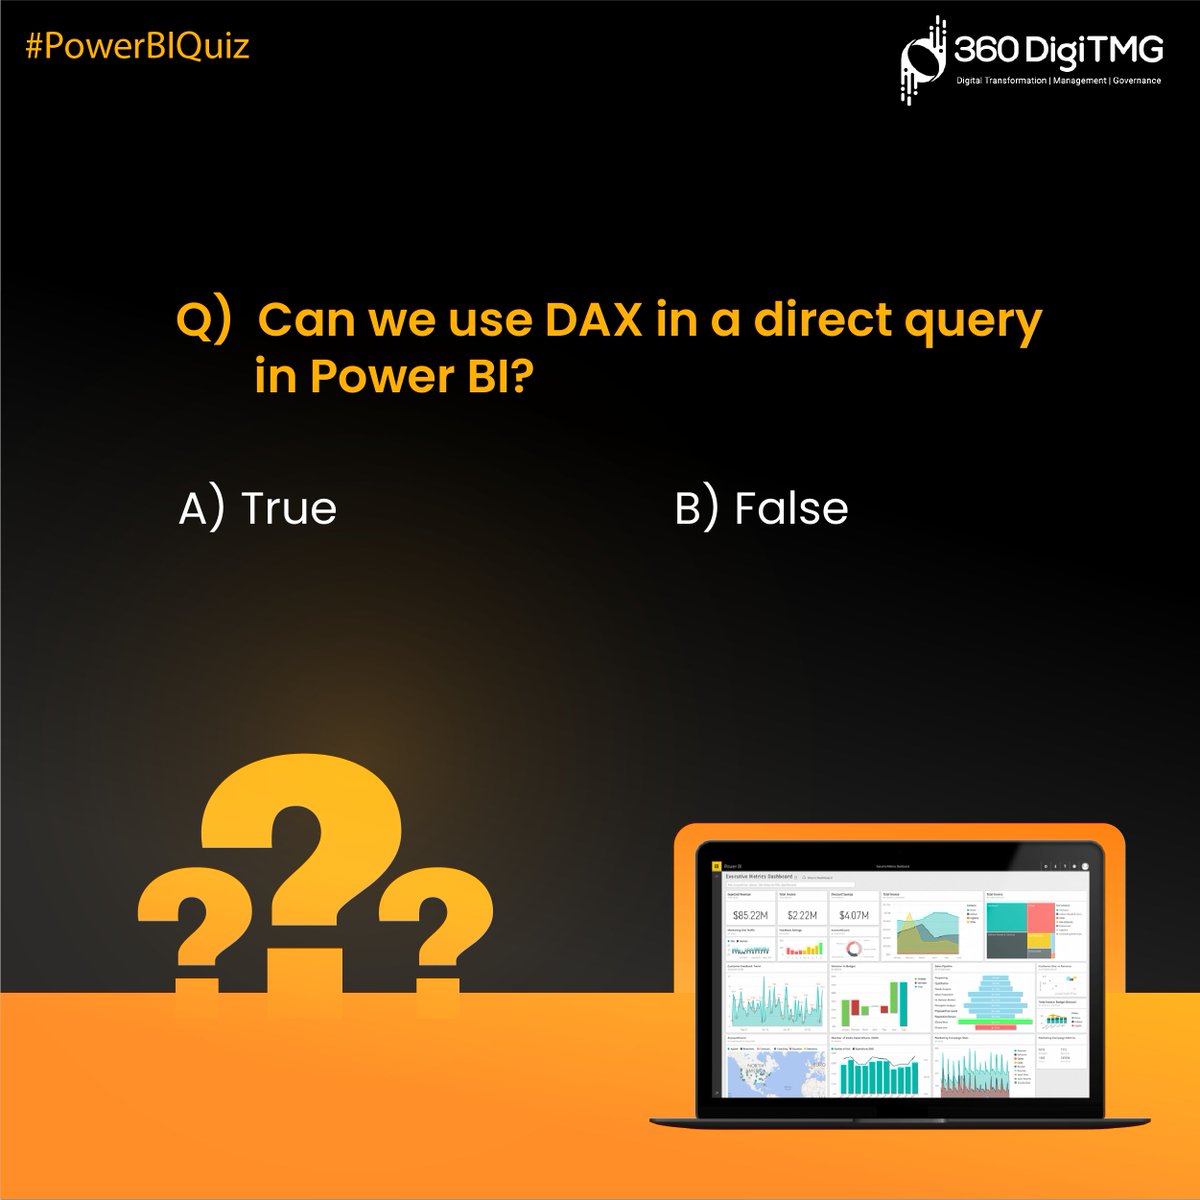
Enhance your Power BI knowledge by answering our quiz questions #PowerBI #DataAnalytics #DataVisulization #Quiz #360DigiTMGmalaysia

Visualizing the progression of Coronavirus with Tableau. towardsdatascience.com/visualizing-th… #datavisulization #coronavirusdata #livedata


Surprised by #UNRWA bias? Dive deeper into #UnitedNations resolutions. Take 2 minutes to watch this video and explore the interactive #Datavisulization for more insights. Share your thoughts! Desktop🔗 public.tableau.com/app/profile/ni… Mobile 🔗 public.tableau.com/views/UNCondem…

A picture is worth a thousand words. And #DataVisulization can be worth even more... if you do it right. learn.g2.com/data-visualiza…

Peter became the longest running IronViz champion in living memory. Paul on the other hand got rich by writing an accidental bestseller about hedge trimming. Let's call it even. #IronViz #datavis #Datavisulization #tableau #datafam #humor? martintelefont.com/datahumorism


Saivi - Embark the Journey of Data | Data Scraping | Data Labeling | Data Visualization Services bit.ly/3JtgMBo #datascraping #datalabeling #datavisulization #USA


This interactive visualisation is so epic, I'm surprised I never saw it before: globe.cid.harvard.edu #dataviz #datavisulization #interactivedesign #economics #trade #economy #exports


🎨✨ Combine design power with data storytelling! Learn how InDesign and Datylon make it easy to create custom data stories and reports. Full guide: hubs.ly/Q02R-2-s0 #datavisulization #storytelling #indesign


When you have a cool skill in #DataVisulization #DataAnalytics and #BusinessIntelligence You Roll Like a boss when reporting to management......😎
Gear up for the new year on a powerful note with @MSPowerBI Check out some of the sample #PowerBI dashboards created by CloudMoyo experts - hubs.li/Q02dM_720 #DataVisulization #BusinessIntelligence #BigData #DataVisualizationTools #DataStoryTelling #Analytics


Fall is coming with its bounty of new workshops and learnings. Check out our calendar at intersol.ca/training/works… #DataVisulization #onlinetraining #onlinelearning #onlinecourses #negotiationskills #falltraining

Join us on November 11 to put your data visualization & creativity skills to the test and enter the very first York University Libraries Data Storytelling Challenge! Register now: bit.ly/3Xe2vld #YorkU #LibraryWorkshop #DataVisulization

Check out my LinkedIn for full post: linkedin.com/posts/victor-c… A big shout-out and appreciation to @AdelaniFavour for building a portfolio for me. Reach out to him for your portfolio creation. #PowerBI #Excel #DataVisulization #Dataanalysis
linkedin.com
#datafam #datafestafrica2025 #powerbi #businessintelligence #exceldeveloper #datavisualization...
Hi #datafam What are you building this week? This week is still fresh and full with energy that if well absorbed, you could attain full potentials ( I mean you could achieve alot). So during the...
Drop-in to Markham Campus Library on September 30 to discover the combined abilities of the newly opened Markham Library’s Visualization Studio and Gaming Lab! Register now: bit.ly/3W88mbd #YorkU #DataVisulization #LibraryWorkshop
I jumped on @Adordev_ Flood disaster data set. • 50,000+ data set cleaned using Excel and Power Query. • Geographical impact analyzed. • Insights and Recommendations were also made. •Full documentation @ github.com/bjstardom001/D… #PowerBI #DataVisulization #DataAnalytics
Boring Excel Slicers ? Let’s Fix that … VIDEO IS OUT NOW on my YouTube channel Here 👉 youtu.be/UsCvD57-PbI?si… #Excel #Datavisulization #Slicer

Truly honored to have my project recognized by Microsoft Power Platform! Grateful for the opportunity to showcase skills in data pipelines, storytelling, and visualization. Thank you for the encouragement! #DataAnalytics #Datavisulization


𝗧𝘂𝗿𝗻 𝗰𝗼𝗺𝗽𝗹𝗲𝘅 𝗱𝗮𝘁𝗮 𝗶𝗻𝘁𝗼 𝗽𝗼𝘄𝗲𝗿𝗳𝘂𝗹 𝗶𝗻𝘀𝗶𝗴𝗵𝘁𝘀 𝘄𝗶𝘁𝗵 𝗰𝘂𝘁𝘁𝗶𝗻𝗴-𝗲𝗱𝗴𝗲 𝗱𝗮𝘁𝗮 𝘃𝗶𝘀𝘂𝗮𝗹𝗶𝘇𝗮𝘁𝗶𝗼𝗻! Simplify, analyze, and act with advanced data visualization! 𝗞𝗻𝗼𝘄 𝗠𝗼𝗿𝗲: digiprima.com/data-visualiza… #Datavisulization

🚀 Thrilled to share my latest project: an interactive deep dive into Romania's last 30 years through 16 socio-economic indicators. 400+ maps & charts, plus #sonified county rankings (yes, #data you can hear 🎹). #datavisulization Check it out! 👇 panorama.ro/romania-30-yea…
🎨✨ Combine design power with data storytelling! Learn how InDesign and Datylon make it easy to create custom data stories and reports. Full guide: hubs.ly/Q02R-2-s0 #datavisulization #storytelling #indesign

Visit our website at scilsng.com, and scilsuk.com #datavisulization #dataanalytics #CareerGrowth #professionaltraining
scilsuk.com
SCILS Management Centre, UK - Home
Welcome to SCILS Management Centre, a global powerhouse specializing in Training, Consulting, and Outsourcing solutions

How Data Visualization Boosts Real Estate Marketing Success jasonfox.me/data-visualiza… #datavisulization #realestate #MarketingTips
jasonfox.me
How Data Visualization Boosts Real Estate Marketing Success
Data visualization makes complex real estate data easy to understand, empowering agents to analyze pricing trends, engage buyers, and close deals more effectively. Learn how to use visual tools to...

#DataVisulization #DataAnalytics #India #Rajasthan #sriganganagar ✊Data Analysis: A Game-Changer for Modern Businesses Data analysis has become an essential tool for businesses striving to stay competitive in today’s digital age. oazshakti.com/data-analysis-…

✊Let's Work On.... #PowerBI #DataVisulization #DataAnalytics #India #Rajasthan #sriganganagar oazshakti.com [email protected] +91-8005816132, +91-9717299031
Boring Excel Slicers ? Let’s Fix that … VIDEO IS OUT NOW on my YouTube channel Here 👉 youtu.be/UsCvD57-PbI?si… #Excel #Datavisulization #Slicer
I jumped on @Adordev_ Flood disaster data set. • 50,000+ data set cleaned using Excel and Power Query. • Geographical impact analyzed. • Insights and Recommendations were also made. •Full documentation @ github.com/bjstardom001/D… #PowerBI #DataVisulization #DataAnalytics
Join us on November 11 to put your data visualization & creativity skills to the test and enter the very first York University Libraries Data Storytelling Challenge! Register now: bit.ly/3Xe2vld #YorkU #LibraryWorkshop #DataVisulization
All the #dataviztips: an impressive compendium of #datavisulization best practices from @martinstabe and @ftdata. 💯👏 #dataviz buff.ly/2G43LxR
🚀 Thrilled to share my latest project: an interactive deep dive into Romania's last 30 years through 16 socio-economic indicators. 400+ maps & charts, plus #sonified county rankings (yes, #data you can hear 🎹). #datavisulization Check it out! 👇 panorama.ro/romania-30-yea…
Faster tree maps on the latest version of Kx Dashboards provides user with the ability to improve existing visualizations. Learn more about the power of Kx Dashboards here : bit.ly/2NG8Y5R #DataVisulization #FastData

Introducing our fourth panelist: Dr @finkga who starts with "Cyber is much more complex than most data" #ieeevis #VizSec #DataVisulization #CyberSecurity


Enhance your Power BI knowledge by answering our quiz questions #PowerBI #DataAnalytics #DataVisulization #Quiz #360DigiTMGmalaysia
Truly honored to have my project recognized by Microsoft Power Platform! Grateful for the opportunity to showcase skills in data pipelines, storytelling, and visualization. Thank you for the encouragement! #DataAnalytics #Datavisulization
Visualizing the progression of Coronavirus with Tableau. towardsdatascience.com/visualizing-th… #datavisulization #coronavirusdata #livedata

Get your #cryptocurrency coin search going! Are you looking for a solution to help you stay connected with the best cryptocurrency coins? We have the solution. #DataVisulization #Fintech #Defi


A broad overview of color schemes in data visualization. We've some interesting pro tips on how to choose color schemes, color patterns, & more. Source: Warsaw University of Technology #datavisulization #data #bigdata #datascience #algoideas


There’s a new color picker tool to help with selecting a palette for data visualizations: bit.ly/2qoGm3Y #datacolor #datavisulization #tech #GIS #mapping @GISlounge


Do you wish you could create more powerful reports? Get several tips for working with Microsoft Power BI to tell the story of your data in a meaningful way. #PowerBI #DataVisulization #Microsoft

Saivi - Embark the Journey of Data | Data Scraping | Data Labeling | Data Visualization Services bit.ly/3JtgMBo #datascraping #datalabeling #datavisulization #USA
Something went wrong.
Something went wrong.
United States Trends
- 1. #BUNCHITA 1,341 posts
- 2. #SmackDown 43.8K posts
- 3. Tulane 4,076 posts
- 4. Aaron Gordon 3,116 posts
- 5. Giulia 14.2K posts
- 6. Supreme Court 179K posts
- 7. Russ 13.2K posts
- 8. Connor Bedard 2,616 posts
- 9. #TheLastDriveIn 3,430 posts
- 10. Podz 2,796 posts
- 11. #OPLive 2,233 posts
- 12. #TheFutureIsTeal N/A
- 13. Caleb Wilson 5,569 posts
- 14. Northwestern 4,948 posts
- 15. Frankenstein 74.4K posts
- 16. Memphis 15.8K posts
- 17. Scott Frost N/A
- 18. Rockets 20.1K posts
- 19. Justice Jackson 5,138 posts
- 20. Isaiah Hartenstein 1,075 posts