#esrijs search results

The JS SDK works with raster tiles containing raw values at the view's resolution, reproject and convert them to colored pixels. Client-side RasterFunctions are now available in beta to create raster analysis directly in the browser. 2023-devsummit-plenary.netlify.app/ndvi.html #DevSummit #esrijs
New map from Library of Congress streams the entire 280,000 point database to the browser, which can then be filtered all client-side. #esrijs @EsriDevs

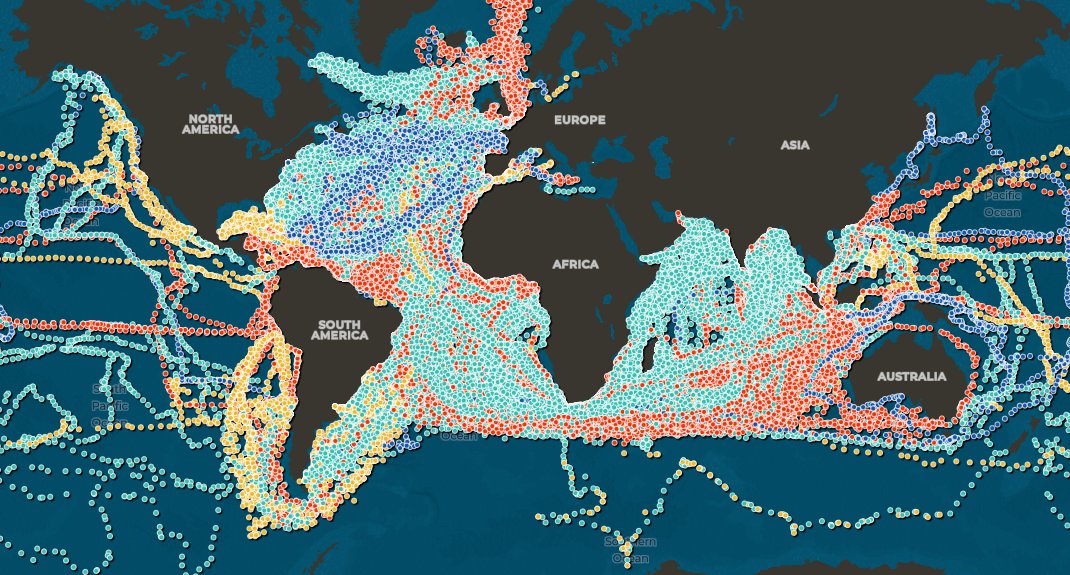
100 years of ship logs mapped, from the Climatological Database for the World's Oceans 1750-1850. googlemapsmania.blogspot.com/2023/03/the-cl…

Someone I met at @foss4g created a pull request for an ArcGIS JS API adapter for Terra Draw - works nicely! github.com/JamesLMilner/t… #esrijs #EsriUC2023


holy moly. That blog I started writing in November finally has its rough draft done. Now to edit! Hopefully the 360 video maps using EsriJS tutorial will be up tomorrow-ish. #webmap #esrijs #gis #youtubeapi


The UX of the @nearmap Mapbrowser for browsing imagery is great. So we pinched it and put it in a widget so you can use it within your own ArcGIS Experience Builder apps. Also a bonus sample for ArcGIS JS API. esriaustraliatechblog.wordpress.com/2023/01/23/nea… Built by @bgtDevhub, #esrijs

@EsriPartners @EsriStartups #developers #javascript #esrijs #geodev #esridev #GIS #esri #arcgis #mapping
i just traced an error for an hour. I had updated the service url for the line layer, not the point layer that I was supposed to be querying. The code was fine the whole time. #gischat #esrijs #fml
@EsriDevs @EsriPartners @EsriStartups #developers #javascript #esrijs #esridev #geodev #GIS #esri #mapping
@EsriPartners @EsriStartups #geodev #esridev #esrijs #developers #javascript #webapps #GIS #esri #arcgis #mapping
🚨New Tutorial on the Blog ! The Making of a 360-Degree Video Map: Connecting EsriJS and YouTube API locative.dev/2023/01/18/360… #gischat #webmap #esrijs @ArcGISApps @ArcGISDevs @hhkaos
@EsriPartners @EsriStartups #geodev #esridev #esrijs #developers #javascript #webapps #GIS #esri #arcgis #mapping
@EsriPartners @EsriStartups #developers #javascript #esrijs #geodev #esridev #GIS #esri #arcgis #mapping #webapps
@EsriPartners @EsriStartups #developers #javascript #esrijs #geodev #esridev #GIS #esri #arcgis #mapping

Enhanced CORS support in version 4.9 of ArcGIS API for JavaScript... community.esri.com/community/deve… #geodev #esrijs

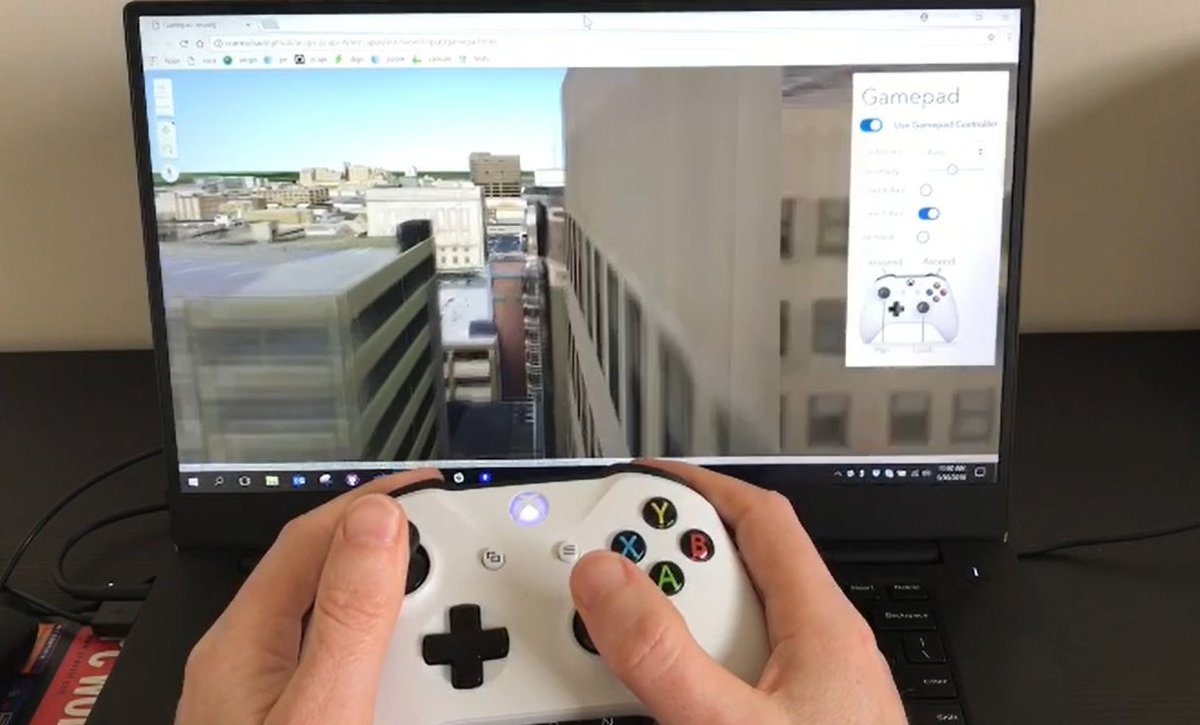
Version 4.9 of the #ArcGIS API for JavaScript is now live! Edit attributes with the new FeatureForm widget, use the enhanced sketch tools, navigate in 2D and 3D using game controllers and much more. More info: esri.com/arcgis-blog/pr… #esrijs #geodev #arcgis @Esri
The 4.11 version of the #ArcGIS API for #JavaScript is live! 4.11 includes much anticipated Editor Widget, a client-side GeoJSON layer, 3D drawing, basic support for time-enabled queries, dot-density & sooo much more! esri.com/arcgis-blog/pr… #esrijs #geodev #webdev #mapping

Introducing the new RouteLayer in @ArcGISJSAPI tinyurl.com/3r5k2pef #developers #javascript #esrijs #esridev #geodev #webapps #routing #transportation #GIS #esri #arcgis #mapping #maps @Esri @EsriGeoDev @EsriTransport @EsriSLGov @EsriBizTeam

Just in time for #EsriUC we’ve release #ArcGIS API for JavaScript 4.8 and 3.25. Be sure to checkout the new features including 2D labeling, heatmaps, underground 3D and much more! esri.com/arcgis-blog/pr… #esrijs #geodev


The 4.12 version of the #ArcGIS API for #JavaScript is live! More support for time-awareness, performance improvements, client-side queries in 3D, 2D WebStyleSymbols, new widgets and more!! Check it out here esri.com/arcgis-blog/pr… #esrijs #geodev #webdev #mapping #esriuc


Latest 3D JS API features being shown off on stage @EsriDevSummit #esrijs #ArcGIS #WebGL #JavaScript #geodev


This web app visualizes wind and water currents through mesmerizing animated streamlines using #ArcGIS API for #JavaScript and custom WebGL #esrijs esri.com/arcgis-blog/pr…
Read more about @odoenet’s custom tooltip built with the latest release of ArcGIS API for JavaScript and other new and powerful functionality. It’s pretty nifty, if he does say so himself! Check out the niftiness: odoe.net/blog/interacti… #esrijs #arcgis #customwidget


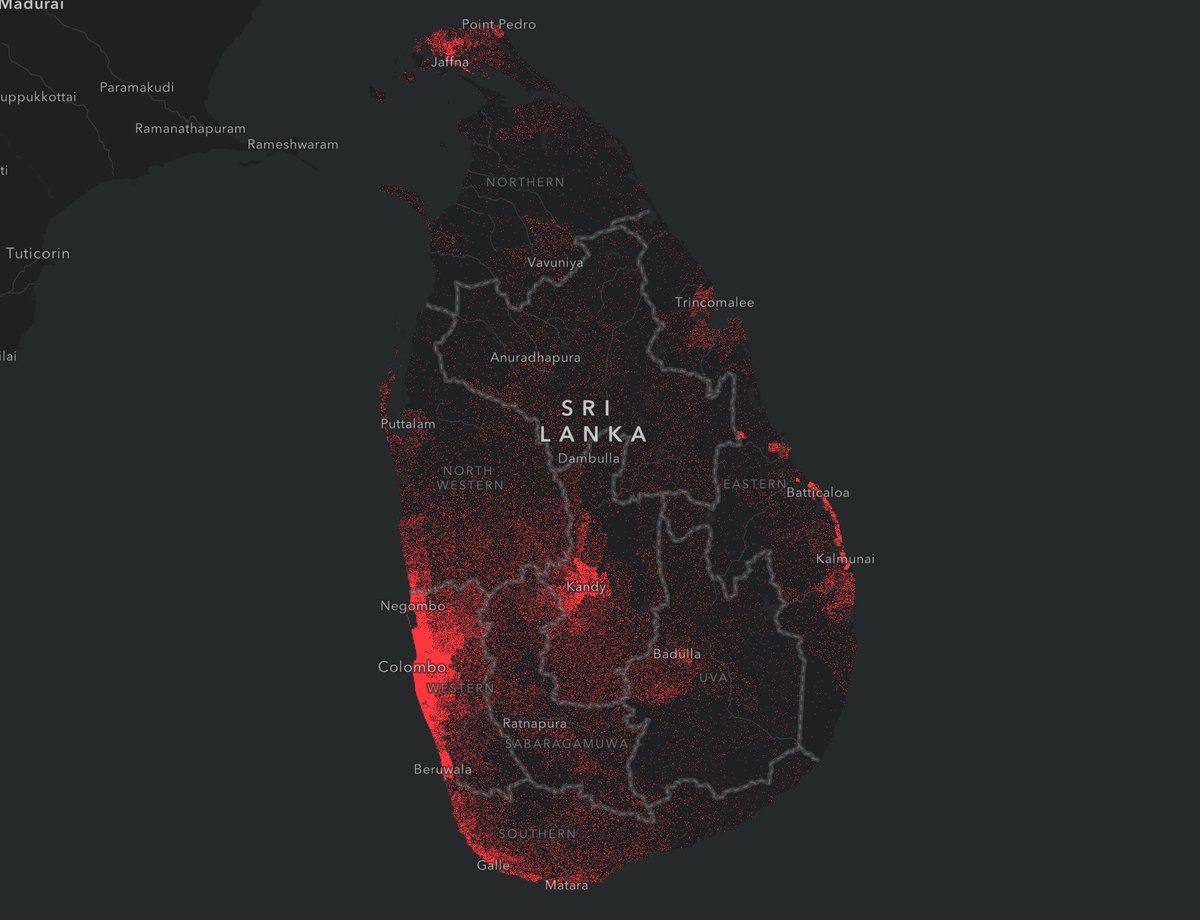
Population density of Sri Lanka. 1 dot = 800 people. Created with GeoJSON in #esrijs @ArcGISJSAPI #dataviz #cartography #GIS #mapping #SriLanka
Here's a great way to explore the Scene Viewer and #ArcGIS API for JavaScript's new 3D capabilities... underground navigation, sketch style edges for 3D objects like buildings and new styling options: arcg.is/yTSCe #esrijs @EsriUC #EsriUC #geodev #arcgis @Esri
That’s a wrap! Showing the latest features of the #3D @ArcGISJSAPI at this year’s @EsriDevSummit plenary You can now filter your #BIM data using the x-ray filter mode… (1/8) #esrijs #3DGIS #WebGL #JavaScript #geodev
Jesse demoed how to create stunning and fun visualizations with glTF 3D models, virtual lighting, and weather API. Heatmap is added in 3D and is drapped on integrated meshes. VoxelLayer and realtime shadow cast analysis brings workflows unique to 3D to the web. #devsummit #esrijs


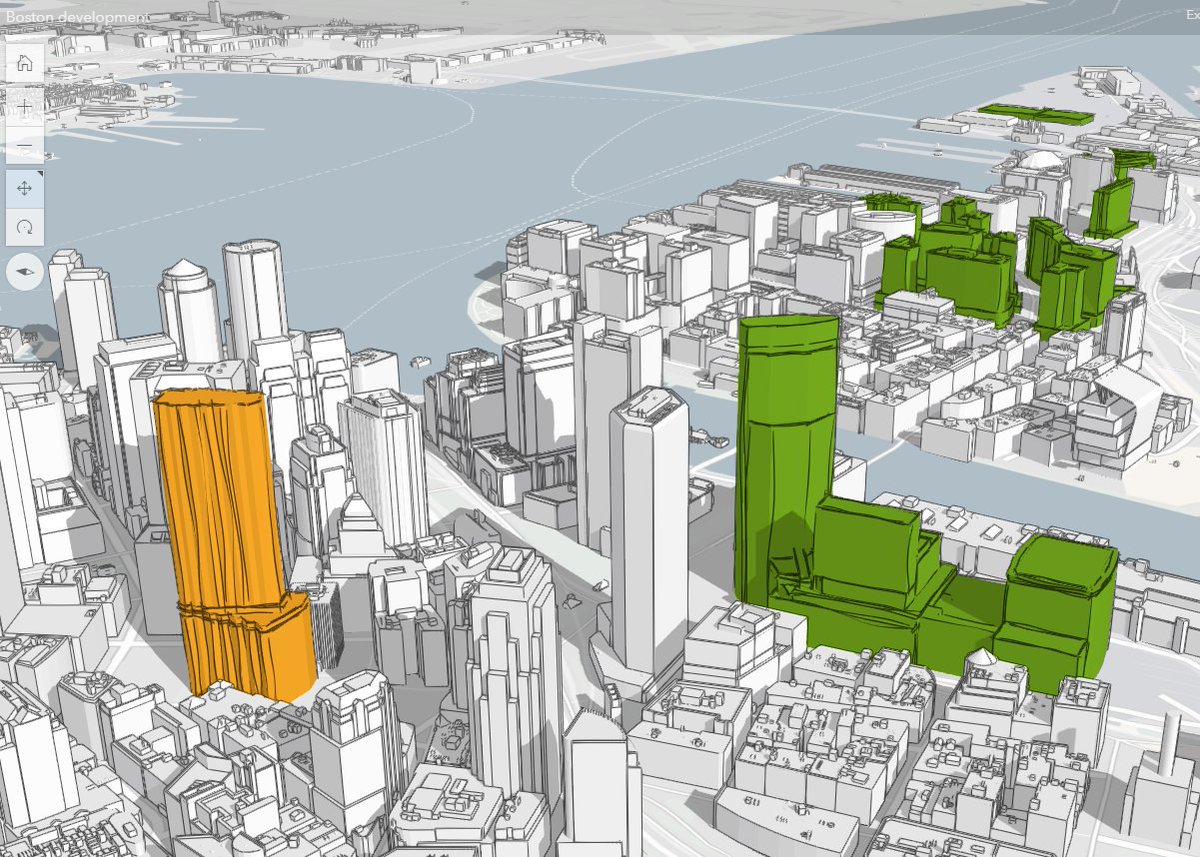
Going from a realistic 3D building visualization to an abstract one, all within JavaScript 😀 check out the code: github.com/RalucaNicola/J… or just play with the app: ralucanicola.github.io/JSAPI_demos/be… #esrijs #urbanplanning

Density of homes, colored by year they were built. At this scale 1 dot = 560 homes. Source: @LivingAtlas. App built with dot density renderer in @ArcGISJSAPI: developers.arcgis.com/javascript/lat… #esrijs #geodev #dataviz #cartography

⛰️🇨🇭I made a 3D hiking app with the hiking trails in the Swiss National Park: ralucanicola.github.io/hiking-app/ And I wrote about it too: bit.ly/2Jd4MZF. #hiking #3D #esrijs


The Esri team behind our JavaScript API can help you create compelling 2D and 3D web mapping apps with interactive user experiences and powerful data-driven visualizations: developers.arcgis.com/javascript/ #esrijs #arcgis #geodev #webdev

Nicely done 3D globe by @Vizzuality using our @ArcGISJSAPI visualizing the human impact on biodiversity. half-earthproject.org/maps/ #HalfEarth #esrijs #WebGL #JavaScript #geodev


Something went wrong.
Something went wrong.
United States Trends
- 1. #LingOrm1st_ImpactFANCON 1.08M posts
- 2. Good Saturday 16.8K posts
- 3. Talus Labs 25.1K posts
- 4. #KirbyAirRiders 2,042 posts
- 5. Frankenstein 85.2K posts
- 6. taylor york 9,453 posts
- 7. Brown Jackson 6,076 posts
- 8. #SmackDown 50K posts
- 9. Giulia 16.1K posts
- 10. #River 4,831 posts
- 11. Tulane 4,553 posts
- 12. The Supreme Court 149K posts
- 13. Aaron Gordon 5,826 posts
- 14. Pluribus 31.8K posts
- 15. Collar 17.2K posts
- 16. Justice Jackson 6,478 posts
- 17. Russ 14.6K posts
- 18. Tatis 2,319 posts
- 19. Connor Bedard 3,360 posts
- 20. #TheFutureIsTeal N/A