
Edwin Mendivil Barceló
@vizualdatos
Visualización de datos | Data Enthusiast | #DataViz | #rStats | #Tableau | Learning #P5JS | Santa Marta - Colombia 🇨🇴
You might like


Sables de Luz como gráficos, para representar datos de personajes de Star Wars... R + P5.js para hacer esta Visualización de Datos #visualizaciondedatos #p5js #diseñodeinformacion #graficopersonalizado #infografia #dataviz #datavisualization #starwars #sablesdeluz

TIL the parameter .before in mutate() from {dplyr}. It adds the new column(s) created to the *beginning* of the dataframe, instead of to the end. Quite useful! Source: #RforDataScience (2e) (sometimes you should read stuff you think you already know) #rstats

Monza Fastest Laps | A Data Art project... using motion to decode the fastest laps in F1 Monza Grand Prix. Toolkit: #p5js & #rstats #dataviz #datavisualization #datavis #informationdesign #diseñodeinformacion #dataart #codeart #visualizaciondedatos #dataartist #javascript #f1

I’ve taught hundreds of Harvard and MIT students data science in R and Python. In my experience, Python was easier for people with a decent computer science background. R was easier for everybody else.

Ahora uno tiene que andarles haciendo la publicidad


keep yourself humble. start a new game and skip the tutorial

A new blog post detailing the update on my R package {soccerAnimate} ⚽️ Focuses primarily on analyzing and visualizing - Individual player performance - Average team positioning Link in the first comment 👇


📢 It has been some time since #RStats {data.table} last major update in Feb 2021, but now it strikes back! 🚀 There are 41 new features in this release (v1.15). 👇 Below are the five features that I’m most excited about - the last one will blow your mind™! 🏃♂️ Lets’ go.


50 Sports Analytics Project Ideas: 1. Sentiment analysis based on player interviews 2. Build a sports stats website showing advanced metrics 3. Analysis on referees and their tendencies and how that impacts game outcomes 4. Automate a game report to post analysis to Twitter…

R ggplot2 color palettes inspired by Hayao Miyazaki’s animes by Joanna link.medium.com/YgRnpZ6SqGb #rstats #dataviz #ggplot2 #dataanalytics #datascience

Another #rstats {dplyr} function that I love: > transmute() You combine mutate() with select() and keep only the mutated columns. #tidyverse


Colombia proudly stands at the forefront of global avian diversity, holding the title for the highest number of bird species in the world. #Datavisualization #infographics #birdlifeinternational


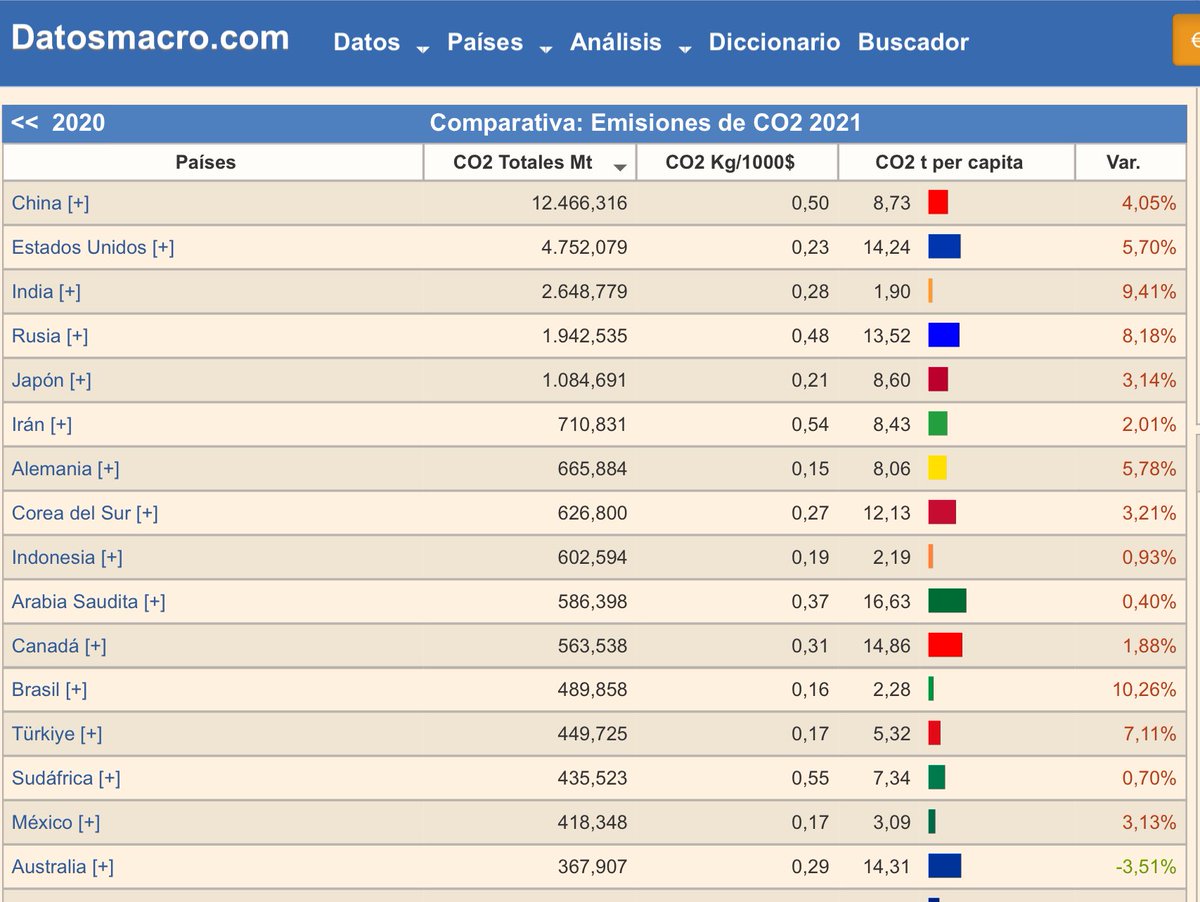
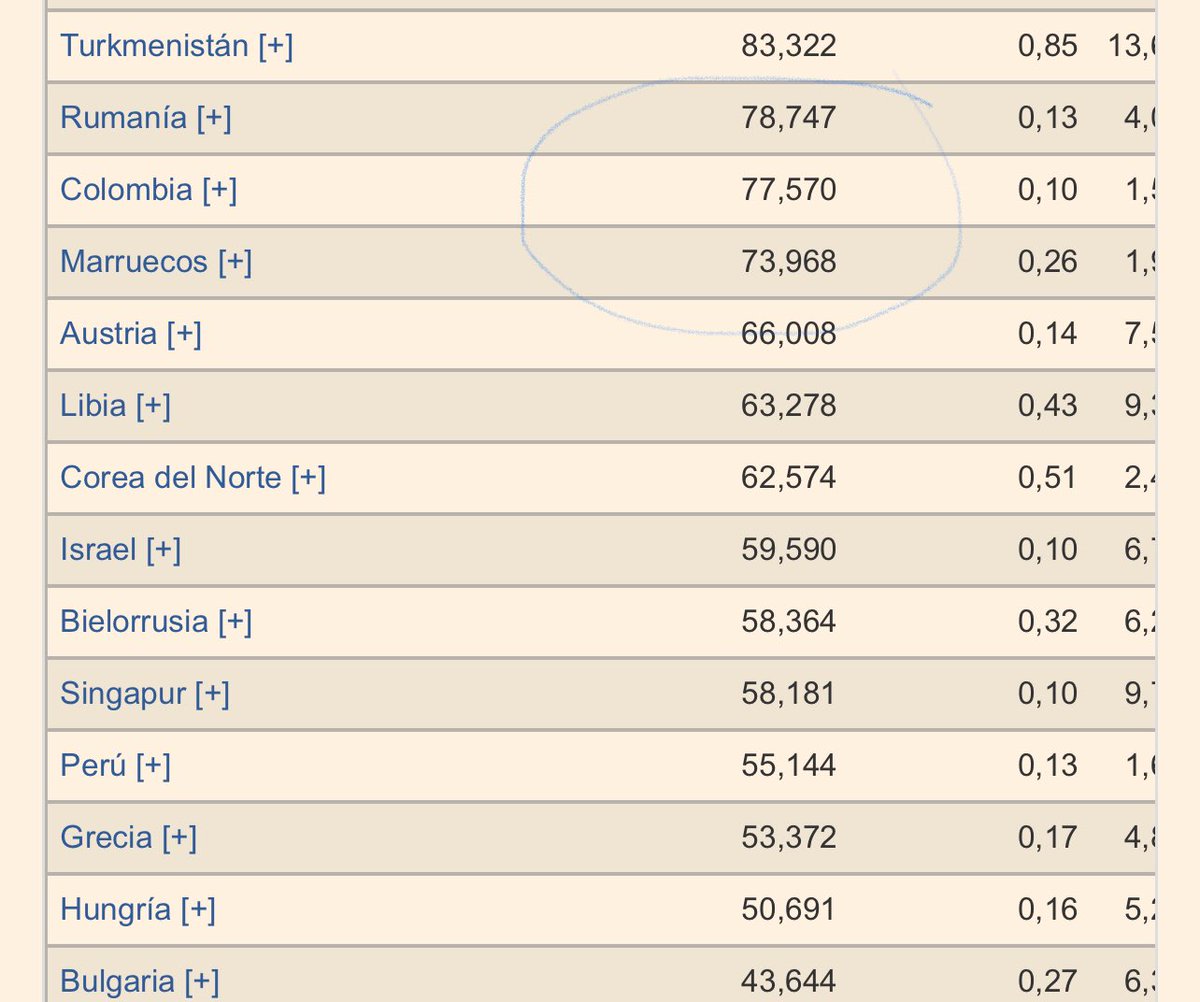
Yo todavía no entiendo porqué si Colombia 🇨🇴 emite gases efecto invernadero 162 veces menos que China 🇨🇳 o 6 veces menos que USA 🇺🇸 tengamos que sacrificar nuestro propio futuro económico haciendo una transición energética irresponsable para el empleo, las finanzas públicas, las…


El @BancoRepublica presenta las “Series estadísticas históricas de Colombia”, un nuevo producto estadístico que reúne en un solo lugar la información histórica de las principales series económicas de Colombia. #100AñosBanrep Más información 👉 ow.ly/iZQi50Q7Ygm


Spectral.js looks interesting. "Spectral.js is based on the Kubelka-Munk theory, a proven scientific model that simulates the way light interacts with paint to produce lifelike color mixing." onedayofcrypto.art


Calling all movie buffs! Tableau has collaborated with @IMDb to provide you with a dataset on thousands of movies—from box office hits to cult classics. What will you create? #DataPlusMovies tabsoft.co/3FJpkES


Exploring some new methods for creating photoviz. What do you think?

My Star Wars Colors #dataviz has been longlisted for the Information is Beautiful Awards 2023 . #IIBAwards What a great feeling, I'm so happy! Check it out here: informationisbeautifulawards.com/showcase/6273-… #datavisualization #visualizaciondedatos


Announcing the longlist for the 2023 #IIBAwards! Get inspired by over 800 entries in our showcase created by the global #dataviz community! informationisbeautifulawards.com/showcase?award…


UNHCR has created the refugees R package, a free statistical software which provides data on forcibly displaced populations. Kudos to our very own Hisham Galal and Ahmadou Dicko, who have developed this package! unhcr.org/refugee-statis…


United States Trends
- 1. Kevin James 5,623 posts
- 2. Bubba 35.8K posts
- 3. Bill Clinton 126K posts
- 4. Jack Hughes 2,290 posts
- 5. Metroid 12.4K posts
- 6. #BravoCon 5,588 posts
- 7. RIP Coach Beam 1,265 posts
- 8. Marlene 5,138 posts
- 9. $EDEL 1,131 posts
- 10. Vatican 15.9K posts
- 11. Last Chance U 5,792 posts
- 12. Matt Taylor 3,054 posts
- 13. $GOOGL 20.2K posts
- 14. Wale 45.9K posts
- 15. Donica Lewinsky 2,606 posts
- 16. Oakland 11.6K posts
- 17. Crooks 79.3K posts
- 18. Samus 6,491 posts
- 19. Hunter Biden 23.2K posts
- 20. Freddie Mercury 1,363 posts
You might like
-
 Kyle Barron kylebarron.dev on bsky
@kylebarron2 -
 Robin Lovelace
@robinlovelace -
 Britton Staniar
@BrittTweets -
 🏁 Rob Hu$$le 🏁
@mystcrich -
 Adrian Zinovei
@AdrianZinovei -
 Nathalie Richer
@NatRchr -
 Rafael H. M. Pereira 🚡 Urban Demographics
@UrbanDemog -
 Will Perkins
@_gringuinho_ -
 Fabian Camilo Peña
@fabiancpl -
 Pixalytics
@pixalytics -
 Shammu
@shelovescityfc
Something went wrong.
Something went wrong.