#dataviz نتائج البحث

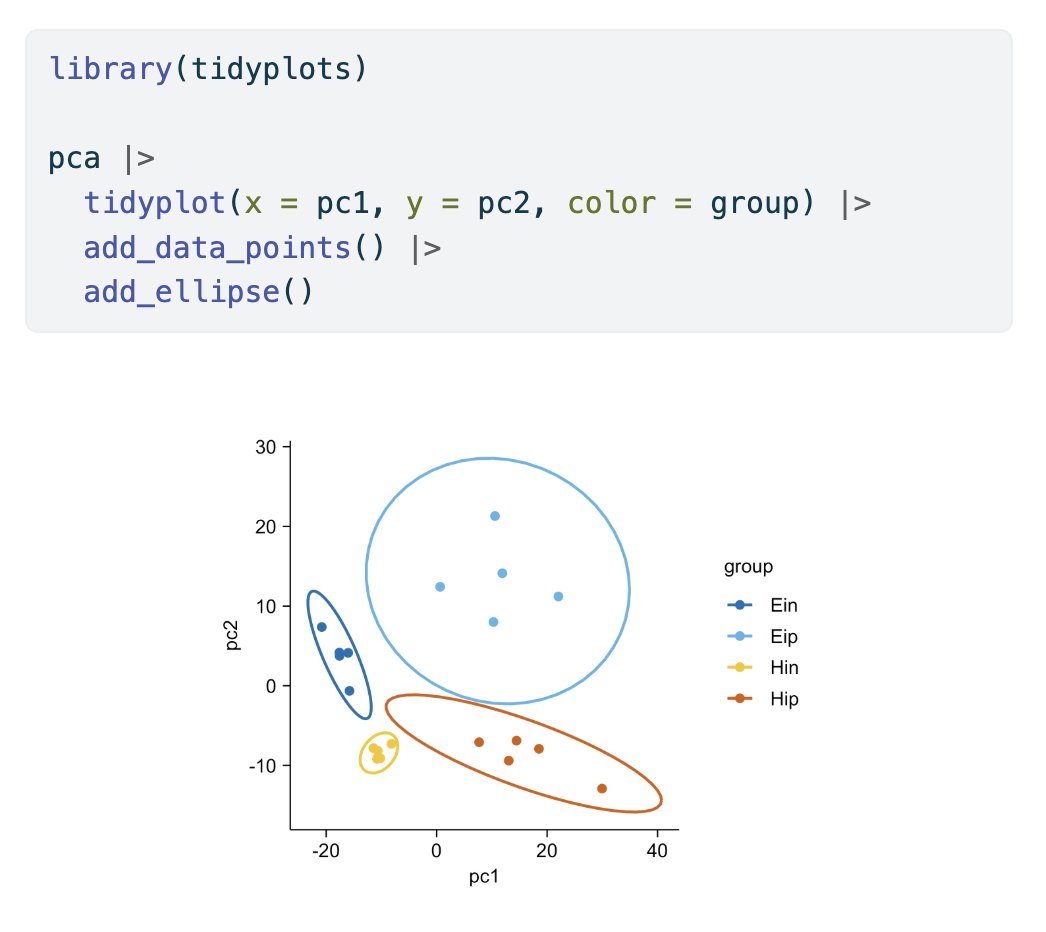
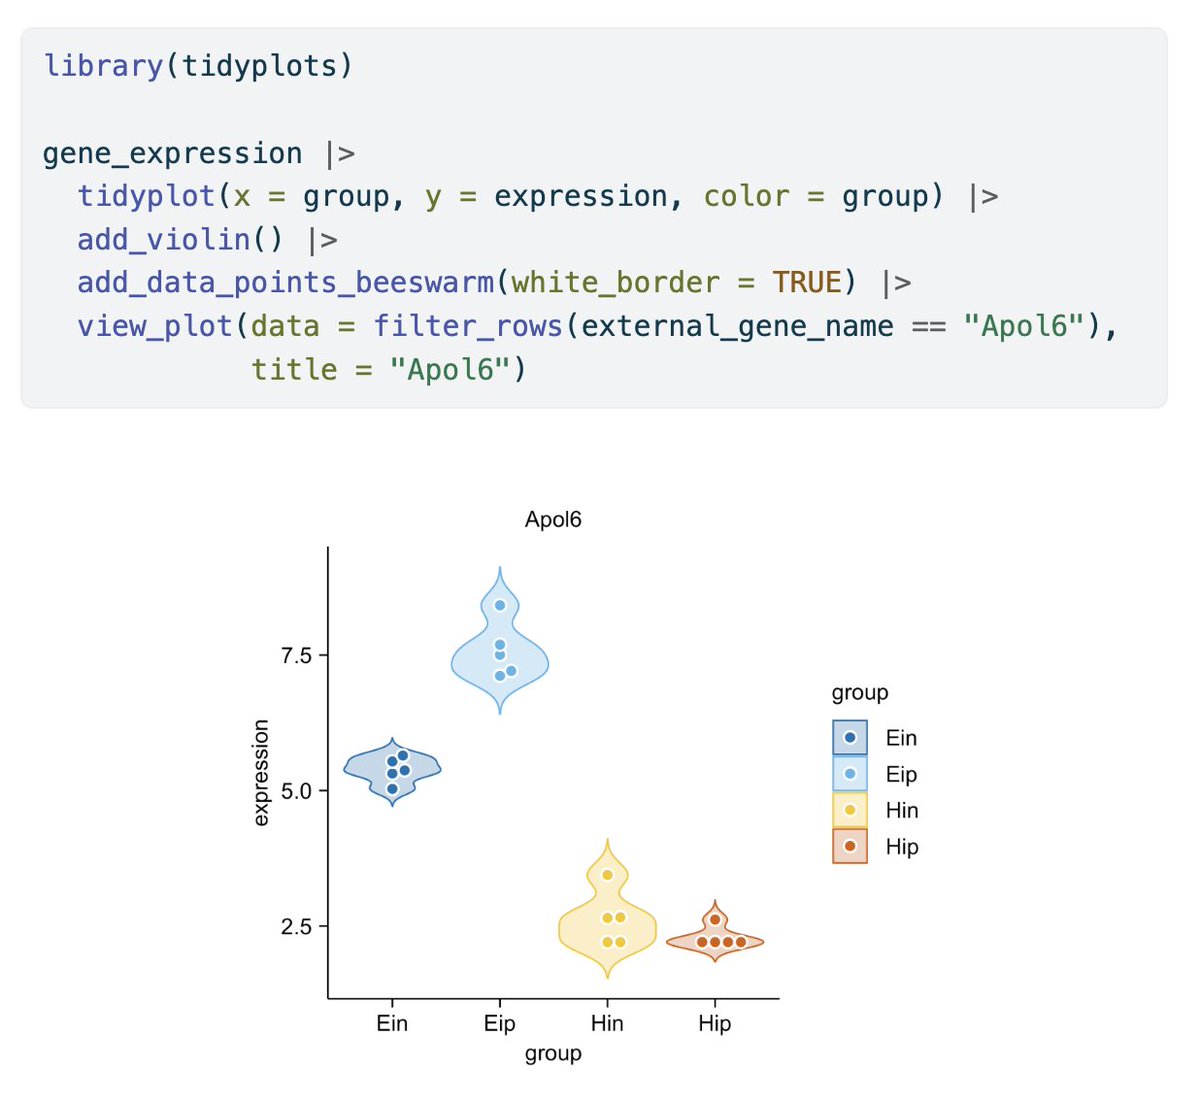
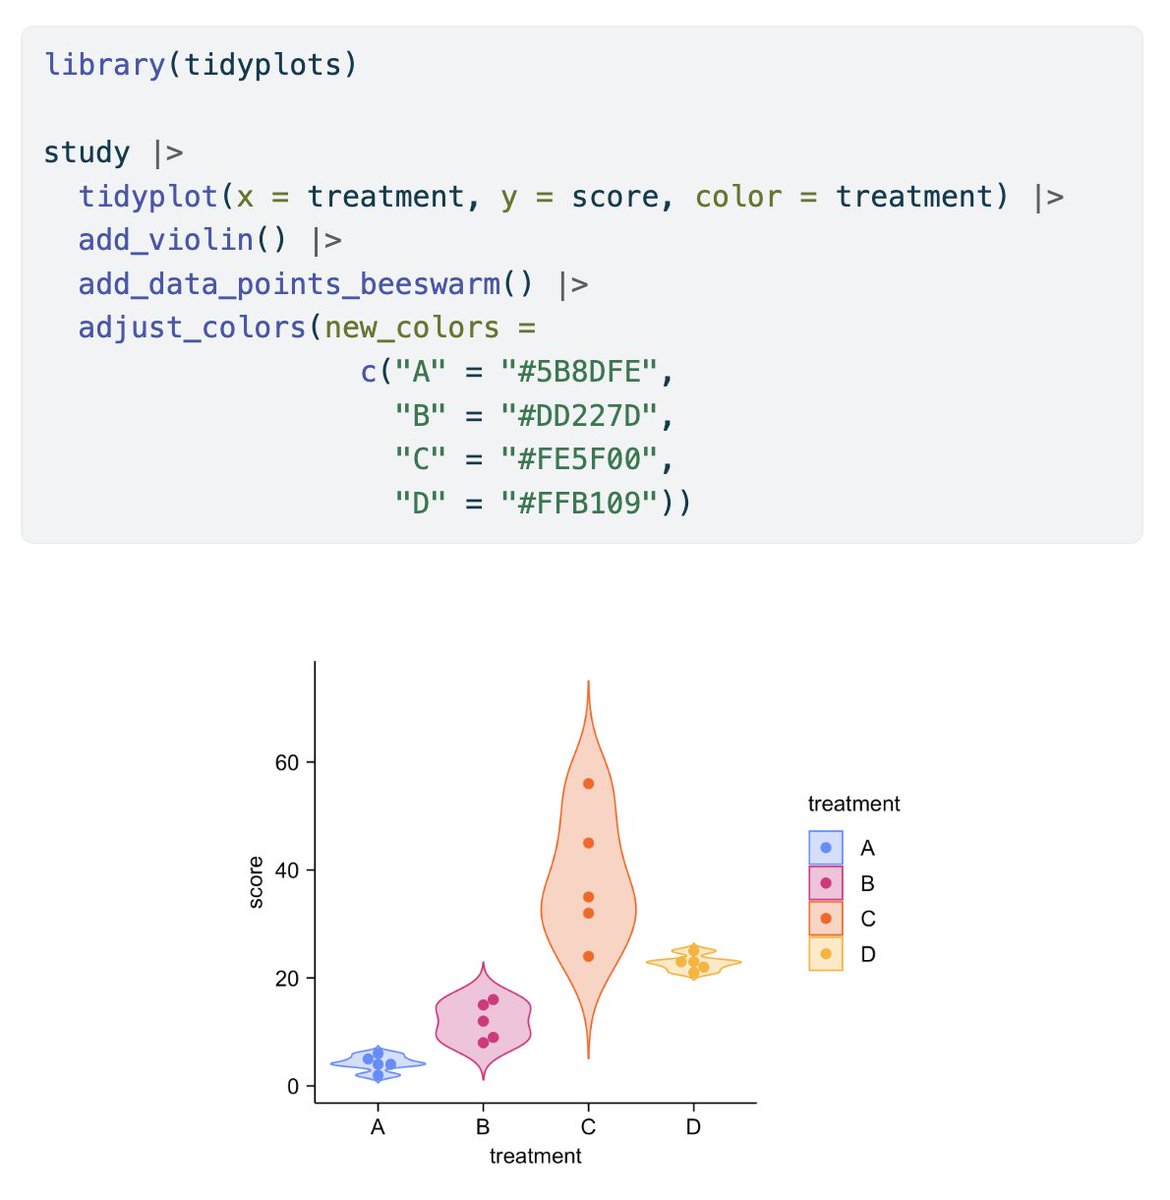
Here are some #tidyplots use cases for bioinformatics 🔥 Complete with data and code 🚀 tidyplots.org/use-cases/#bio… #rstats #dataviz #phd


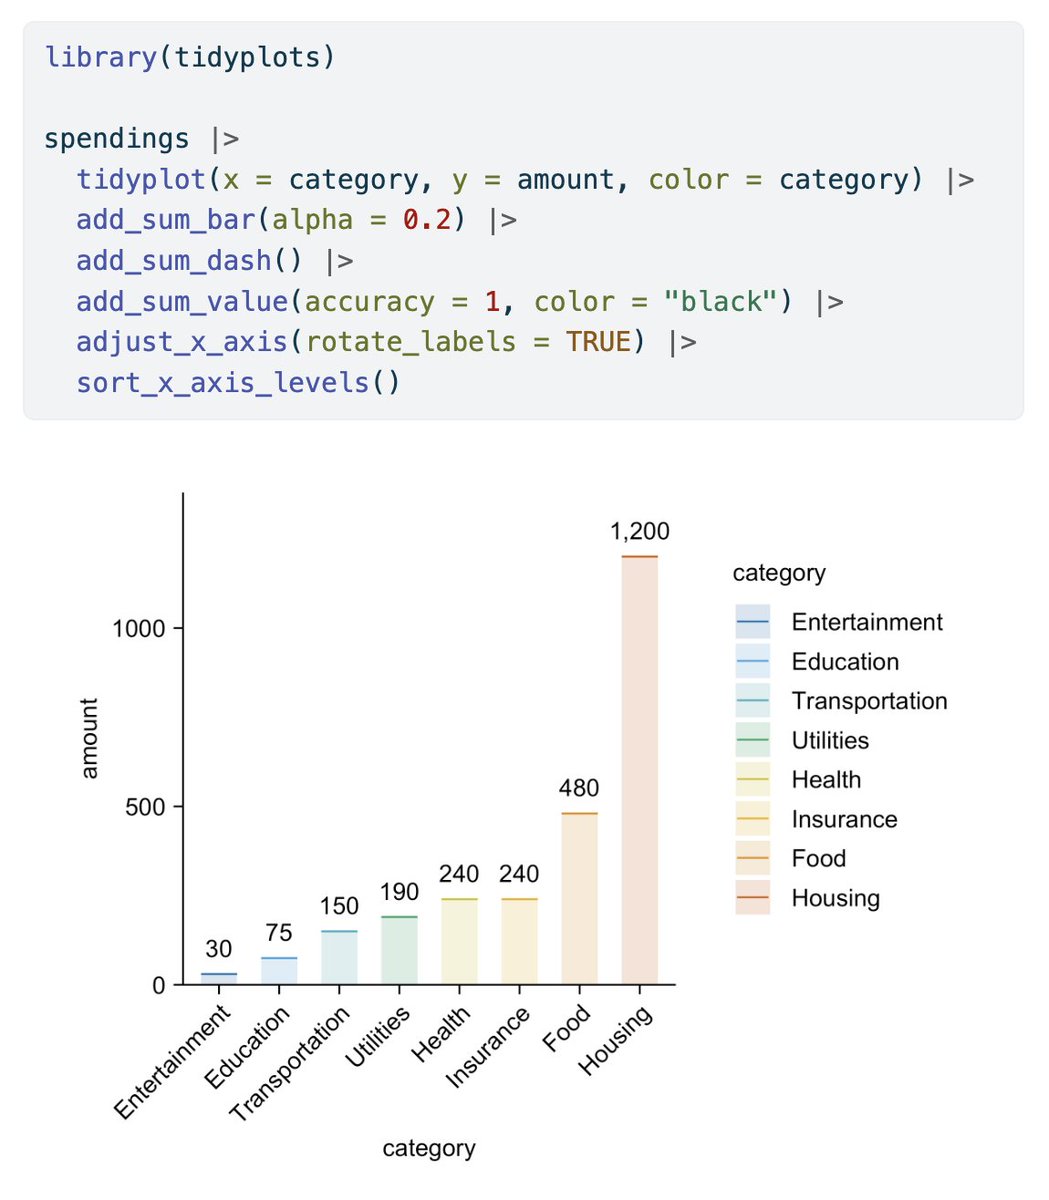
Here are some #tidyplots use cases for data journalism 🔥 Complete with data and code 🚀 tidyplots.org/use-cases/#dat… #rstats #dataviz #phd


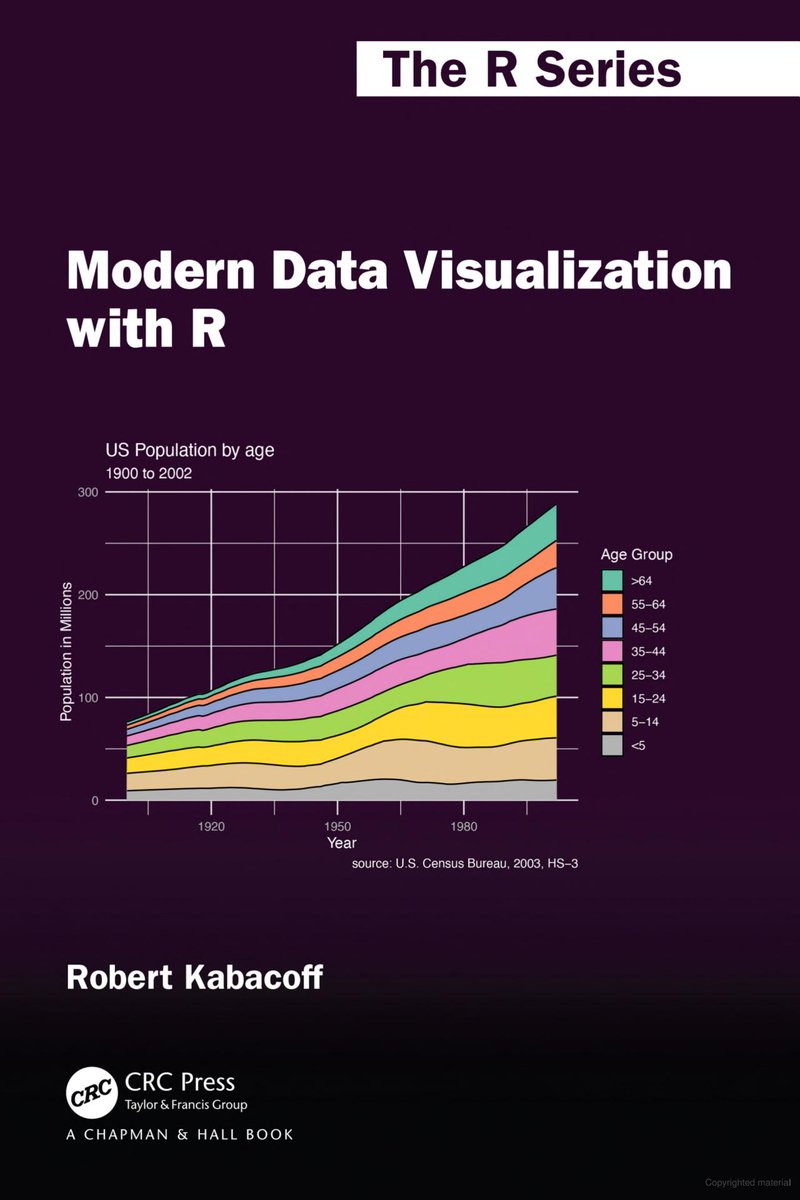
Data visualization is not merely about creating pretty charts and graphs; it’s about distilling complex information into clear, concise visuals that facilitate understanding and decision-making. pyoflife.com/modern-data-vi… #rstats #DataScientists #dataviz #statisticalanalysis


It's brilliant visualization of how an artificial neural network recognizes handwritten digits. it processes layer by layer to make a prediction. Absolutely mesmerizing. 🤖 #AI #MachineLearning #DataViz #DeepLearning

The New York Times' classic #dataviz made in *Flash* are back online - thanks to some kind of tech magic. Via @flowingdata flowingdata.com/2024/01/10/nyt…


This is a beautiful, extraordinarily well published book: "Better Data Visualizations" by @jschwabish 🌟🌟🌟🌟🌟 See all his books: amzn.to/48VYd5s ———— #DataViz #BI #DataStorytelling #Statistics #VisualAnalytics #DataScience #DataScientist #BeDataBrilliant #DataFluency


The most powerful models in neuroscience still only account for ~50% of the variance in cognitive complexity. The other half isn't just noise. It's the mathematical signature of a missing physical law. #neuroscience #dataviz #consciousness
@EssentiaFounda1 The most powerful models in neuroscience still only account for ~50% of the variance in cognitive complexity. The other half isn't just noise. It's the mathematical signature of a missing physical law. #neuroscience #dataviz #consciousness

🎯 لمحبّي Power BI شو أكتر نوع Visualization بتحبه؟ 📊 Column 📈 Line 🍩 Donut 📉 غيره؟ ليش تفضله؟ 👇 🚀 دورة Power BI 🗓️ الأحد 19 أكتوبر 2025 ⏰ 6–9 مساءً | 💻 أونلاين 📩 [email protected] #PowerBI #Excel4Us #DataViz #DashboardDesign

A History of #DataViz;After examining the history of #data #visualization greats I decided to collect my learnings in the style of history’s data #visualization greats. The first of these visual summaries is presented and 7wdata.be/human-computer… #7wData #DataStrategy

The most powerful models in neuroscience still only account for ~50% of the variance in cognitive complexity. The other half isn't just noise. It's the mathematical signature of a missing physical law. #neuroscience #dataviz #consciousness
@elonmusk The most powerful models in neuroscience still only account for ~50% of the variance in cognitive complexity. The other half isn't just noise. It's the mathematical signature of a missing physical law.? #neuroscience #dataviz #Consciousness
The most powerful models in neuroscience still only account for ~50% of the variance in cognitive complexity. The other half isn't just noise. It's the mathematical signature of a missing physical law. #neuroscience #dataviz #Consciousness

Ever wondered where your favorite cheese comes from? Our new Interactive Cheese Explorer lets you travel the world of cheese from your screen! Filter by country, milk, and texture. Dive in: adathakkar.com/interactive-ch… #Cheese #DataViz #Foodie #Interactive #CheeseLover #WorldCuisine


🚀 @nitrograph is redefining the future of data visualization where AI meets design precision. Transform raw data into visual stories that speak for themselves. #AI #DataViz #Innovation


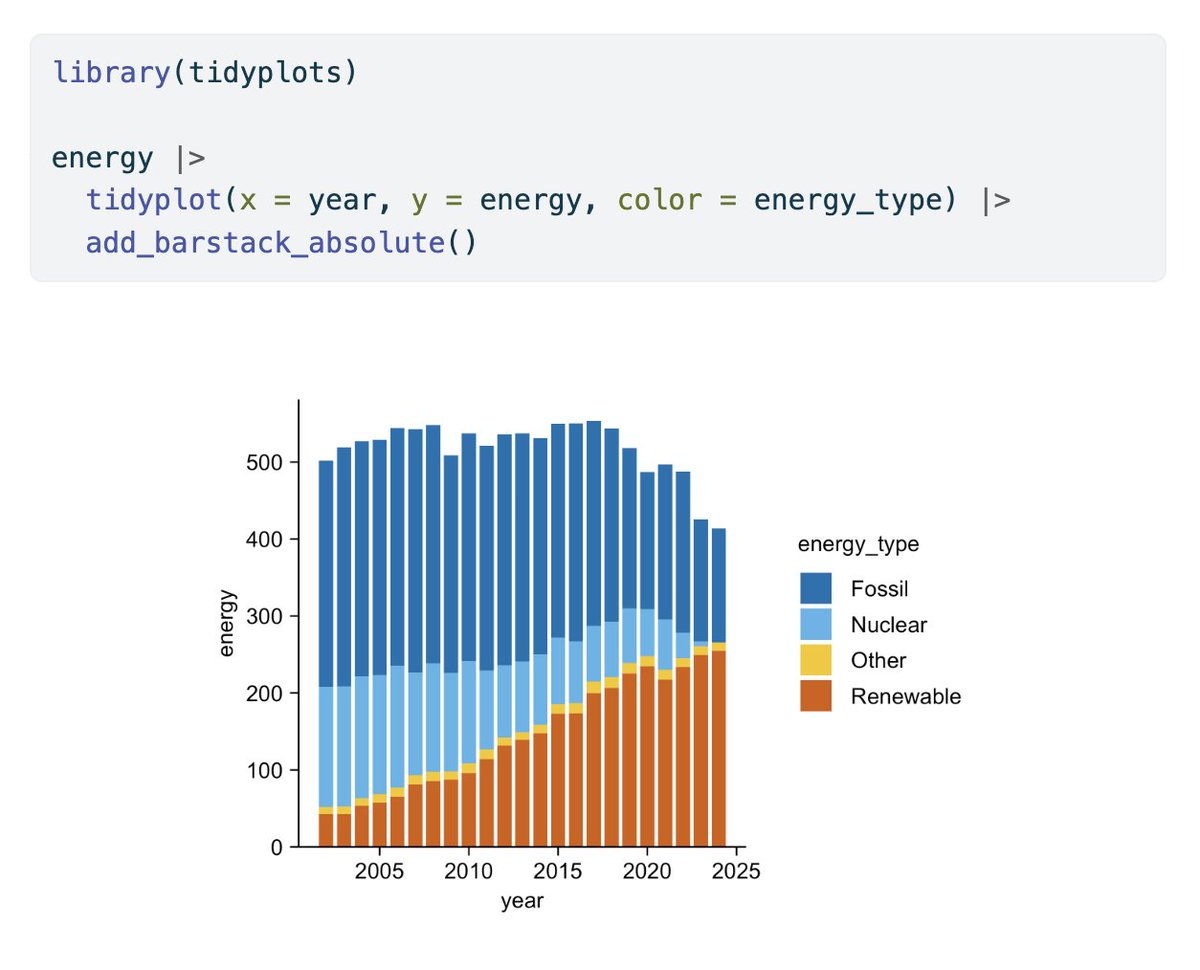
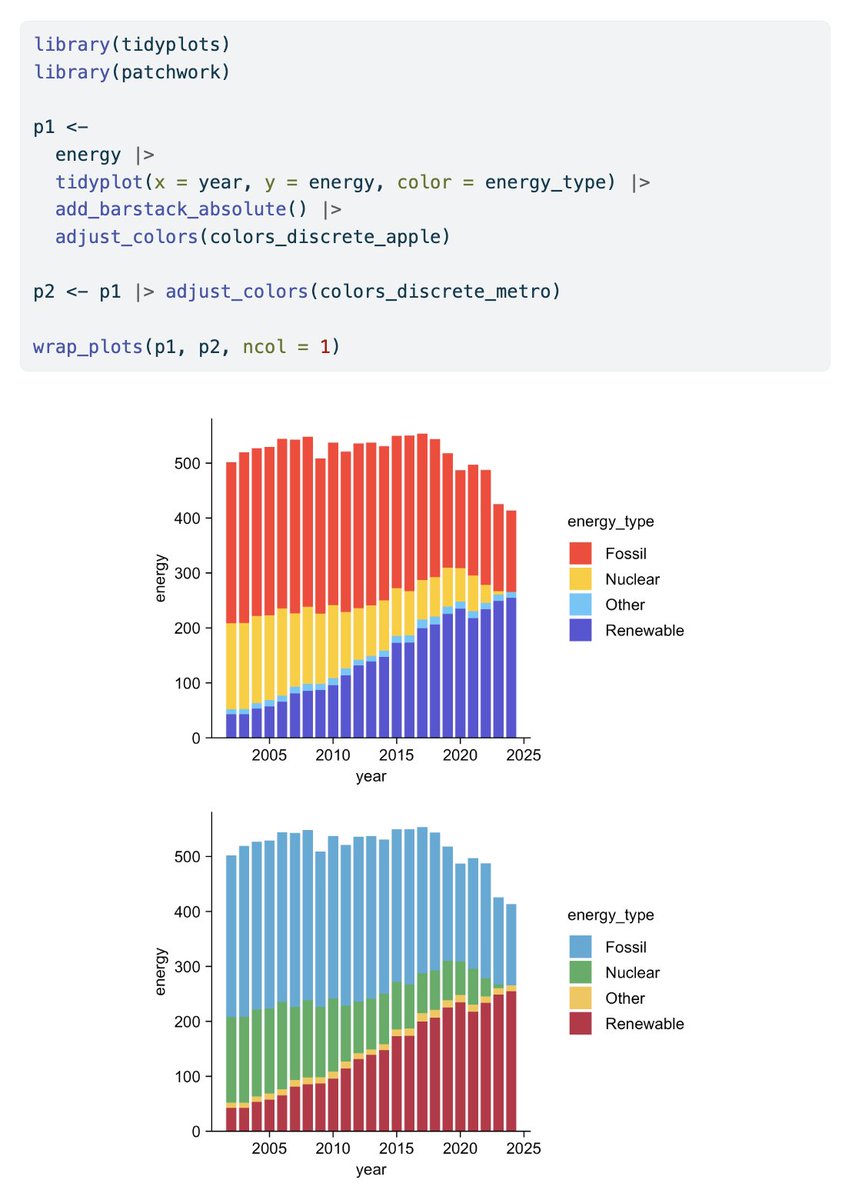
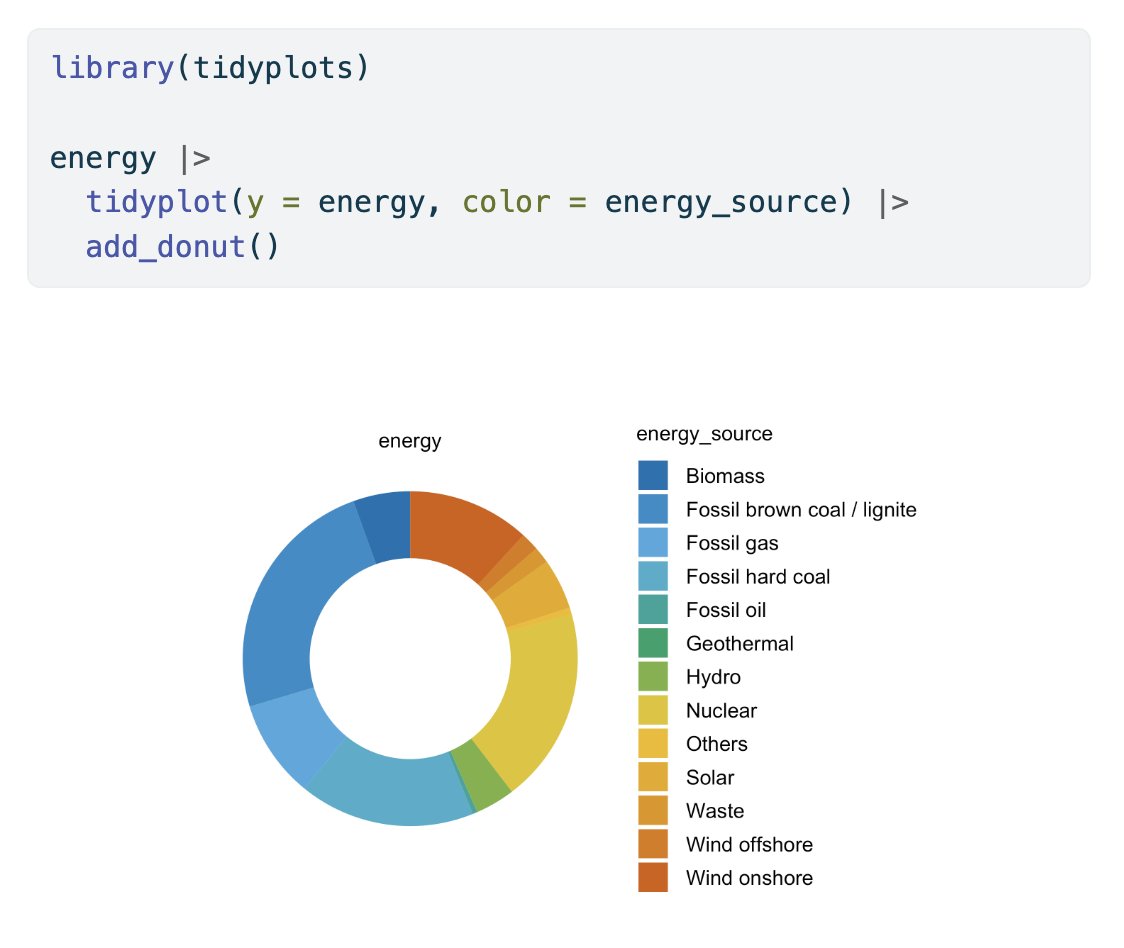
Here are some #tidyplots use cases for proportional data 🔥 Complete with data and code 🚀 tidyplots.org/use-cases/#pro… #rstats #dataviz #phd

Here are some #tidyplots use cases for bioinformatics 🔥 Complete with data and code 🚀 tidyplots.org/use-cases/#bio… #rstats #dataviz #phd


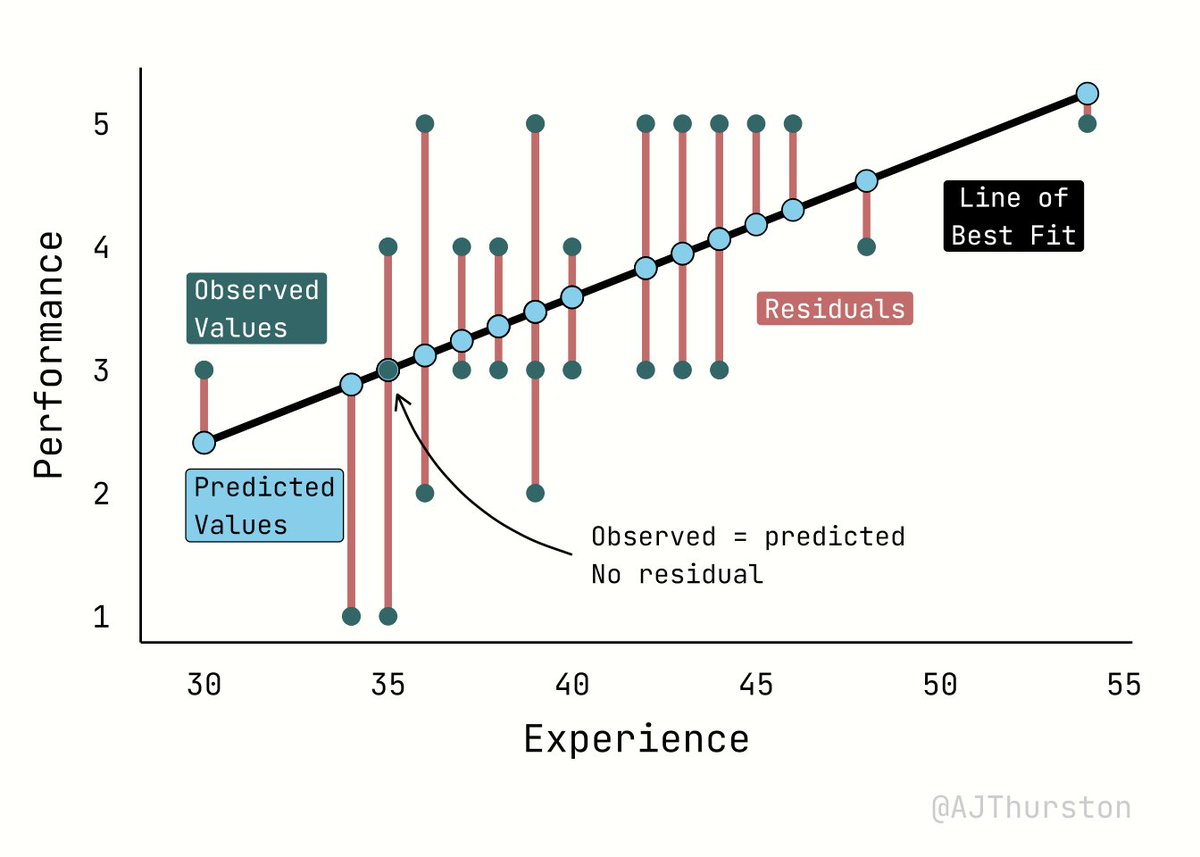
Here are some #tidyplots use cases for data journalism 🔥 Complete with data and code 🚀 tidyplots.org/use-cases/#dat… #rstats #dataviz #phd

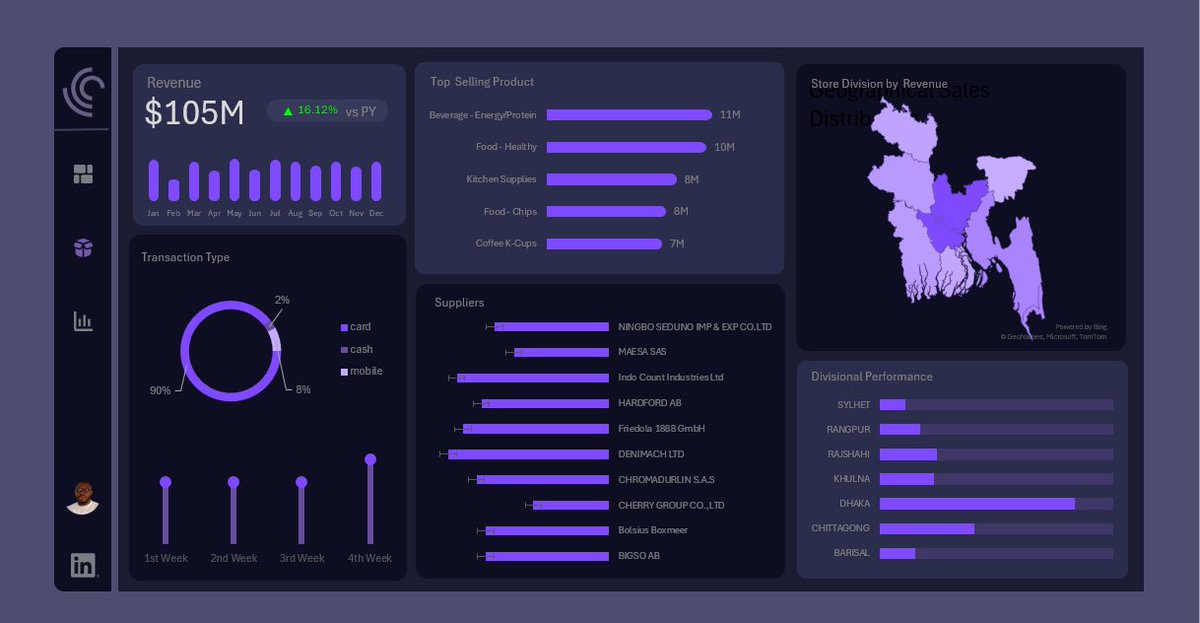
Just recreated My Excel E-Commerce Sales Dashboard in Power BI 👀 I wanted something simple but different from the original design so I went with something light 🤍💙 What do you think ? Excel or Power BI ? #powerbi #dashboard #dataviz


Data visualization is not merely about creating pretty charts and graphs; it’s about distilling complex information into clear, concise visuals that facilitate understanding and decision-making. pyoflife.com/modern-data-vi… #rstats #DataScientists #dataviz #statisticalanalysis

📦 E-commerce Dashboard Project – Final Result! Used Power Query → Power Pivot → Pivot Tables → DAX The final output is clean & insight-packed. What do you think ? New week let’s get it 🫶❤️ #Excel #DAX #DataViz #Analytics


The New York Times' classic #dataviz made in *Flash* are back online - thanks to some kind of tech magic. Via @flowingdata flowingdata.com/2024/01/10/nyt…
Something went wrong.
Something went wrong.
United States Trends
- 1. Jets 99.5K posts
- 2. Jets 99.5K posts
- 3. Justin Fields 18.4K posts
- 4. Aaron Glenn 7,579 posts
- 5. George Pickens 2,089 posts
- 6. London 206K posts
- 7. Sean Payton 3,471 posts
- 8. Tyler Warren 1,794 posts
- 9. Jerry Jeudy N/A
- 10. Garrett Wilson 4,527 posts
- 11. #Pandu N/A
- 12. Bo Nix 4,598 posts
- 13. #HardRockBet 3,608 posts
- 14. Tyrod 2,547 posts
- 15. Steelers 23K posts
- 16. Karty 1,333 posts
- 17. HAPPY BIRTHDAY JIMIN 195K posts
- 18. #HereWeGo 1,986 posts
- 19. #DENvsNYJ 2,577 posts
- 20. #JetUp 2,562 posts