#scatterplot 搜尋結果


Litton with highest T20I strikerate, Hridoy with highest T20I average for Bangladesh who have batted at least 50 innings #Scatterplot #BDcricket #LKD #LittonKumerDas #TawhidHridoy


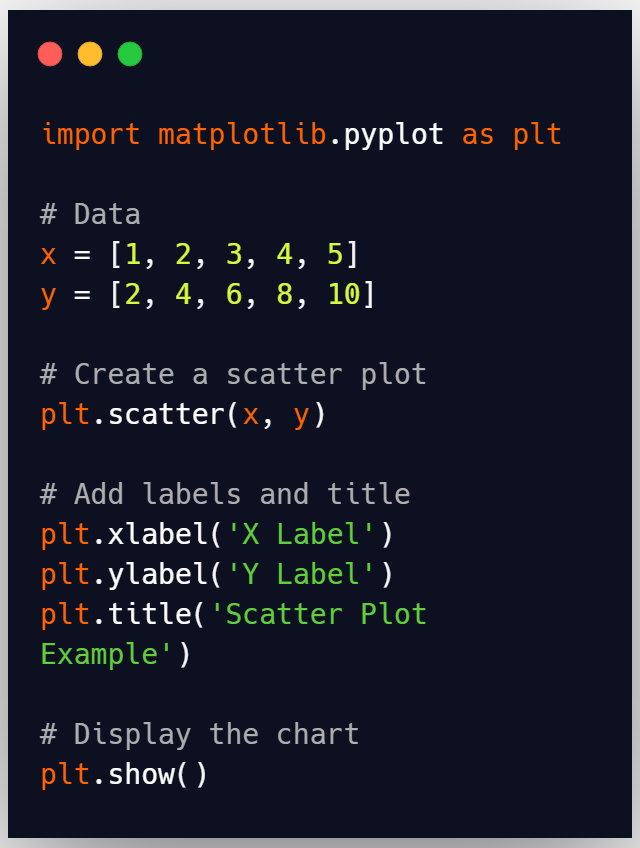
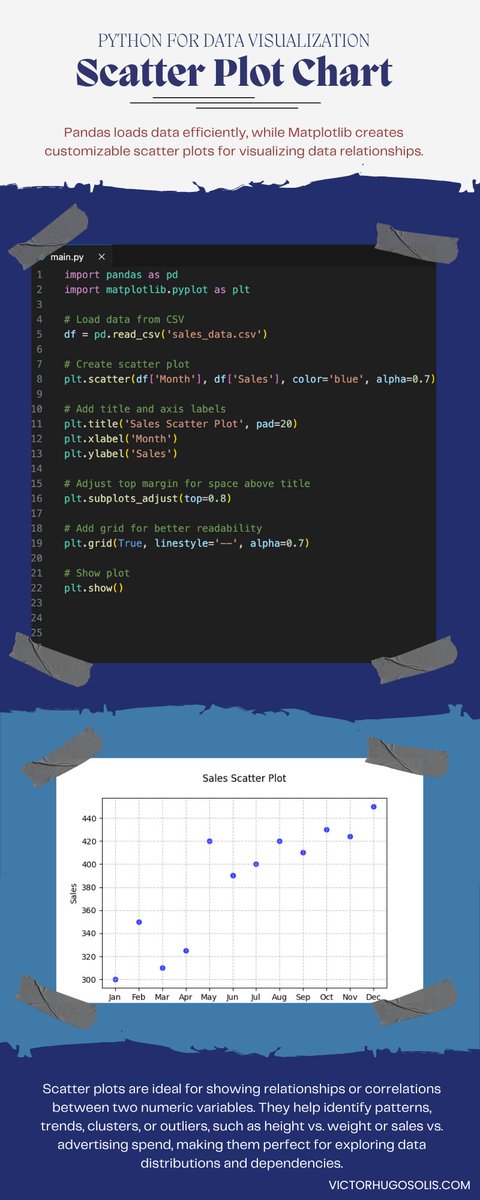
4/6: Need to create a #scatterplot? No problem! Here's the code. 🪀🐍 #datavisualization #python #matplotlib

Make a quick and easy #Scatterplot in #Excel chroniclesofdata.com/scatter-plot-i…


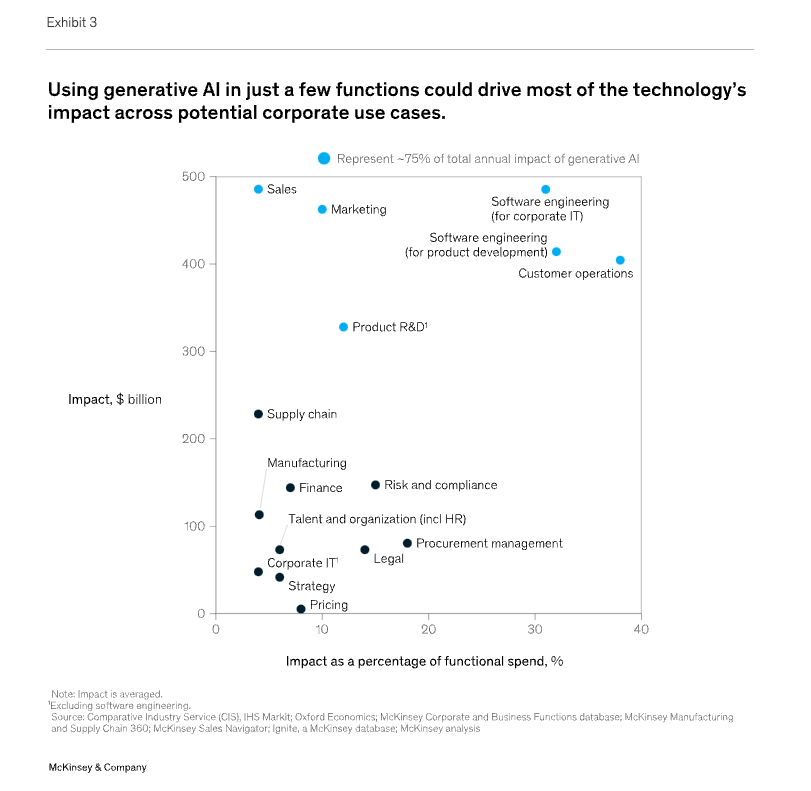
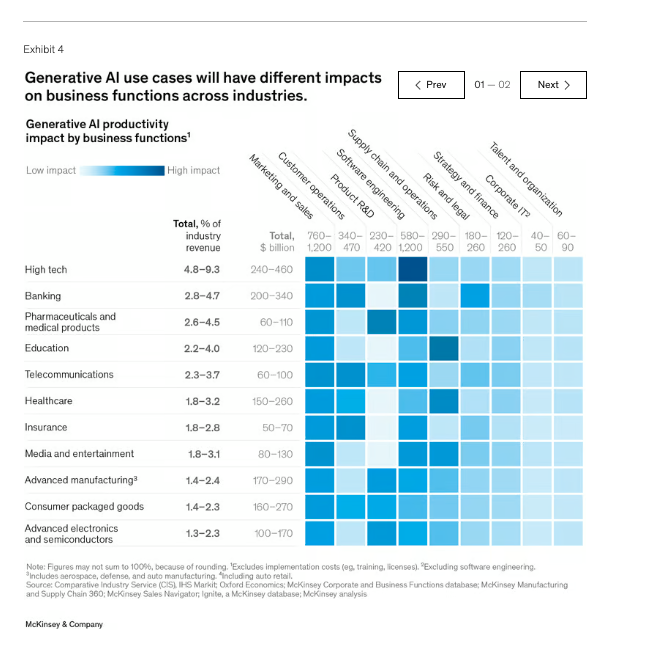
/2 ...McKinsey's "The Economic Potential of Generative AI" (cont'd): • identified 16 new LLM use cases across 850 occupations • charted dollar value impact vs share of functional spend by sector/industry/use case #scatterplot #matrix

How to get cluster point in a scatter plot in R studio? stackoverflow.com/questions/7545… #rstudio #scatterplot #plot

Beginner data analyst? Python lover? 🐍 Learn to connect the dots with our fun Scatter Plot infographic! 📈 💡 When to use them 💻 How to build them in Python 😬 What mistakes to avoid #DataViz #ScatterPlot #Python #DataScience #AnalyticsForBeginners
Make a quick and easy #Scatterplot in #Excel chroniclesofdata.com/scatter-plot-i…
Make a quick and easy #Scatterplot in #Excel chroniclesofdata.com/scatter-plot-i…

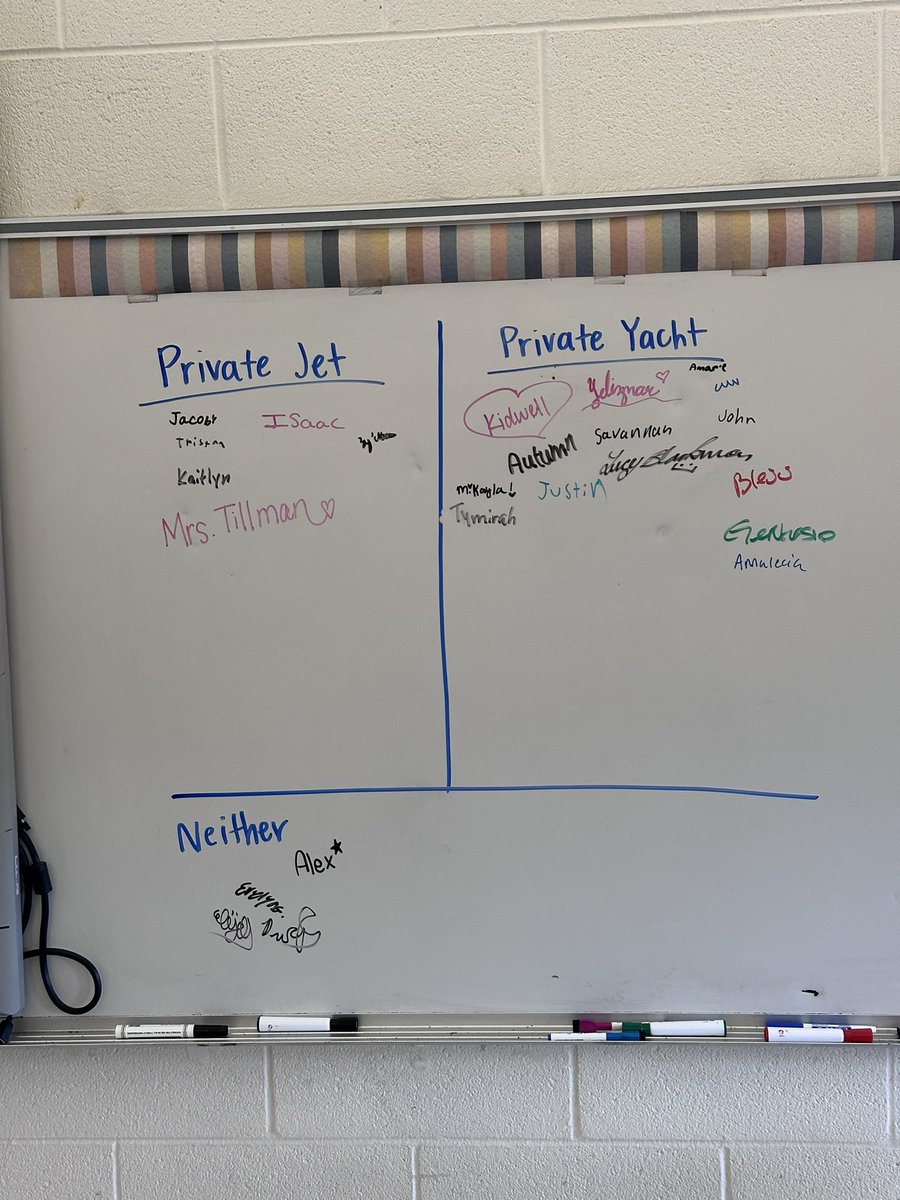
I love when I go into a classroom and I can immediately grasp the content as if I am a student. Our BT Ms. Kidwell is amazing!! #scatterplot #8thgrademath #proudpirate


STAR for Analysts: Ace Your Next Interview (Data Mastery Series) 🛒a.co/d/6rTo1Ui #️⃣ #DataVisualization #ScatterPlot #Correlations #Analytics #DataInsights

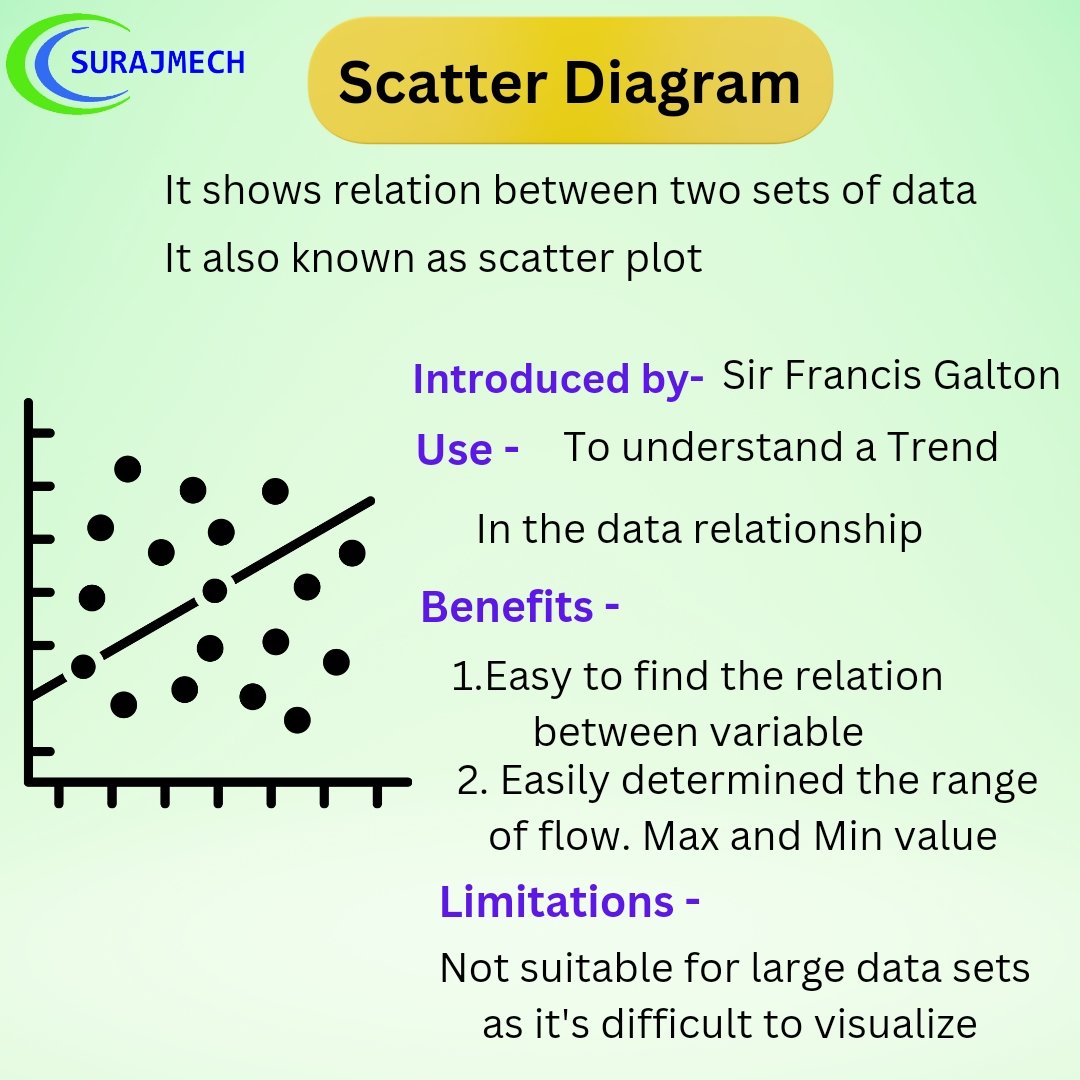
Scatterplots are great for showing the relationship between two variables. They're especially useful for identifying trends and outliers in the data. #scatterplot #dataviz


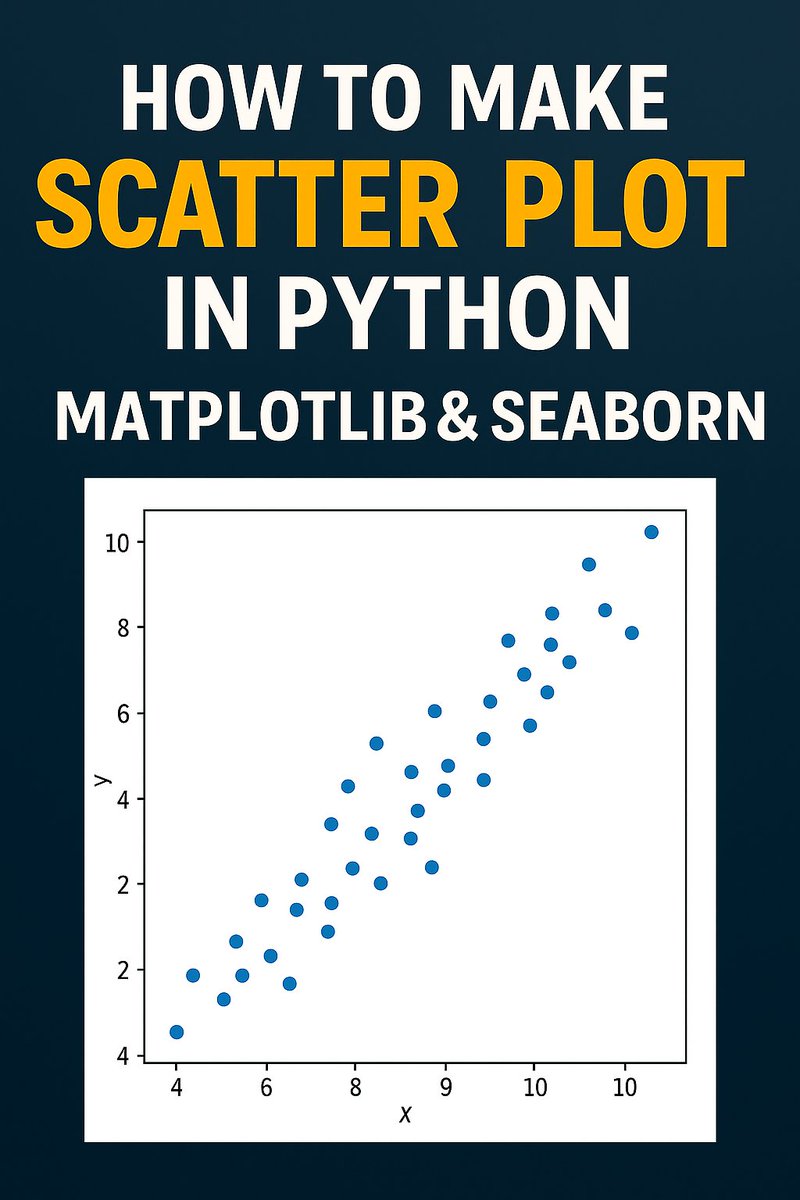
How to Make Scatter Plot in Python | Matplotlib & Seaborn Tutorial|Python course 2025 youtu.be/OEVR6YJFF2c #Dataanalysis #python #scatterplot #seaborn


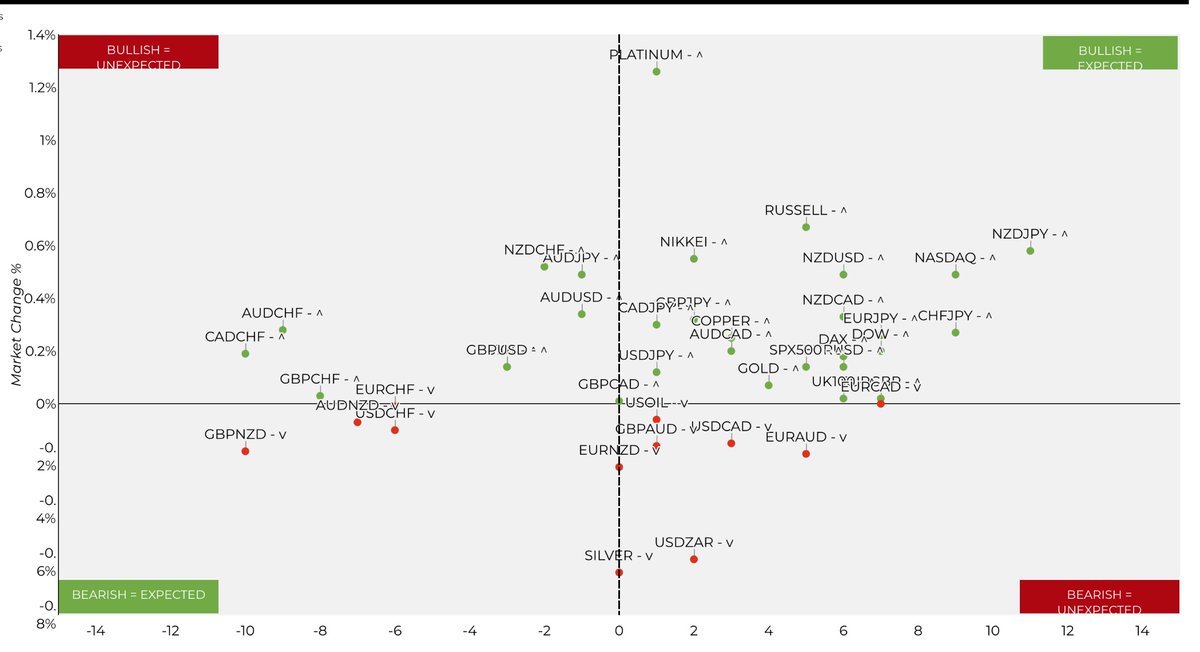
4) a lot of these charts start to become different ways of skinning the same cat, particularly the scatter plots - don't think they're all necessary and can be slimmed down. better use of time might be another example entirely. what about looking at event vol of some kind?


Where does the data used to create the scatter plot come from? Is it stats?

I will post daily scatter plots using literal random columns in data sets until my demands are met.


seen this scatterplot too many times. Only predictive at 5-10y time scale. For short-term, its better to change the X-axis to "Yield minus risk-free".


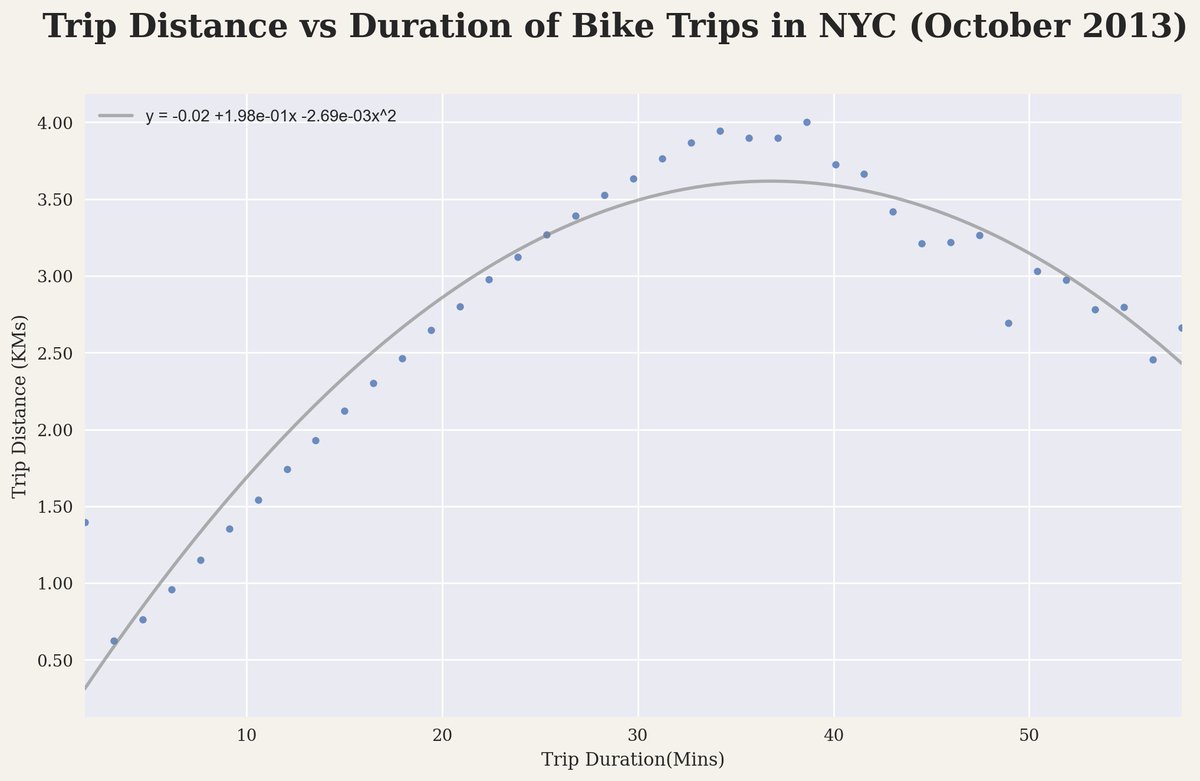
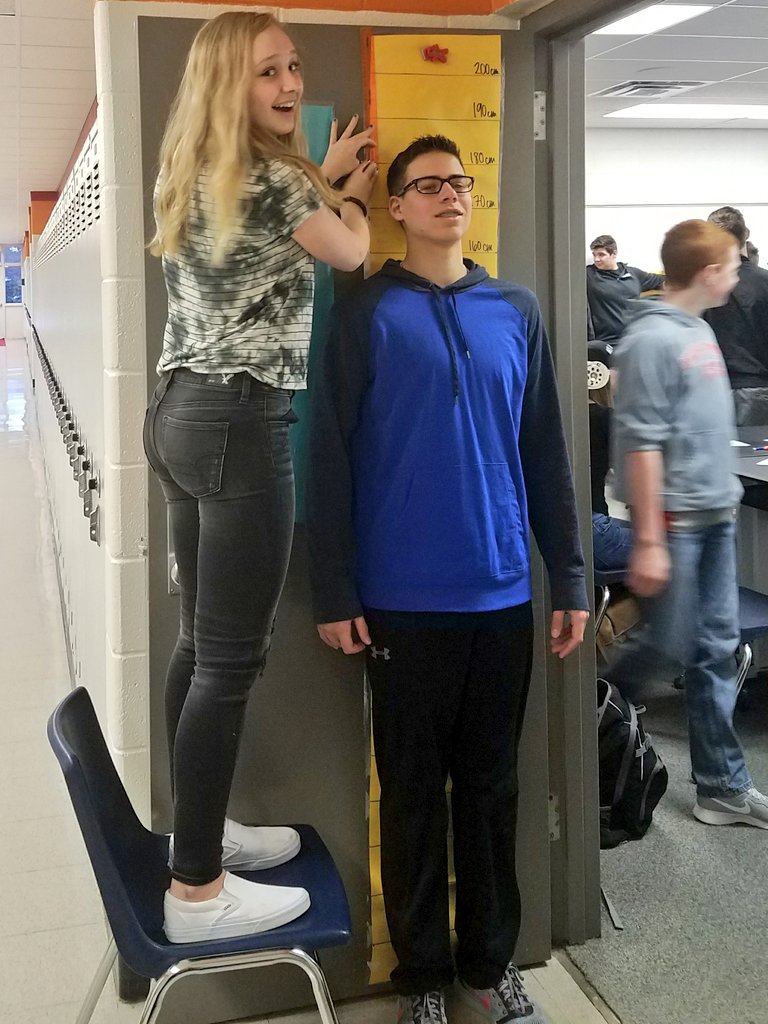
Passing a container around a circle and timing it to gather data for a scatterplot! The conclusion: the more people you have, the longer it takes to get around the circle. Positive trend! #robinsonisd #robinsonjuniorhigh


There's also a third group of people whose scatter plots look like this, and defend their papers with the argument that just because correlation is low, it doesn't mean there's no causation, lol.


Plottable Mess, a new interesting behavior #javascript #plotterart #plottertwitter #generativeart #genart #digitalart #abstractart #graphicart #nftart


I’d rather off myself than publish a scatter plot as sad as figure 4 with my name on it


I made a new scatter plot for J. I hope this helps him.

Guess you people really like scatter plots huh.
Non-binding postal survey but curious what people would be most interested in a newsletter on:
Litton with highest T20I strikerate, Hridoy with highest T20I average for Bangladesh who have batted at least 50 innings #Scatterplot #BDcricket #LKD #LittonKumerDas #TawhidHridoy


outcome variability, that's the sneaky demon in every scatter plot. makes you chase ghosts sometimes.

My favorite part of psychology are scatter plots... Like Uuuuu look at these dots, these are a kin to eldritch horrors


Finding the standard deviation/error of a scatter plot stackoverflow.com/questions/6707… #numpy #python #scatterplot #matplotlib

Seaborn Jointplot add colors for each class stackoverflow.com/questions/5121… #python #scatterplot #seaborn #matplotlib
How do I plot a list of tuples using matplotlib? stackoverflow.com/questions/6914… #python #matplotlib #scatterplot

Sabre math learning about scatter plots by doing their own investigation with @SpeedStacksInc #teaching #speedstacking #scatterplot #math @LEADUWindsor @Sandwich_Sabres

"x and y must be the same size" issues in python, histogram graph and scatter stackoverflow.com/questions/6884… #matplotlib #scatterplot #histogram #graphics #python

Scatter plotting text clustering results stackoverflow.com/questions/7178… #python #scatterplot #pandas #word2vec #dictionary
R does not assign colors to plot() function stackoverflow.com/questions/6685… #r #scatterplot #colors
Option "symbol" in scattermapbox is not working stackoverflow.com/questions/5962… #scatterplot #googlemaps #python
Why is geom_smooth not showing in ggplotly? stackoverflow.com/questions/7178… #ggplotly #graph #scatterplot #ggplot2 #r


You paid what? How much do you pay for shoes and how much actually goes back to the person who made them? #circlegraphs #scatterplot #tinkerplots #mathisfun


How to get cluster point in a scatter plot in R studio? stackoverflow.com/questions/7545… #rstudio #scatterplot #plot
How can i make a scatterplot using only the five most frequent values from a column using seaborn? stackoverflow.com/questions/7213… #seaborn #scatterplot #python

I love when I go into a classroom and I can immediately grasp the content as if I am a student. Our BT Ms. Kidwell is amazing!! #scatterplot #8thgrademath #proudpirate

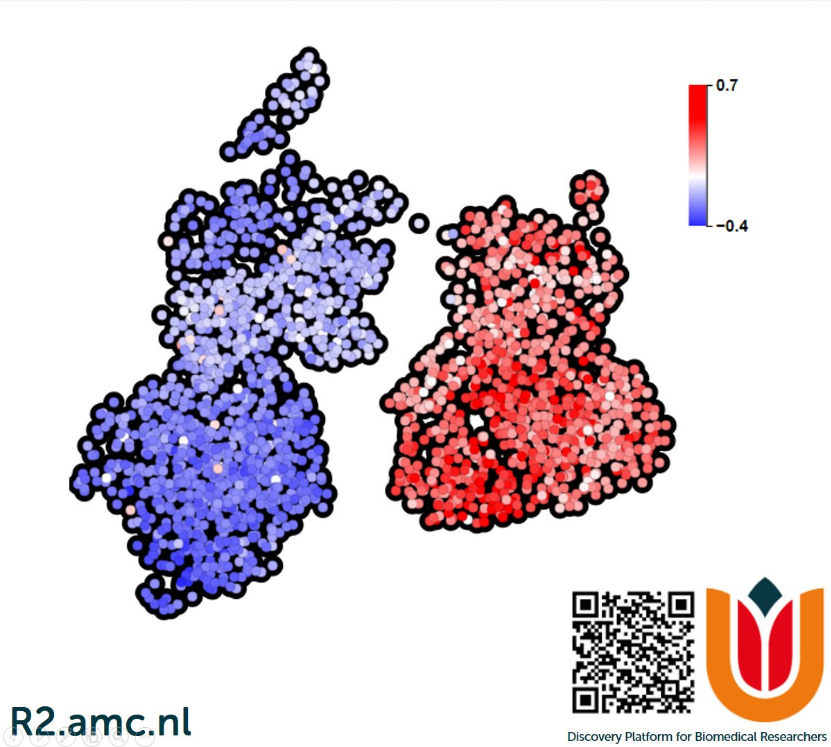
Your #world in #data. Make the unthinkable #scatterplot in the #free R2 online #datascience platform (r2.amc.nl) #DataAnalytics #Datavisualization

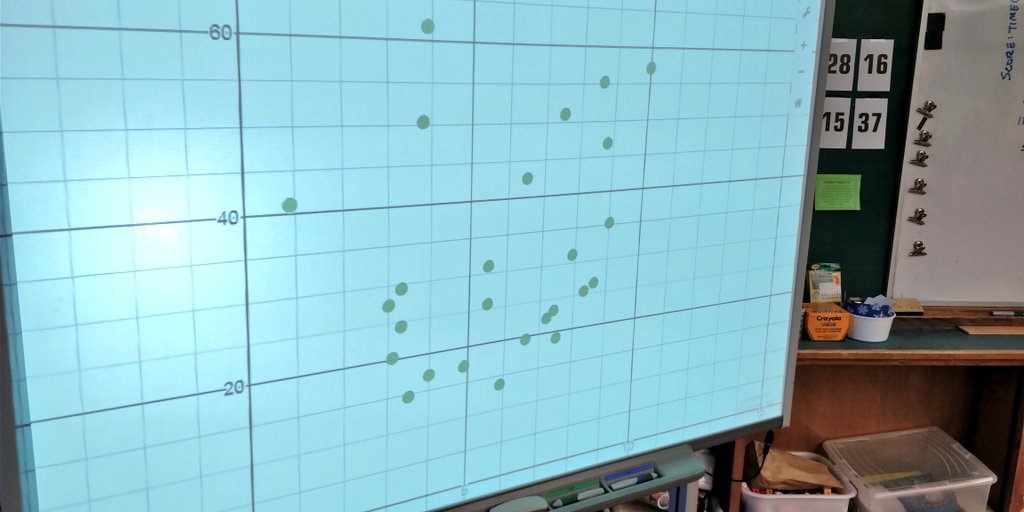
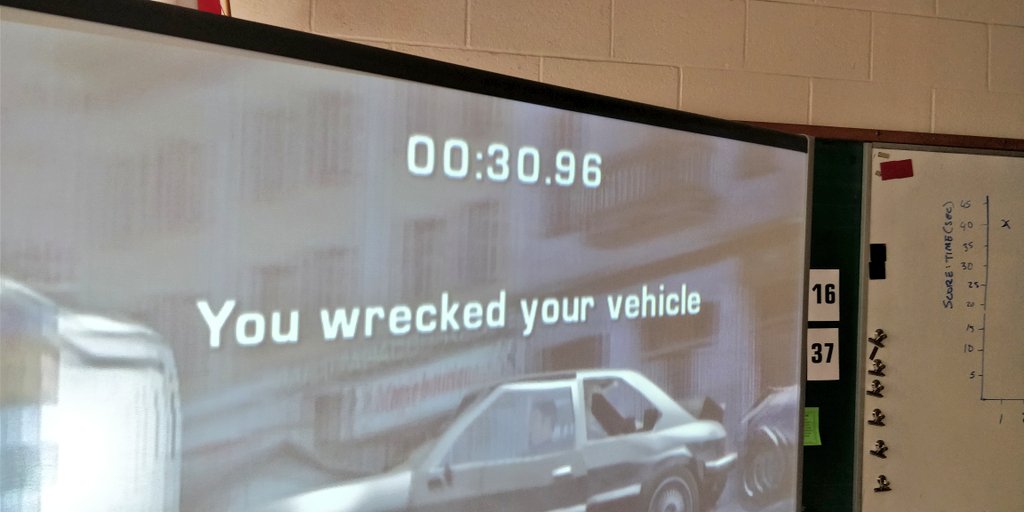
Was there a correlation between perceived video game skill V score in a random driving game? #iteachmath #scatterplot @Desmos


Something went wrong.
Something went wrong.
United States Trends
- 1. $MAYHEM 2,544 posts
- 2. The WET 102K posts
- 3. FINALLY DID IT 293K posts
- 4. Warner Bros 156K posts
- 5. HBO Max 67.3K posts
- 6. #FanCashDropPromotion 2,198 posts
- 7. #NXXT_CleanEra N/A
- 8. #NXXT_AI_Energy N/A
- 9. NextNRG Inc 2,521 posts
- 10. Paramount 30.3K posts
- 11. #FridayVibes 5,545 posts
- 12. Cyclist 2,885 posts
- 13. World Cup 81.4K posts
- 14. Good Friday 64.7K posts
- 15. Jake Tapper 65.3K posts
- 16. Ted Sarandos 5,462 posts
- 17. #สิงสาลาตายEP6 83.9K posts
- 18. The EU 155K posts
- 19. SINGSA LATAI EP6 82.9K posts
- 20. TINY CARS 2,605 posts