#visualizations 검색 결과

Good morning! Remember that your #subconscious mind is like a quantum computer, always working in the background to help you achieve your goals. So, make sure to utilize it often by #programming it with positive thoughts and #visualizations. When you align your conscious and subc


Lock Objects is rarely used in Power BI but is super helpful! Check it out 👇 #powerbi #visualizations

Making sense of school data shouldn’t be overwhelming. 📊✨ The LAC Board & Operational #Dashboards bring key metrics and KPIs together in clear, interactive #visualizations—built for executive teams and school boards. analyticscollaborative.com/products/board…


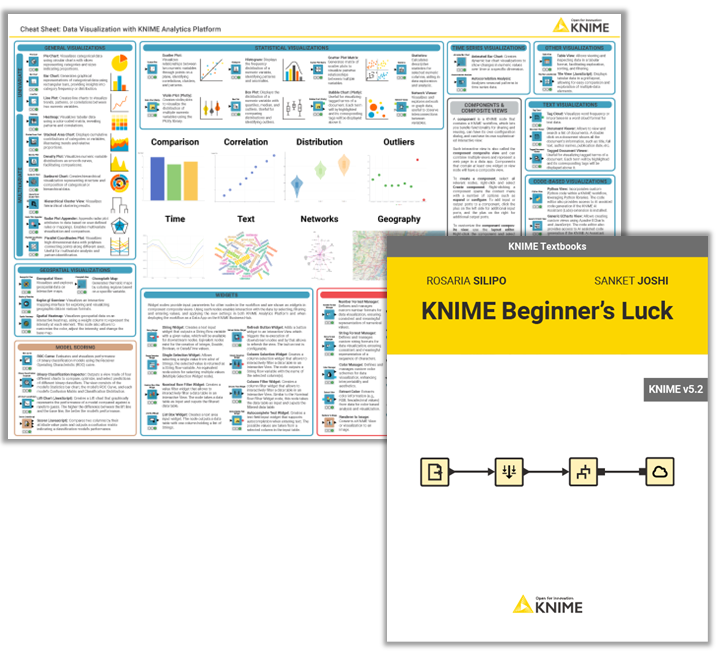
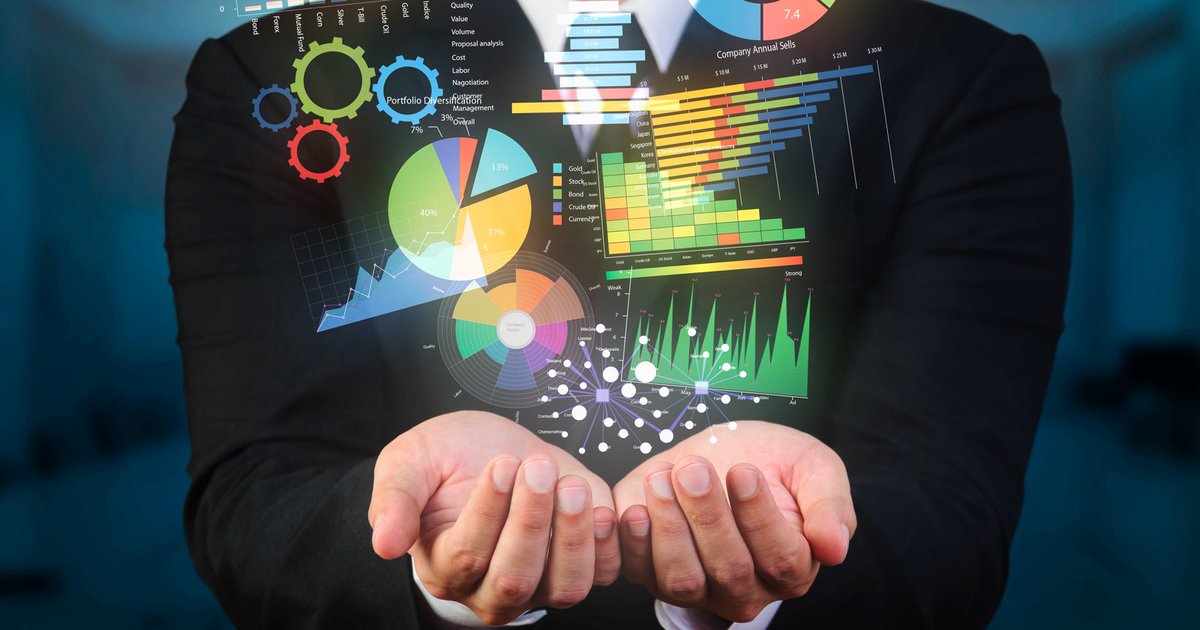
If you want to properly #analyze your data you can't avoid having #visualizations📊 It helps identifying patterns & trends and is important when sharing your results with others e.g. as #report or #DataApp #KNIME offers a variety of nodes for DataViz, #nocode & code-based⬇️

You can read the full post here: realpars.com/codesys-visual… In this video, we will give you a brief introduction to the advantages of developing #visualizations with CODESYS and the different options that are available for deploying a CODESYS visualization. bit.ly/46xHu88

Many people before my training don't know how to improve their report further. That's why l've have created this checklist as a quick starting point. ➡️ COMMENT: „FREE" • AND I WILL SEND YOU THE CHECKLIST #powerbi #checklist #visualizations

Matplotlib is a Python library that is used to create static, animated, and interactive #visualizations in #Python. It is an open-source library that is compatible with various platforms like Windows, Linux, and macOS. pyoflife.com/data-visualiza… #DataScience #DataScientists #coding


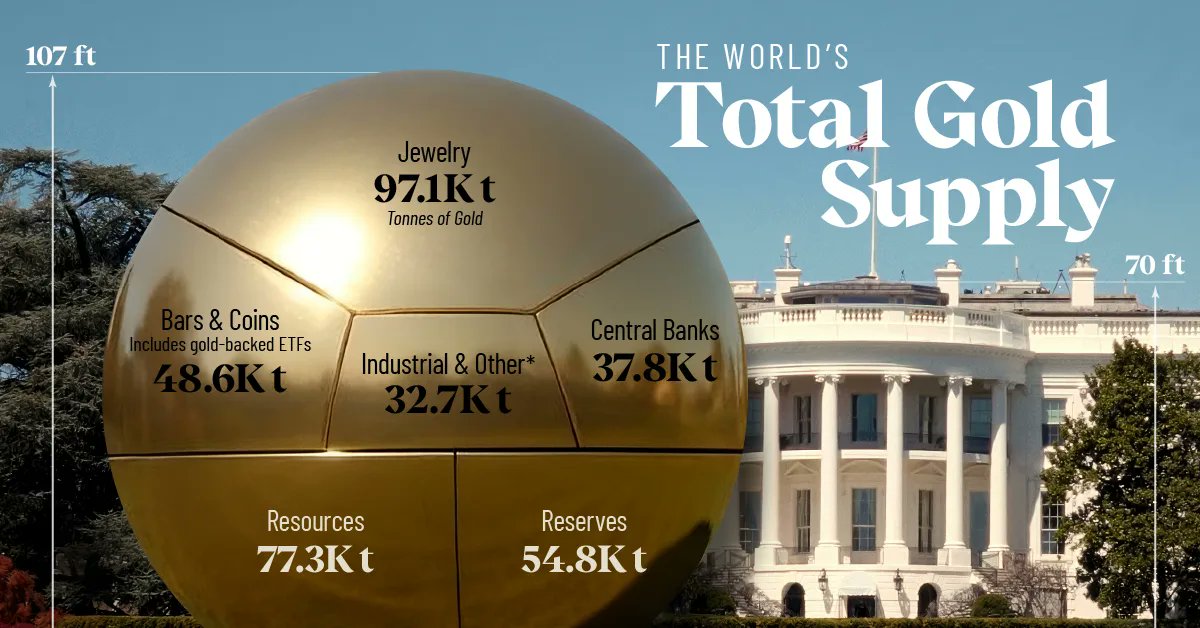
See how all of the world's gold, mined and below-ground, would look if it was all amassed and sitting next to the White House. dlvr.it/TPY32V #Gold #Visualizations #Economics #Investing #Wealth

Year-wise Details of Budget Allocated and Expenditure for Mega Food Parks under Pradhan Mantri Kisan Sampada Yojana (PMKSY) from 2021-22 to 2024-25 community.data.gov.in/year-wise-deta… #DataPortalIndia #DataGov #Visualizations #pmksy

University of Illinois: Information Sciences Professor Developing Tool to Make #Data #Visualizations Accessible to Blind Researchers, Students ow.ly/e7HT50PMv1b


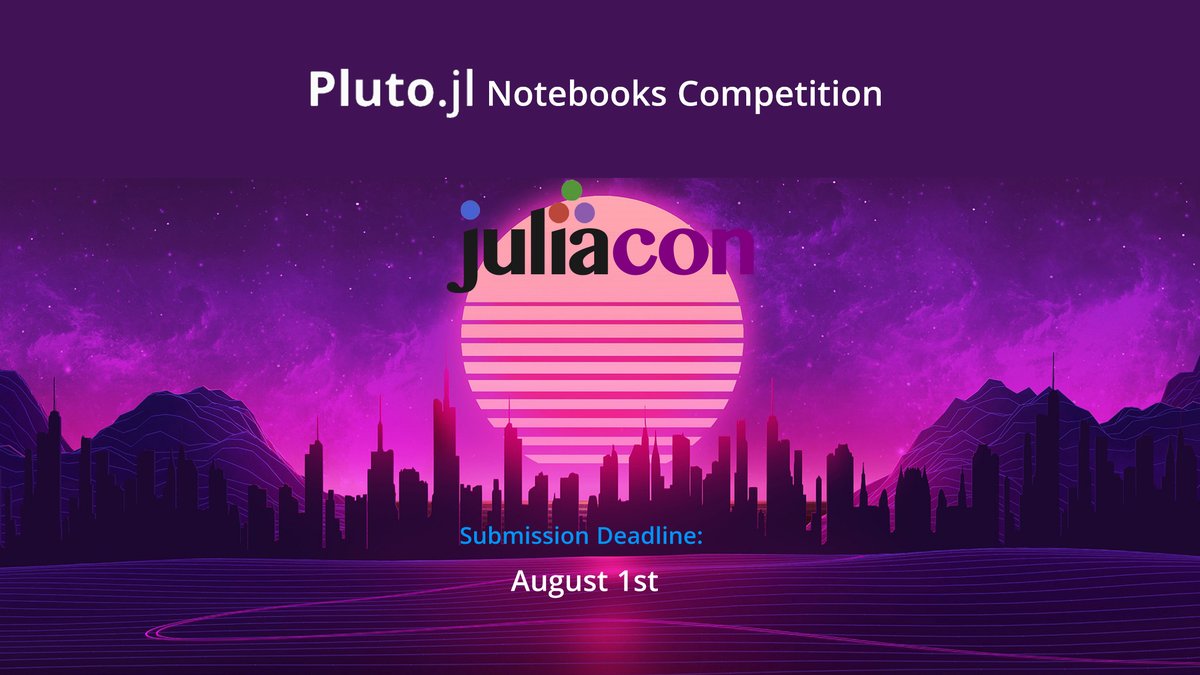
Introducing the first-ever Pluto Notebook competition 🥇 at this year's JuliaCon! Pluto Notebooks Competition The best Pluto Notebook projects between June 15 - August 1st. help.juliahub.com/juliahub/stabl… #datascience #visualizations #interactive #machinelearning #JuliaLang

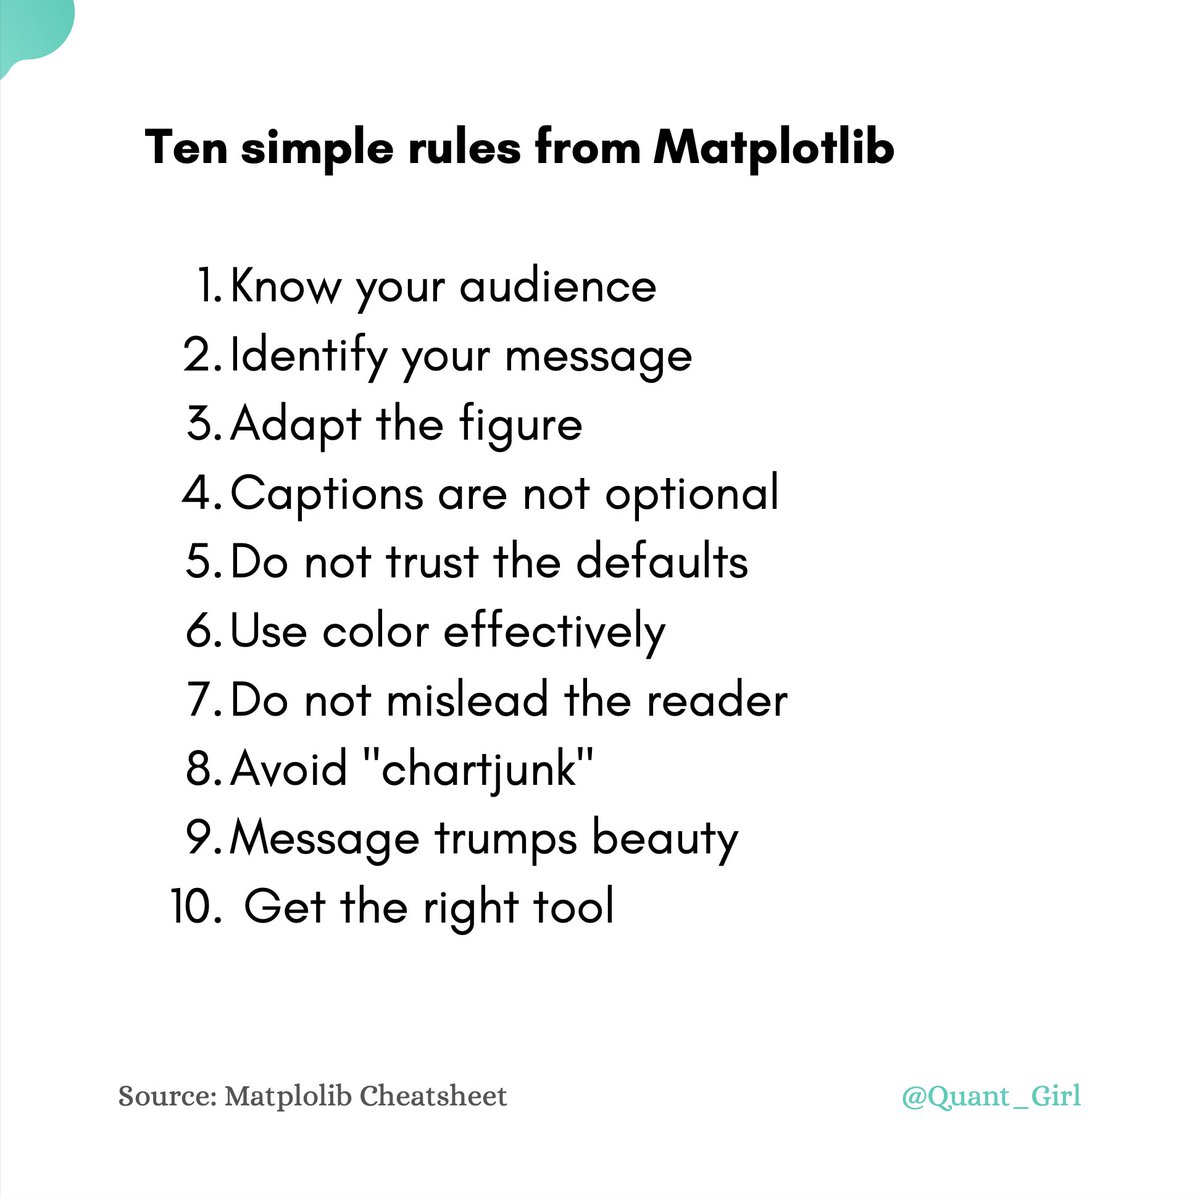
Rules to live by when making #charts 📊by @matplotlib✨ My personal favourites are 2 (getting the message right is sometimes the most difficult part) and 10 (always ask yourself if you have the right tool) #visualizations #plots #Datavisualization #DataAnalytics #Statistics

Today, @thecindyxiong visited us at our site in #Stuttgart and gave us some insights into her research on the challenges of designing natural language interfaces that recommend effective #visualizations to answer user queries. Thank you for an inspiring talk!


Full Colour Indian Edition Available! Order now shroffpublishers.com/books/97893554… Data Visualization with Microsoft Power BI by @KolokolovAlex , @Hohlick Shows #dataanalysts as well as professionals in finance, sales, & marketing to create #visualizations. #powerbi #datavisualization


This is a minimal (and very opinionated) tool for building #color scales for #data #visualizations (and #maps !). I built it for my personal needs, but it was a shame not to share it 😅 . abelvm.github.io/colortool/

Turn your Julia data outputs into beautiful #visualizations with Dash.jl. See how you can build, deploy, manage, and share interactive #dashboards with Dash for Julia. juliahub.com/company/resour… #JuliaLang


I'm going to start posting a U.S. #macro Chart of the Day, highlighting some obscure detail that I found digging through one of our data #visualizations available free to the public at bancreek.com. Today's chart shows the history of #payroll data for "Services for…


From easy-to-read charts to engaging maps, our #Infographics & #Visualizations page is a great way to explore #CensusData. 📊📈 Check it out: census.gov/library/visual… #DataVisualization #DataViz #infographic

See how all of the world's gold, mined and below-ground, would look if it was all amassed and sitting next to the White House. dlvr.it/TPY32V #Gold #Visualizations #Economics #Investing #Wealth
Making sense of school data shouldn’t be overwhelming The LAC Board & Operational #dashboards bring key metrics and KPIs together in clear, interactive #visualizations—built for executive teams and school boards. analyticscollaborative.com/products/board…


Days 36–38: #Python Libraries Revision 🐍 - Revised key functions of Pandas, NumPy, and Matplotlib - Practiced data manipulation, array operations & basic #visualizations Strengthening fundamentals for smoother analysis ⚡ #Pandas #NumPy #Matplotlib #100DaysOfCode #technology


🌟 Unveiling the Power of Sankey Charts with #SankeyMaster! Dive into the world of Sankey charts like never before and revolutionize your data visualization skills! 📊✨ #DataScience #Visualizations # #sankeymaster #sankey 👉apps.apple.com/app/apple-stor…
Good morning! Remember that your #subconscious mind is like a quantum computer, always working in the background to help you achieve your goals. So, make sure to utilize it often by #programming it with positive thoughts and #visualizations. When you align your conscious and subc
Year-wise Details of Budget Allocated and Expenditure for Mega Food Parks under Pradhan Mantri Kisan Sampada Yojana (PMKSY) from 2021-22 to 2024-25 community.data.gov.in/year-wise-deta… #DataPortalIndia #DataGov #Visualizations #pmksy
"✨ Discover the art & science of Sankey Charts with #SankeyMaster! These visual marvels make complex data flow more than clear – they shine a light on the hidden energy dynamics. #DataScience #Visualizations #InformationDesign #sankeymaster #sankey 👉apps.apple.com/app/apple-stor…

Explore ggplot2. #Visualizations

Looking to add statistical insights directly to your ggplot2 visualizations? The ggstatsplot package simplifies this by incorporating statistical tests, effect sizes, and other analyses right within your plots. ✔️ Enhanced Visuals: Automatically includes statistical information…


Whether it’s identifying #patterns, cleaning messy ,#data, or building #visualizations, the ultimate goal is turning raw data into clear stories that guide #actions.

Your #data holds a story. With Tableau, bring it to life through powerful #visualizations that provide clarity and impact. Start your #freetrial today to see how #Tableau tells your story better and maximizes the value of your data. Download now: bit.ly/4nbnVeK #beinex


🚀 Vizro: Python low-code magic! Pro dashboards in few lines #visualizations #Python open.substack.com/pub/pythonlibr…

Is It true? @elonmusk Tesla to Switch to Unreal Engine for Improved FSD #Visualizations notateslaapp.com/news/3008/tesl… If so, Im your guy on @UnrealEngine #3D #Artwork #CGI #Realtime #Rendering #XR #Vr #Tesla @Tesla


your show interested me over others: Have you ever paid attention to #visualizations? You make stories with (?): have you ever sent #athroughh of who approved #likeme? You #play on #surroundsound #associations with #zero threat correction connections to what? #freenewjeans #A?
From easy-to-read charts to engaging maps, our #Infographics & #Visualizations page is a great way to explore #CensusData. 📊📈 Check it out: census.gov/library/visual… #DataVisualization #DataViz #infographic


Good morning! Remember that your #subconscious mind is like a quantum computer, always working in the background to help you achieve your goals. So, make sure to utilize it often by #programming it with positive thoughts and #visualizations. When you align your conscious and subc

Twinmotion 2023.1.1 update now includes the camera composition grid overlay feature, making it easier than ever to frame the perfect shot. Have you tried it? #Twinmotion2023 #RealTime #Visualizations

New assets alert🚨 This time, we got some party-cularly good assets for you! Find them in the Twinmotion library > Characters > Posed humans > Events. #Twinmotion #RealTime #Visualizations


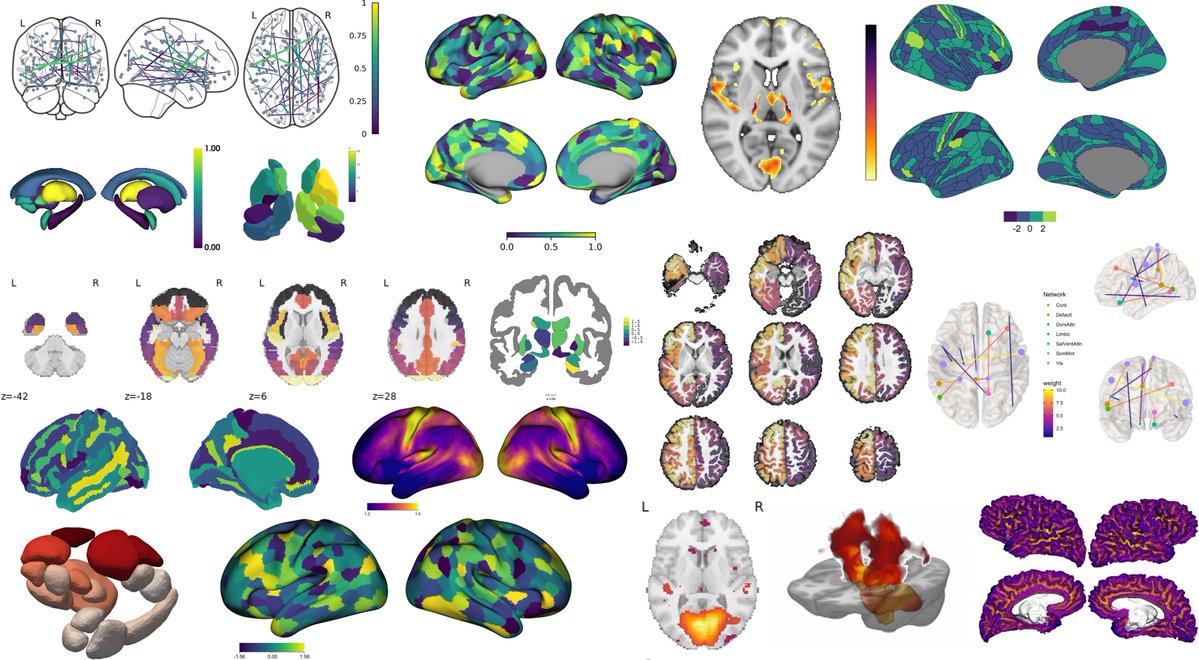
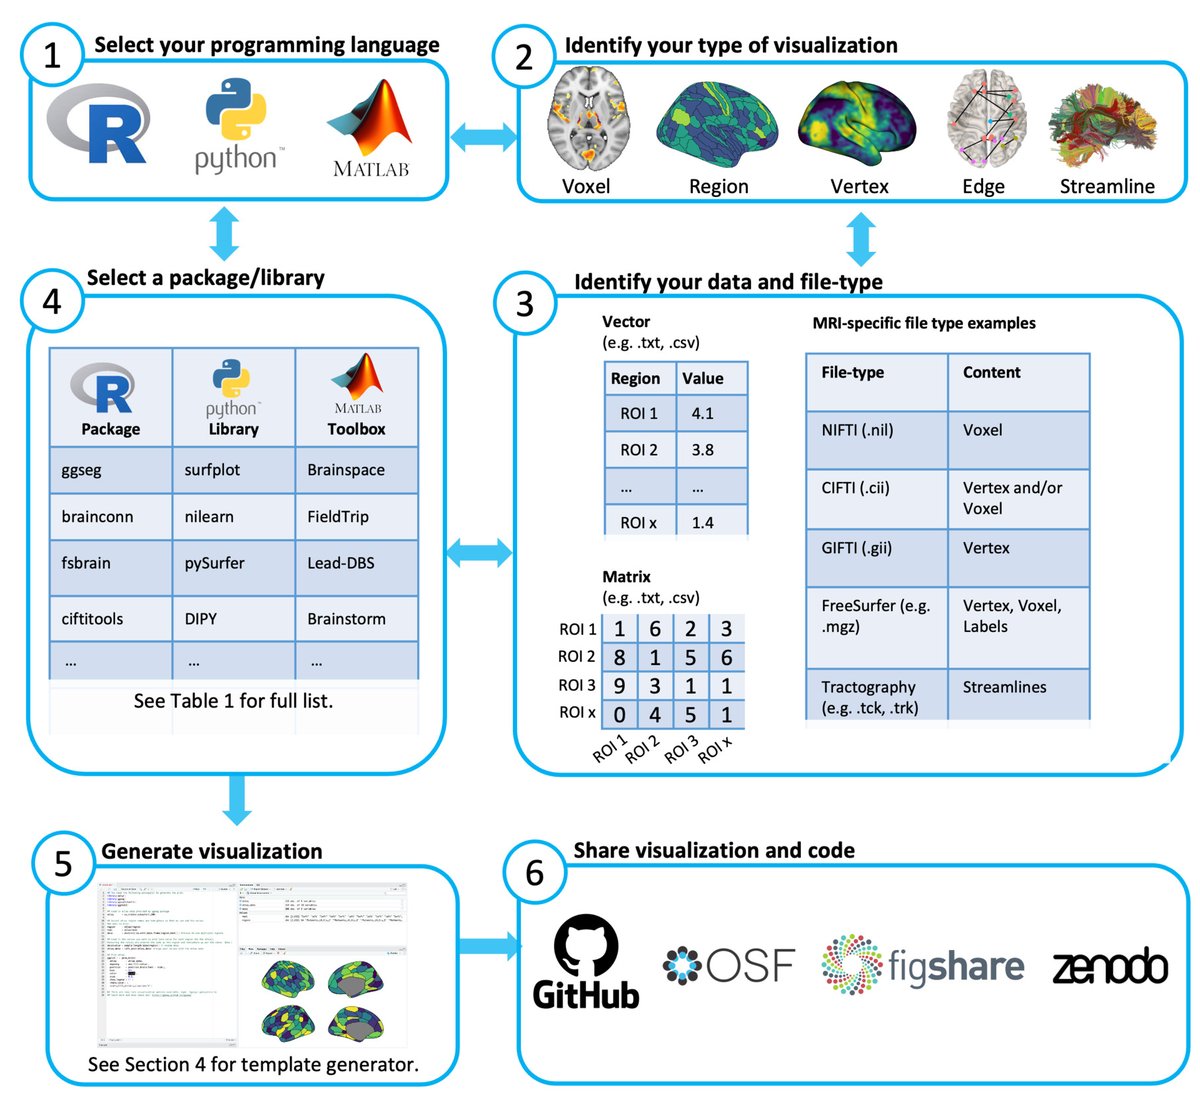
#dataviz A Practical Guide for Generating Reproducible and Programmatic #Neuroimaging #Visualizations in #Python #Matlab and #R 👇👇👇 apertureneuro.org/article/85104-… by . @SidChop @AvramHolmes et al. @ApertureOHBM #brain #openscience #reproucibility

Transforming #AzureSynapseAnalytics with #PowerBI #Visualizations check out at @ rb.gy/r52qwl #AzureSynapsesolutions #Microsoft #PowerBIdevelopment #Azure #PowerBIServices

From easy-to-read charts to engaging maps, our #Infographics & #Visualizations page is a great way to explore #CensusData. 📊📈 Check it out: census.gov/library/visual… #DataVisualization #DataViz #infographic
Year-wise Details of Budget Allocated and Expenditure for Mega Food Parks under Pradhan Mantri Kisan Sampada Yojana (PMKSY) from 2021-22 to 2024-25 community.data.gov.in/year-wise-deta… #DataPortalIndia #DataGov #Visualizations #pmksy
Matplotlib is a Python library that is used to create static, animated, and interactive #visualizations in #Python. It is an open-source library that is compatible with various platforms like Windows, Linux, and macOS. pyoflife.com/data-visualiza… #DataScience #DataScientists #coding
Community-wise Number of Beneficiaries under Seekho aur Kamao Scheme as on 15-07-2024 community.data.gov.in/community-wise… #DataGov #Visualizations #VOD #SeekhoaurKamao


New #Neo4j Bloom release includes support for coordinate layout for graph #visualizations 🗺 Here we analyze the road network of Boston City and use graph algorithms to identify important intersections and neighborhoods. Learn how to create this: okt.to/BrTe2E


medium.com/luminasticity/… #Poetic #Parodies, Cool #Visualizations and a #Playlist on #Spotify open.spotify.com/playlist/2IC8B…


medium.com/luminasticity/… Dear Friends, When I am out looking around and I find something of yours that I just need to take because it is good, sweet, and deliciously cold — I’m sorry for following my passion.


2/2 Chris Hall is joined by representatives of @belsenmemorial and @campwesterbork working on fitting the #Memorials goals into the #Visualizations and optimizing the experiences for visitors and users. #digitalHeritage #digitalCulture #concentrationCampHeritage


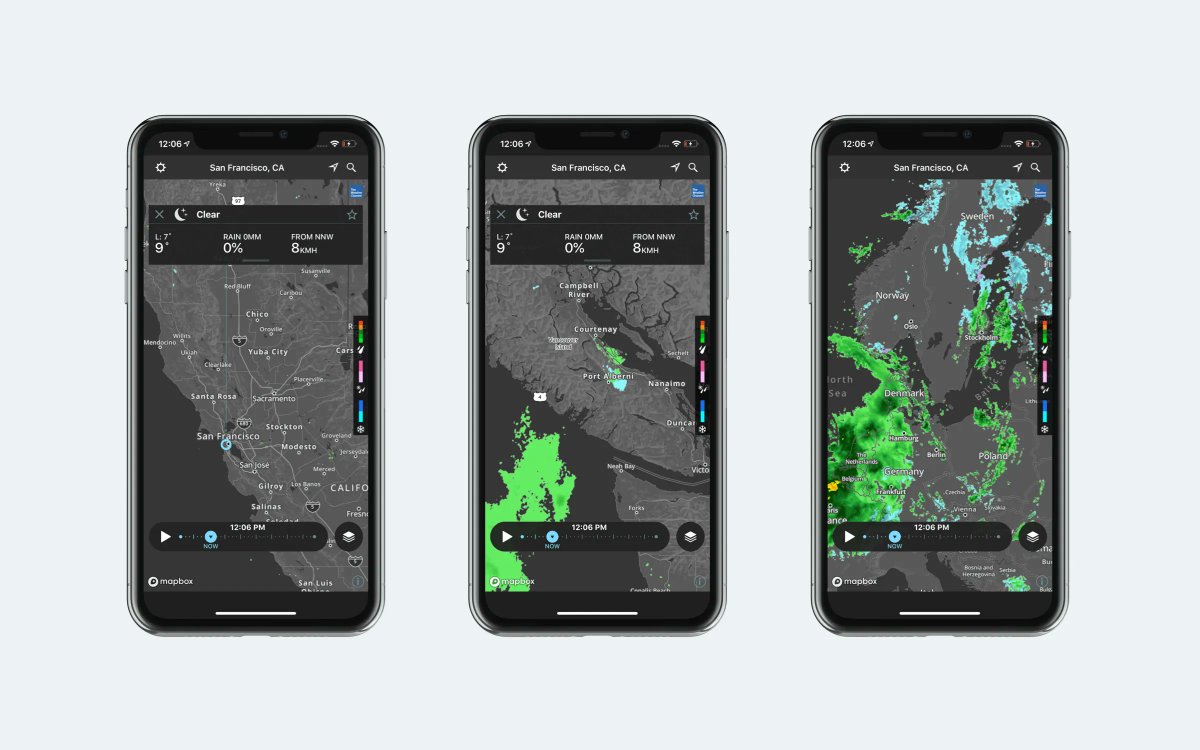
Mapbox customer @weatherchannel delivers 20bn daily forecasts🌤️ reaching millions of people each day. Its mobile app helps users see #datadriven #visualizations of wind speed, heat waves, and storms around the world.🌎 Here’s how: buff.ly/3Qb9JCd #BuiltWithMapbox
If you want to properly #analyze your data you can't avoid having #visualizations📊 It helps identifying patterns & trends and is important when sharing your results with others e.g. as #report or #DataApp #KNIME offers a variety of nodes for DataViz, #nocode & code-based⬇️
Introducing the first-ever Pluto Notebook competition 🥇 at this year's JuliaCon! Pluto Notebooks Competition The best Pluto Notebook projects between June 15 - August 1st. help.juliahub.com/juliahub/stabl… #datascience #visualizations #interactive #machinelearning #JuliaLang

#rosboard runs a web server in your robot. Run the #ROS node, point your web browser at your-robot-ip and you get an awesome #visualizations. #ROS1/ #ROS2 compatible. Mobile friendly. Light weight. github - github.com/dheera/rosboard


University of Illinois: Information Sciences Professor Developing Tool to Make #Data #Visualizations Accessible to Blind Researchers, Students ow.ly/e7HT50PMv1b

11 Stunning SEO Data Visualizations To Inspire Your Reporting via @rightrelevance buff.ly/3IHrCDN #data #visualizations

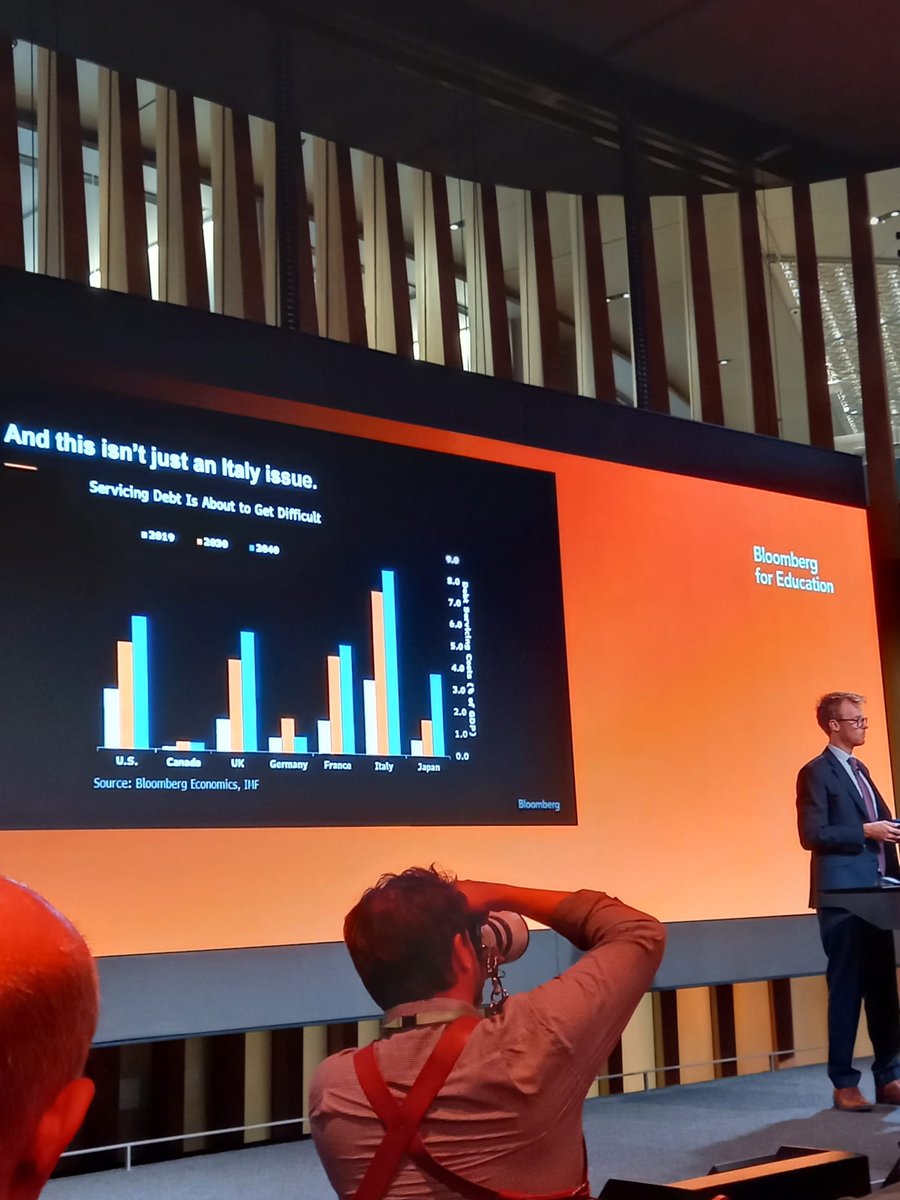
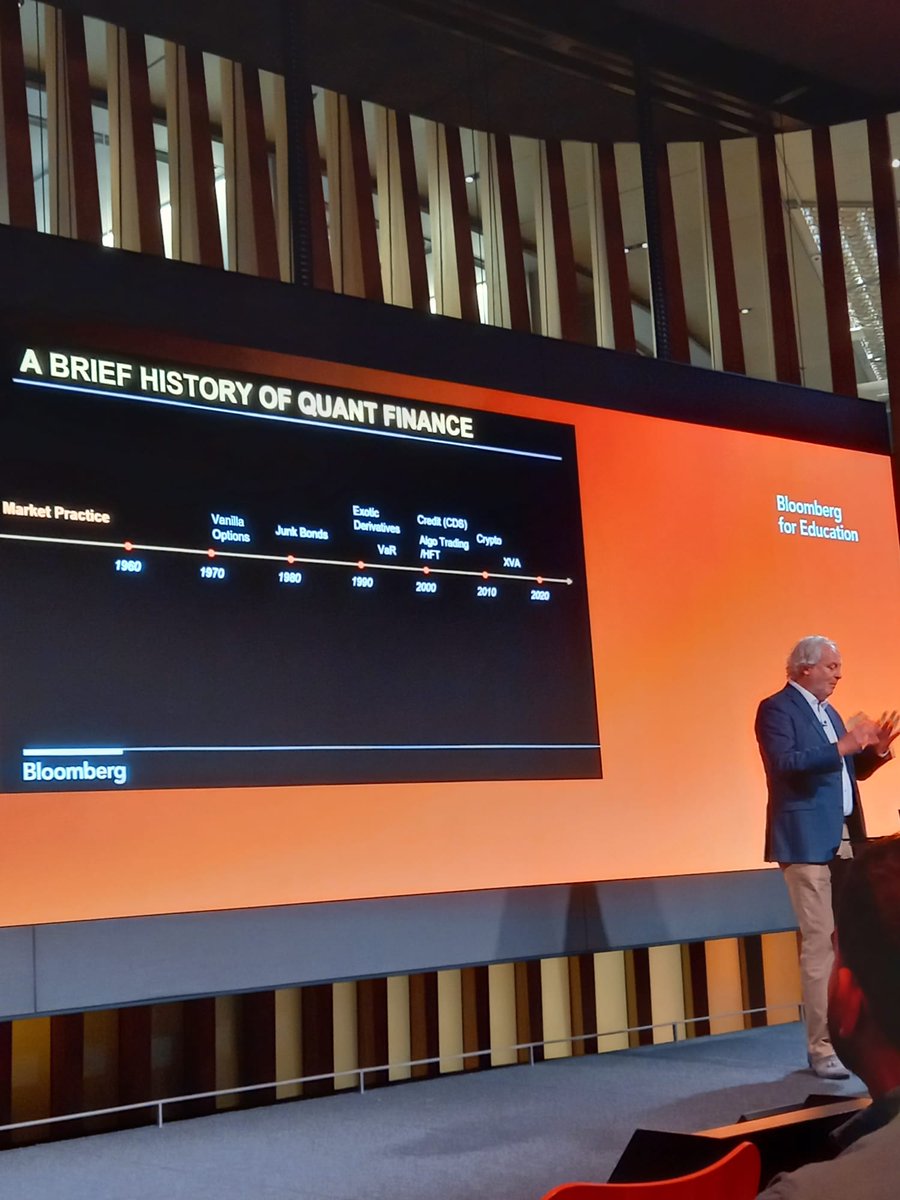
Great day ay @bloomberg, Academic Symposium 2023; nice talks, #visualizations, #colouranalysis, #globaleconomicoutlook by Bruno Dupiro (Head of Quants) and @JMurray804 chief European Economist. #ClimateAction #bloombergforeducation


Something went wrong.
Something went wrong.
United States Trends
- 1. Chris Paul 4,525 posts
- 2. Pat Spencer 2,592 posts
- 3. Kerr 5,502 posts
- 4. Podz 3,241 posts
- 5. Shai 15.3K posts
- 6. Jimmy Butler 2,615 posts
- 7. Seth Curry 4,686 posts
- 8. Hield 1,576 posts
- 9. Mark Pope 1,939 posts
- 10. Carter Hart 4,005 posts
- 11. #DubNation 1,413 posts
- 12. Derek Dixon 1,281 posts
- 13. Kuminga 1,449 posts
- 14. Brandy 8,232 posts
- 15. #SeanCombsTheReckoning 4,687 posts
- 16. Connor Bedard 2,386 posts
- 17. Caleb Wilson 1,177 posts
- 18. #ThunderUp N/A
- 19. Braylon Mullins N/A
- 20. #AreYouSure2 128K posts