#boxplot نتائج البحث

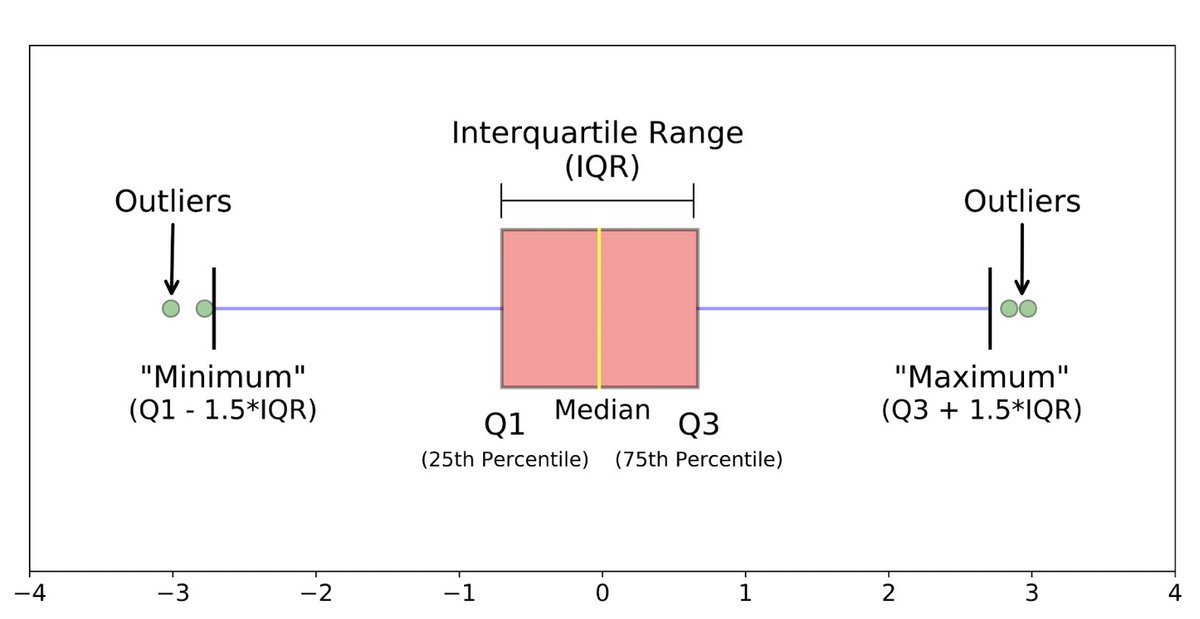
En estadística es más que habitual (casi preceptivo) la elaboración de gráficos que permitan visualizar y entender mejor los conjuntos de datos. Uno de los más usados, y más desconocidos, es el gráfico de caja (y bigotes) o #boxplot. #EnHebrasMatemáticas Dentro hilo ⬇️⬇️

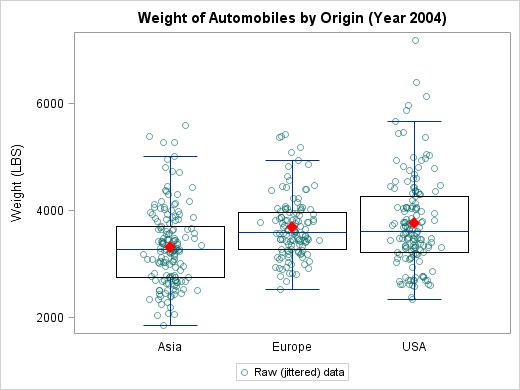
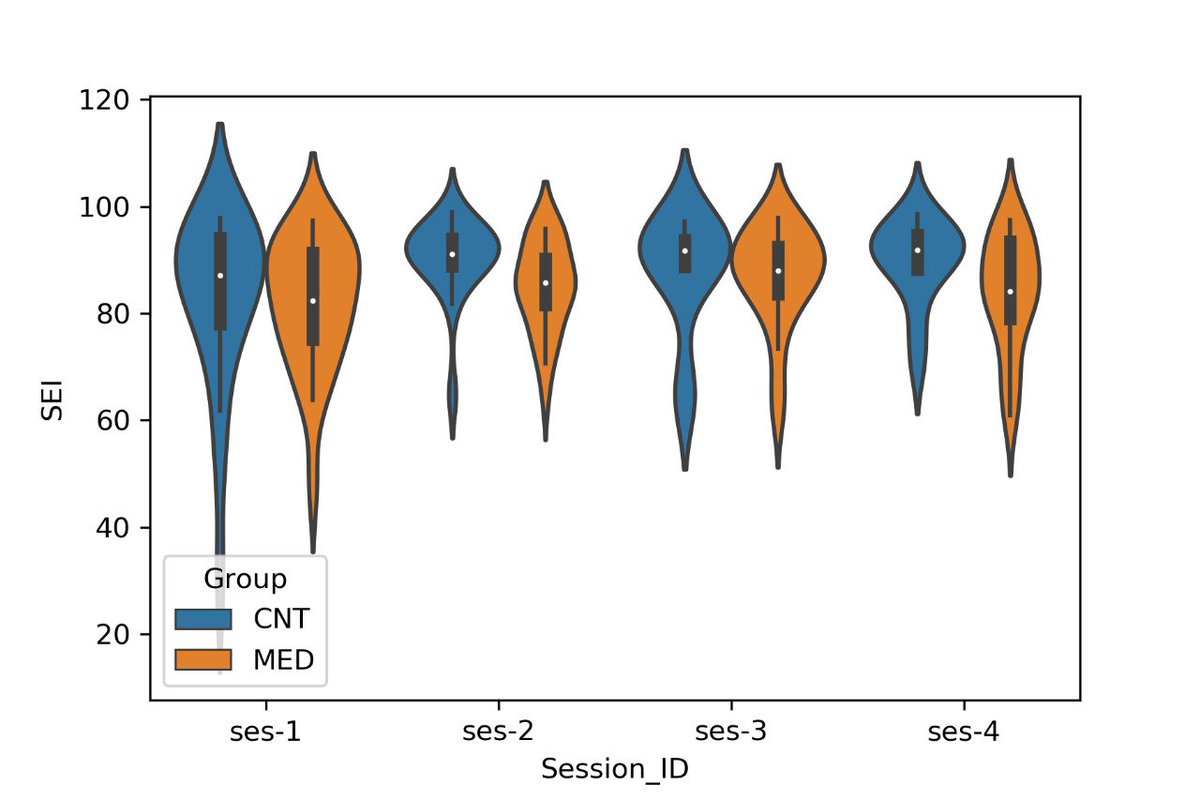
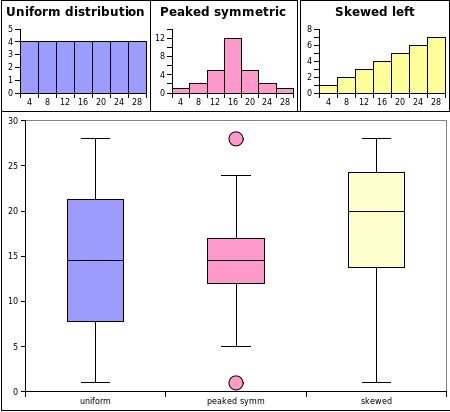
Visualizing summary statistics in a #boxplot is great. But don't forget to explore the underlying data distribution. Thanks to @JustinMatejka for this great educational dataset. #30DayChartChallenge | #Day27 | #educational #dataviz #Rstats #ggplot2 #statistics #violinplot


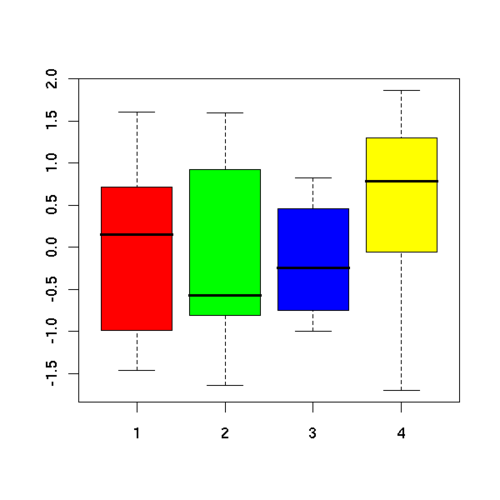
⛔️ Precauciones con los gráficos de cajas ⚠️ #Boxplot #dataScientist #DataScience #datanalysis #Statistics

Even geen #stikstof vandaag, ik heb andere werkzaamheden te doen. Uit interesse zit ik wat te kijken naar LCA data van een paar honderd producten. Twee vragen: Wie kent er openbare #LCA databases? Hier voor de verschillende categorieën de LCA data in een #boxplot. Wie kent…


The Center and Variability simulation allows students to explore mean, median, range, Interquartile Range, and measures of spread by interacting with different kickers’ unique data distributions from kicks. phet.colorado.edu/en/simulations… #boxPlot #distributions

Hola. Mañana en clase damos la parte de toda la asignatura que más me gusta. Tengo 5 años. 📦🐱 #Boxplot

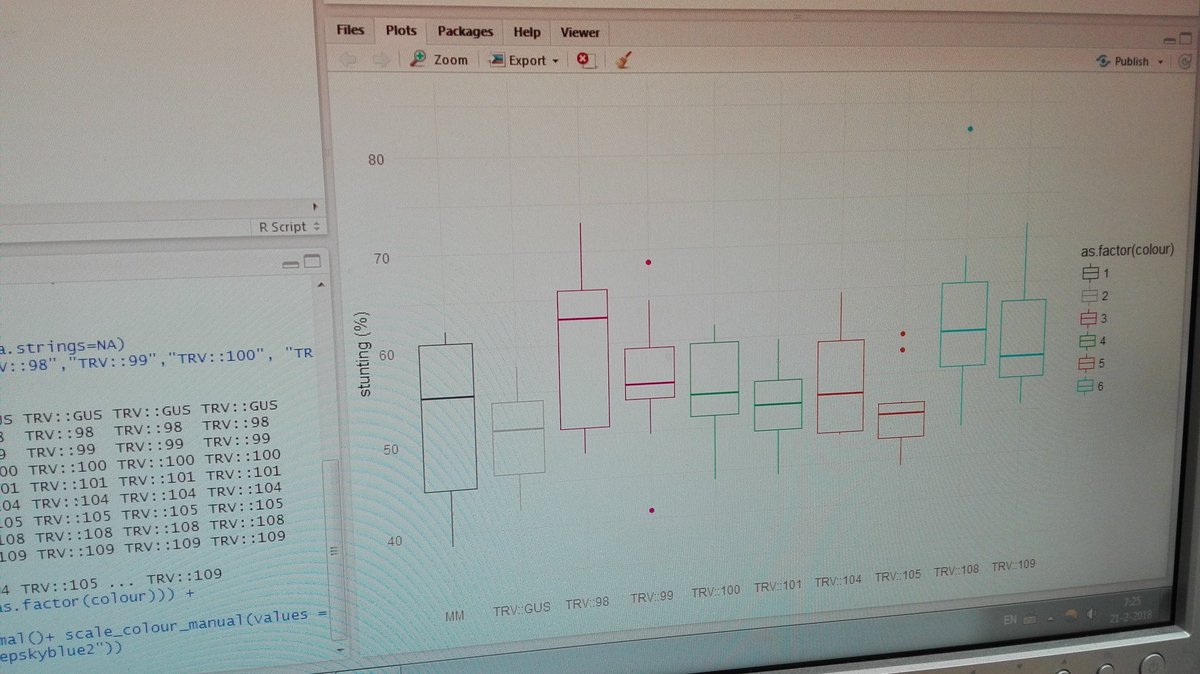
How do you change the spread of the Y axis of pandas box plot? stackoverflow.com/questions/6713… #matplotlib #pandas #boxplot #python #plot


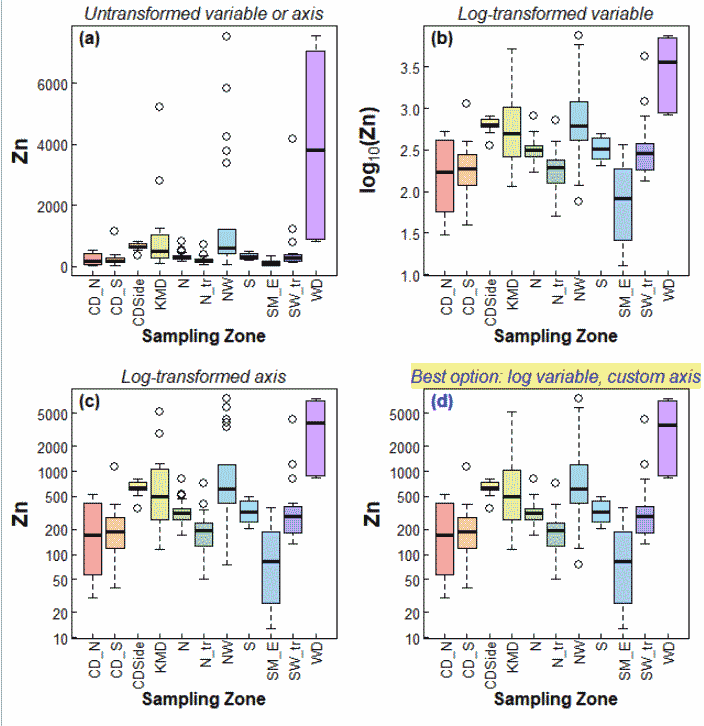
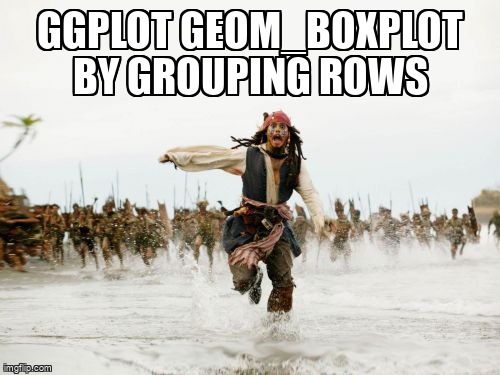
How To Boxplot in R (well, that's a presumptuous opening, but I have some simple and achievable ideas at researchgate.net/project/R-and-… #RStats #boxplot #graphics #ExploratoryDataAnalysis For other potentially useful code, github.com/Ratey-AtUWA

Now this is a good #boxplot with important implications: genetic predispositions and habits are correlated to breast cancer insurgence #SIOP2019


🚨🤔💭 Why do I always have to add a #ViolinPlot on top of a #BoxPlot? 🤯📊🎻 The #BoxPlot already gives a great summary of the distribution, but I love to keep it #Extraordinary! 💥🌟🤩 Don't be afraid to add a little spice to your data visualization! 🔥📈 #Rstats #DataScience…

how to make the box in my boxplot bigger?(matplotlib) stackoverflow.com/questions/7223… #matplotlib #boxplot #python
Can you have a box plot overlap a half violin plot on a raincloud plot using Python? stackoverflow.com/questions/6737… #matplotlib #boxplot #python #violinplot #seaborn


Took me some time, but I made my first #boxplot with #R 😁 what do you think @MFSeidl and @CProdhomme? 📊📚🔬#phdchat #dataviz #NeverGiveUp

Ahir a la facultat vaig descriure un gràfic com aquest dient que era cuqui. Encara riuen els alumnes. Angelines, no t'ho perdonaré mai. #boxplot #cuquiplot @lacompetencia

I am big fan of #Boxplot chart, it is often used in explanatory data analysis. Box plots visually show the distribution of numerical data.


Outliers aren’t mistakes — they’re insights. Learn how to handle them smartly. #DataAnalytics #BoxPlot #ShineDotCom

Fiquei aqui pensando. E se colocar os pontos do Campeonato Brasileiro num #boxplot. E comparar com os últimos 5 anos. O quão o @Flamengo está na frente. E a distância do @sportrecife para os outros colocados.


[2] 🔥 Streak Stats Total Green streaks: 40 Total Red streaks: 41 Longest Green streak: 93 months Longest Red streak: 27 months #TrendAnalysis #MarketCycles #BoxPlot #DataVisualization #StockMarketTrends #InvestmentStrategy #QuantAnalysis #EquityMarkets #DataDrivenInvesting…
![Stockman_idea's tweet image. [2]
🔥 Streak Stats
Total Green streaks: 40
Total Red streaks: 41
Longest Green streak: 93 months
Longest Red streak: 27 months
#TrendAnalysis #MarketCycles #BoxPlot #DataVisualization #StockMarketTrends #InvestmentStrategy #QuantAnalysis #EquityMarkets
#DataDrivenInvesting…](https://pbs.twimg.com/media/G0PoCASXEAAFY8r.png)
![Stockman_idea's tweet image. [2]
🔥 Streak Stats
Total Green streaks: 40
Total Red streaks: 41
Longest Green streak: 93 months
Longest Red streak: 27 months
#TrendAnalysis #MarketCycles #BoxPlot #DataVisualization #StockMarketTrends #InvestmentStrategy #QuantAnalysis #EquityMarkets
#DataDrivenInvesting…](https://pbs.twimg.com/media/G0PoEvOXUAA7tK5.png)

Boxplots are super useful ✅ Detect outliers ✅ Understand data spread ✅ Spot skewness ✅ Compare distributions across groups Great for finance, healthcare, surveys any dataset with variation 📊 #DataScience #Visualization #BoxPlot #Statistics #ML #AI


90% misread box plots. Are you one of them? Stop guessing. Start mastering data visuals. 🎯 Learn the truth 👉 koshurai.medium.com/the-ultimate-g… #DataScience #BoxPlot


Which plot can be used to identify both skewness and outliers? Explore our programs and enroll now at: 360digitmg.com #BoxPlot #DataVisualization #OutliersDetection #Skewness #StatisticalAnalysis #DataScience #Analytics #DataInsights #EDA #360DigiTMG

🎧 New Lecture Audio Just Dropped! Using Measures of Position to Describe Variability 📊 From quartiles to box plots, learn how to spot outliers and summarize data like a pro! #ProfElhosseiniSmartSysEng #Statistics #BoxPlot #IQR #DataScience #EDA #AI4Education #SmartStats 🔍📈
The Center and Variability simulation allows students to explore mean, median, range, Interquartile Range, and measures of spread by interacting with different kickers’ unique data distributions from kicks. phet.colorado.edu/en/simulations… #boxPlot #distributions

Dear Data Analysts, Dashboards are great for summaries — box plots are greater. They reveal, without a click: distributions, medians, ranges, and outliers. Dashboards show the big picture. Box plots show the story beneath it. #DataViz #DataAnalytics #boxplot


There is a lot of debate over #violin being better than #boxplot. Within the r2.amc.nl #data #science platform for researchers, we like the #raincloud plot, since it combines the best of 3 #plot types: violin, box & jitter. Also #visually #appealing #dataviz


Seaborn Boxplot | How to Make a Box Plot in Python seaborn - Complete E... youtu.be/BmCu2MPKfBY?si… via @YouTube Mathematical explanation of Box plot (although very instense lecture ! :-) #seaborn #boxplot #python #quartiles

youtube.com
YouTube
Seaborn Boxplot | How to Make a Box Plot in Python seaborn - Complete...

A boxplot provides a concise visual summary of data by highlighting its spread, central tendency, and outliers. #Boxplot #DataVisualization #Statistics #DataAnalysis #Outliers #DataSummary #VisualData #DataScience #StatisticalGraphics #DataInterpretation #InsightfulData


LIVE: It's #Liquicity featuring #Boxplot Lock in at rinse.fm + DAB


You might create a scatter plot to visualize the relationship between study time and exam scores, or a box plot to show the distribution of income levels in a sample. #scatterplot #boxplot


Visualizing summary statistics in a #boxplot is great. But don't forget to explore the underlying data distribution. Thanks to @JustinMatejka for this great educational dataset. #30DayChartChallenge | #Day27 | #educational #dataviz #Rstats #ggplot2 #statistics #violinplot
En estadística es más que habitual (casi preceptivo) la elaboración de gráficos que permitan visualizar y entender mejor los conjuntos de datos. Uno de los más usados, y más desconocidos, es el gráfico de caja (y bigotes) o #boxplot. #EnHebrasMatemáticas Dentro hilo ⬇️⬇️
⛔️ Precauciones con los gráficos de cajas ⚠️ #Boxplot #dataScientist #DataScience #datanalysis #Statistics


Boxplots and violin plots don't agree. I vaguely remember this has something to do with how violin plot source code computes the bounds. Have noticed it in seaborn documentation also. Any inputs/observations? #seaborn #violinplot #boxplot #disagreement #python #dataviz


youtube.com/watch?v=-D2ghy… #BANKNIFTYSETUP #BOXPLOT #INTRADAYSETUP #NOINDICATORSNEEDED #SIMPLEANALYSIS

How do you change the spread of the Y axis of pandas box plot? stackoverflow.com/questions/6713… #matplotlib #pandas #boxplot #python #plot
Plotting boxplot of the log values of the columns stackoverflow.com/questions/7192… #logging #boxplot


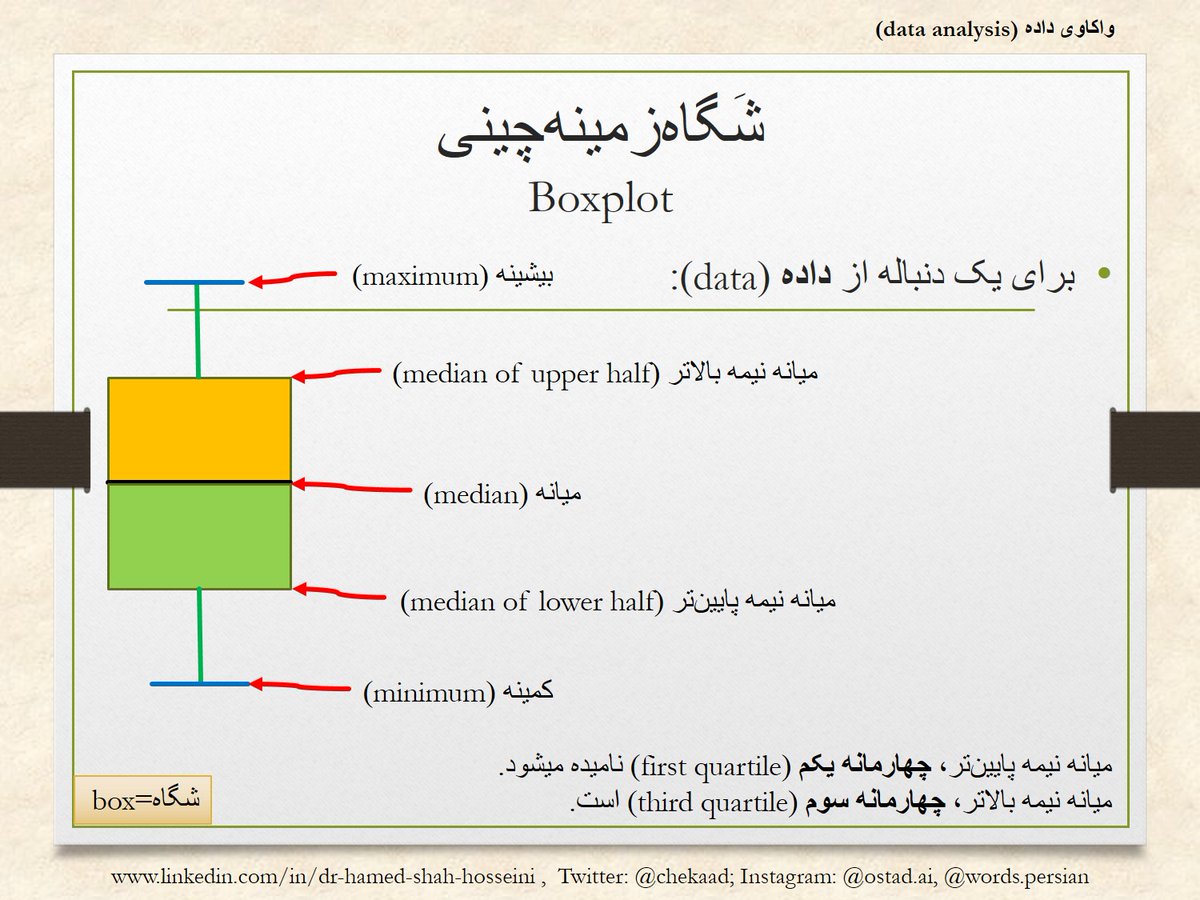
یک راه نمایش داده، زمینهچینی شگاه است؛ در پیکره زیر، سازههای یک #شگاهزمینهچینی آورده شدهاند box=شگاه #boxplot
Hola. Mañana en clase damos la parte de toda la asignatura que más me gusta. Tengo 5 años. 📦🐱 #Boxplot
Now this is a good #boxplot with important implications: genetic predispositions and habits are correlated to breast cancer insurgence #SIOP2019
How To Boxplot in R (well, that's a presumptuous opening, but I have some simple and achievable ideas at researchgate.net/project/R-and-… #RStats #boxplot #graphics #ExploratoryDataAnalysis For other potentially useful code, github.com/Ratey-AtUWA

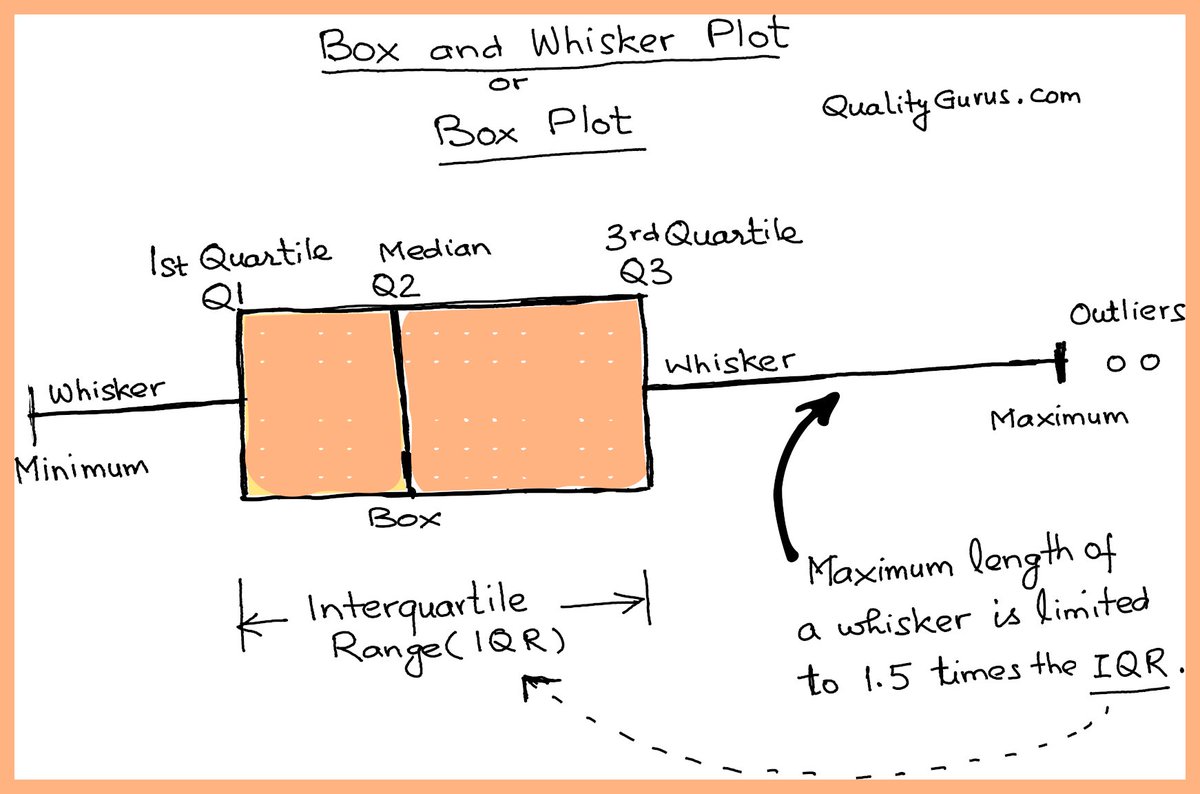
Understanding Box and Whisker Plot (also called Box Plot) #boxplot #matplotlib #seaborn #pandas #minitab #R #Rprogramming #statistics #python #boxandwhiskerplot #datavisualization
Something went wrong.
Something went wrong.
United States Trends
- 1. #VERZUZ 3,219 posts
- 2. Bama 14.1K posts
- 3. South Carolina 16.6K posts
- 4. Mia X 567K posts
- 5. #HalloweenHavoc 18.6K posts
- 6. Mississippi State 5,186 posts
- 7. #HookEm 2,685 posts
- 8. Marcel Reed 1,236 posts
- 9. No Limit 11.4K posts
- 10. #RollTide 4,430 posts
- 11. Texas 139K posts
- 12. Vandy 9,968 posts
- 13. Mizzou 7,457 posts
- 14. Master P 1,741 posts
- 15. Arch 20.7K posts
- 16. Gane 130K posts
- 17. Lebby 1,533 posts
- 18. Ryan Niblett 1,950 posts
- 19. Sark 5,806 posts
- 20. Jon Jones 13.5K posts