#boxplot search results

En estadística es más que habitual (casi preceptivo) la elaboración de gráficos que permitan visualizar y entender mejor los conjuntos de datos. Uno de los más usados, y más desconocidos, es el gráfico de caja (y bigotes) o #boxplot. #EnHebrasMatemáticas Dentro hilo ⬇️⬇️

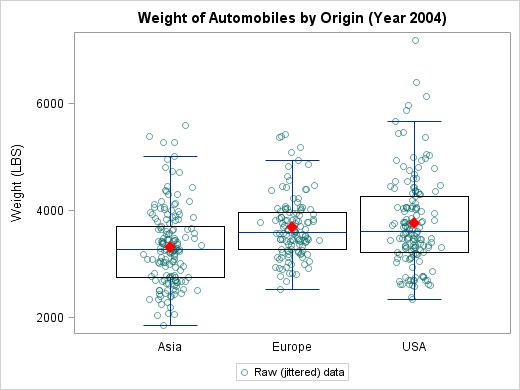
Visualizing summary statistics in a #boxplot is great. But don't forget to explore the underlying data distribution. Thanks to @JustinMatejka for this great educational dataset. #30DayChartChallenge | #Day27 | #educational #dataviz #Rstats #ggplot2 #statistics #violinplot


The Center and Variability simulation allows students to explore mean, median, range, Interquartile Range, and measures of spread by interacting with different kickers’ unique data distributions from kicks. phet.colorado.edu/en/simulations… #boxPlot #distributions

Even geen #stikstof vandaag, ik heb andere werkzaamheden te doen. Uit interesse zit ik wat te kijken naar LCA data van een paar honderd producten. Twee vragen: Wie kent er openbare #LCA databases? Hier voor de verschillende categorieën de LCA data in een #boxplot. Wie kent…


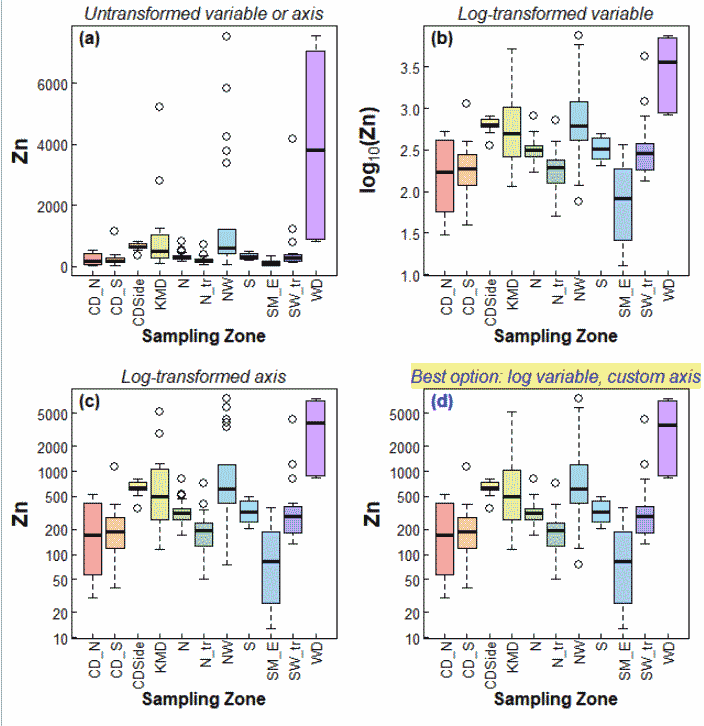
⛔️ Precauciones con los gráficos de cajas ⚠️ #Boxplot #dataScientist #DataScience #datanalysis #Statistics


Hola. Mañana en clase damos la parte de toda la asignatura que más me gusta. Tengo 5 años. 📦🐱 #Boxplot

How do you change the spread of the Y axis of pandas box plot? stackoverflow.com/questions/6713… #matplotlib #pandas #boxplot #python #plot


How To Boxplot in R (well, that's a presumptuous opening, but I have some simple and achievable ideas at researchgate.net/project/R-and-… #RStats #boxplot #graphics #ExploratoryDataAnalysis For other potentially useful code, github.com/Ratey-AtUWA

🚨🤔💭 Why do I always have to add a #ViolinPlot on top of a #BoxPlot? 🤯📊🎻 The #BoxPlot already gives a great summary of the distribution, but I love to keep it #Extraordinary! 💥🌟🤩 Don't be afraid to add a little spice to your data visualization! 🔥📈 #Rstats #DataScience…


Now this is a good #boxplot with important implications: genetic predispositions and habits are correlated to breast cancer insurgence #SIOP2019


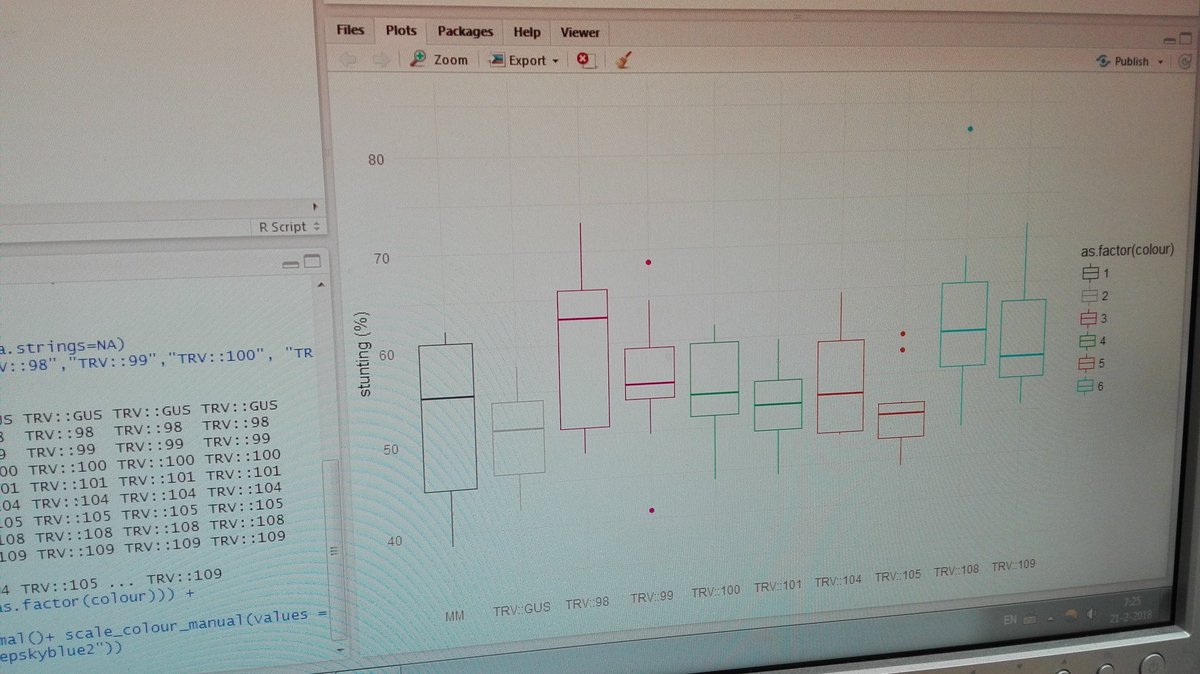
Took me some time, but I made my first #boxplot with #R 😁 what do you think @MFSeidl and @CProdhomme? 📊📚🔬#phdchat #dataviz #NeverGiveUp
how to make the box in my boxplot bigger?(matplotlib) stackoverflow.com/questions/7223… #matplotlib #boxplot #python
Can you have a box plot overlap a half violin plot on a raincloud plot using Python? stackoverflow.com/questions/6737… #matplotlib #boxplot #python #violinplot #seaborn


Ahir a la facultat vaig descriure un gràfic com aquest dient que era cuqui. Encara riuen els alumnes. Angelines, no t'ho perdonaré mai. #boxplot #cuquiplot @lacompetencia

#EARLISIG3 conference on #ConceptualChange in Zwolle is starting today. Happy to be here and discuss our ideas and study about specific source for errors when comparing #Boxplot representation.


Outliers aren’t mistakes — they’re insights. Learn how to handle them smartly. #DataAnalytics #BoxPlot #ShineDotCom

Fiquei aqui pensando. E se colocar os pontos do Campeonato Brasileiro num #boxplot. E comparar com os últimos 5 anos. O quão o @Flamengo está na frente. E a distância do @sportrecife para os outros colocados.


[2] 🔥 Streak Stats Total Green streaks: 40 Total Red streaks: 41 Longest Green streak: 93 months Longest Red streak: 27 months #TrendAnalysis #MarketCycles #BoxPlot #DataVisualization #StockMarketTrends #InvestmentStrategy #QuantAnalysis #EquityMarkets #DataDrivenInvesting…
![Stockman_idea's tweet image. [2]
🔥 Streak Stats
Total Green streaks: 40
Total Red streaks: 41
Longest Green streak: 93 months
Longest Red streak: 27 months
#TrendAnalysis #MarketCycles #BoxPlot #DataVisualization #StockMarketTrends #InvestmentStrategy #QuantAnalysis #EquityMarkets
#DataDrivenInvesting…](https://pbs.twimg.com/media/G0PoCASXEAAFY8r.png)
![Stockman_idea's tweet image. [2]
🔥 Streak Stats
Total Green streaks: 40
Total Red streaks: 41
Longest Green streak: 93 months
Longest Red streak: 27 months
#TrendAnalysis #MarketCycles #BoxPlot #DataVisualization #StockMarketTrends #InvestmentStrategy #QuantAnalysis #EquityMarkets
#DataDrivenInvesting…](https://pbs.twimg.com/media/G0PoEvOXUAA7tK5.png)

Boxplots are super useful ✅ Detect outliers ✅ Understand data spread ✅ Spot skewness ✅ Compare distributions across groups Great for finance, healthcare, surveys any dataset with variation 📊 #DataScience #Visualization #BoxPlot #Statistics #ML #AI


90% misread box plots. Are you one of them? Stop guessing. Start mastering data visuals. 🎯 Learn the truth 👉 koshurai.medium.com/the-ultimate-g… #DataScience #BoxPlot


Which plot can be used to identify both skewness and outliers? Explore our programs and enroll now at: 360digitmg.com #BoxPlot #DataVisualization #OutliersDetection #Skewness #StatisticalAnalysis #DataScience #Analytics #DataInsights #EDA #360DigiTMG

🎧 New Lecture Audio Just Dropped! Using Measures of Position to Describe Variability 📊 From quartiles to box plots, learn how to spot outliers and summarize data like a pro! #ProfElhosseiniSmartSysEng #Statistics #BoxPlot #IQR #DataScience #EDA #AI4Education #SmartStats 🔍📈
The Center and Variability simulation allows students to explore mean, median, range, Interquartile Range, and measures of spread by interacting with different kickers’ unique data distributions from kicks. phet.colorado.edu/en/simulations… #boxPlot #distributions

Dear Data Analysts, Dashboards are great for summaries — box plots are greater. They reveal, without a click: distributions, medians, ranges, and outliers. Dashboards show the big picture. Box plots show the story beneath it. #DataViz #DataAnalytics #boxplot


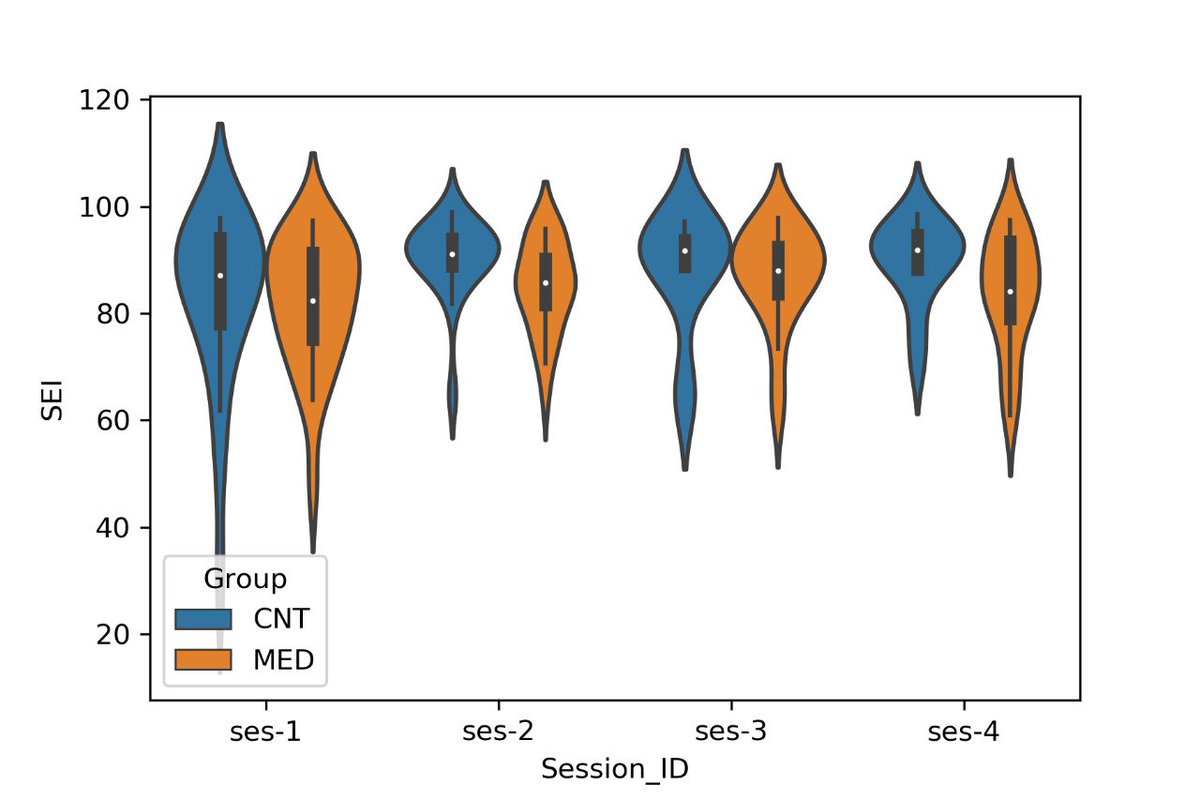
There is a lot of debate over #violin being better than #boxplot. Within the r2.amc.nl #data #science platform for researchers, we like the #raincloud plot, since it combines the best of 3 #plot types: violin, box & jitter. Also #visually #appealing #dataviz


Seaborn Boxplot | How to Make a Box Plot in Python seaborn - Complete E... youtu.be/BmCu2MPKfBY?si… via @YouTube Mathematical explanation of Box plot (although very instense lecture ! :-) #seaborn #boxplot #python #quartiles
youtube.com
YouTube
Seaborn Boxplot | How to Make a Box Plot in Python seaborn - Complete...

A boxplot provides a concise visual summary of data by highlighting its spread, central tendency, and outliers. #Boxplot #DataVisualization #Statistics #DataAnalysis #Outliers #DataSummary #VisualData #DataScience #StatisticalGraphics #DataInterpretation #InsightfulData


You might create a scatter plot to visualize the relationship between study time and exam scores, or a box plot to show the distribution of income levels in a sample. #scatterplot #boxplot


Visualizing summary statistics in a #boxplot is great. But don't forget to explore the underlying data distribution. Thanks to @JustinMatejka for this great educational dataset. #30DayChartChallenge | #Day27 | #educational #dataviz #Rstats #ggplot2 #statistics #violinplot
En estadística es más que habitual (casi preceptivo) la elaboración de gráficos que permitan visualizar y entender mejor los conjuntos de datos. Uno de los más usados, y más desconocidos, es el gráfico de caja (y bigotes) o #boxplot. #EnHebrasMatemáticas Dentro hilo ⬇️⬇️


⛔️ Precauciones con los gráficos de cajas ⚠️ #Boxplot #dataScientist #DataScience #datanalysis #Statistics

Boxplots and violin plots don't agree. I vaguely remember this has something to do with how violin plot source code computes the bounds. Have noticed it in seaborn documentation also. Any inputs/observations? #seaborn #violinplot #boxplot #disagreement #python #dataviz


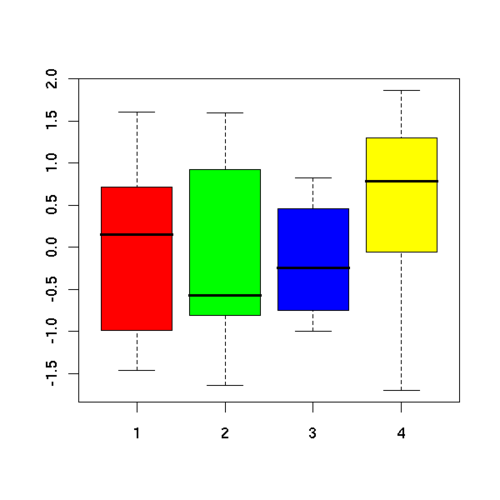
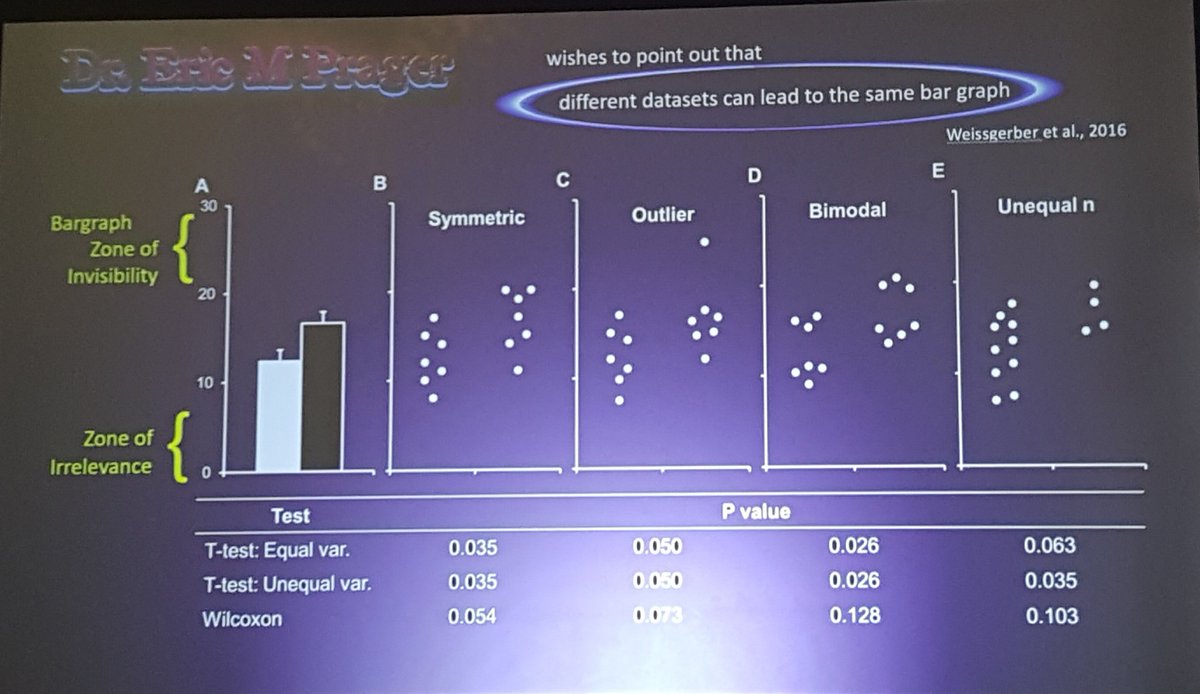
Why NOT to use "dynamite plots"! Four different sets if data look identical when plotted with bar graphs! #boxplot #violinplot #statistics #DrDavidMcArthur #UCNT2019 @Neuroscience @BIRC_at_UCLA @dgsomucla @UCLAHealth @BRI_UCLA @PublicHealth @DOAJplus @OpenAccess

youtube.com/watch?v=-D2ghy… #BANKNIFTYSETUP #BOXPLOT #INTRADAYSETUP #NOINDICATORSNEEDED #SIMPLEANALYSIS


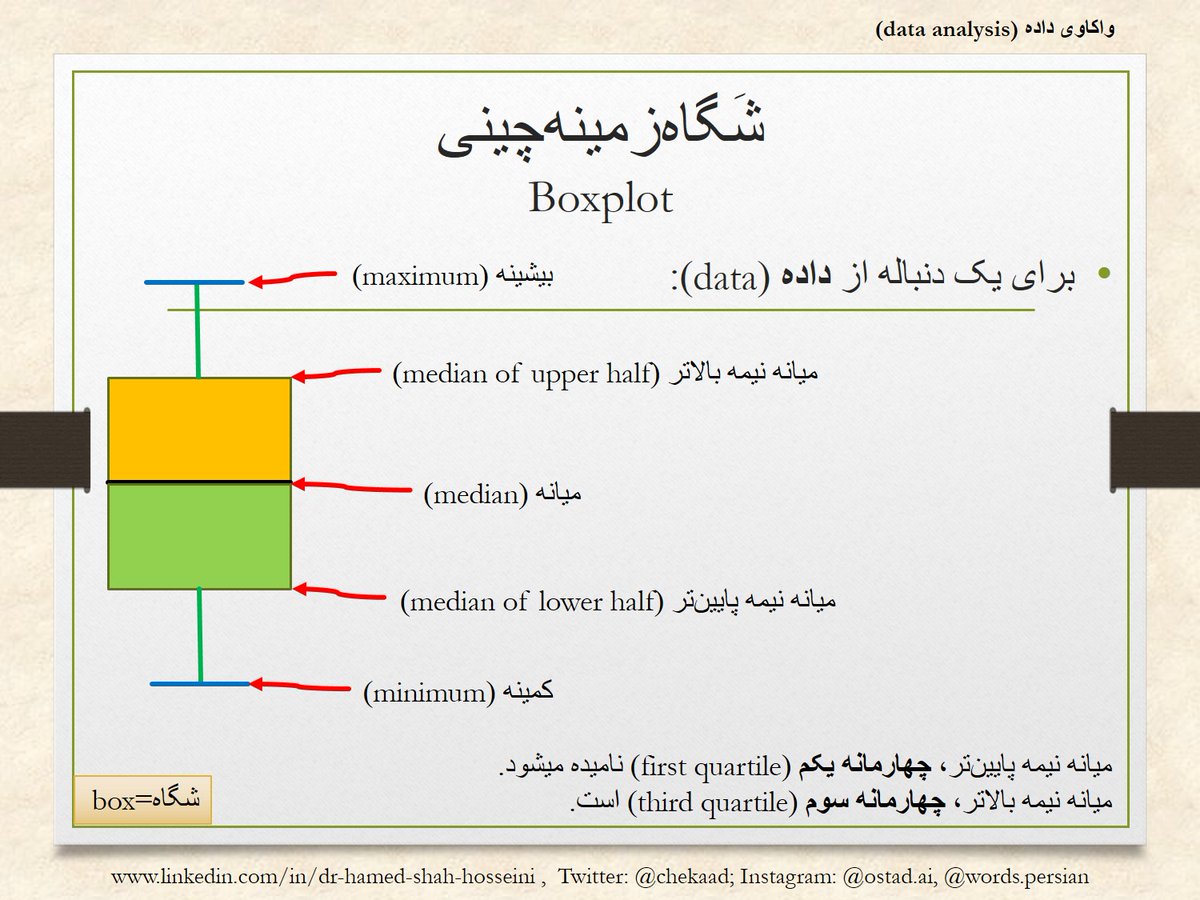
یک راه نمایش داده، زمینهچینی شگاه است؛ در پیکره زیر، سازههای یک #شگاهزمینهچینی آورده شدهاند box=شگاه #boxplot
How do you change the spread of the Y axis of pandas box plot? stackoverflow.com/questions/6713… #matplotlib #pandas #boxplot #python #plot
Plotting boxplot of the log values of the columns stackoverflow.com/questions/7192… #logging #boxplot
How To Boxplot in R (well, that's a presumptuous opening, but I have some simple and achievable ideas at researchgate.net/project/R-and-… #RStats #boxplot #graphics #ExploratoryDataAnalysis For other potentially useful code, github.com/Ratey-AtUWA

Do not use #barplots to plot your data. Here some alternatives: audhalbritter.com/alternatives-t… #rcode #boxplot #violinplot #sinaplot


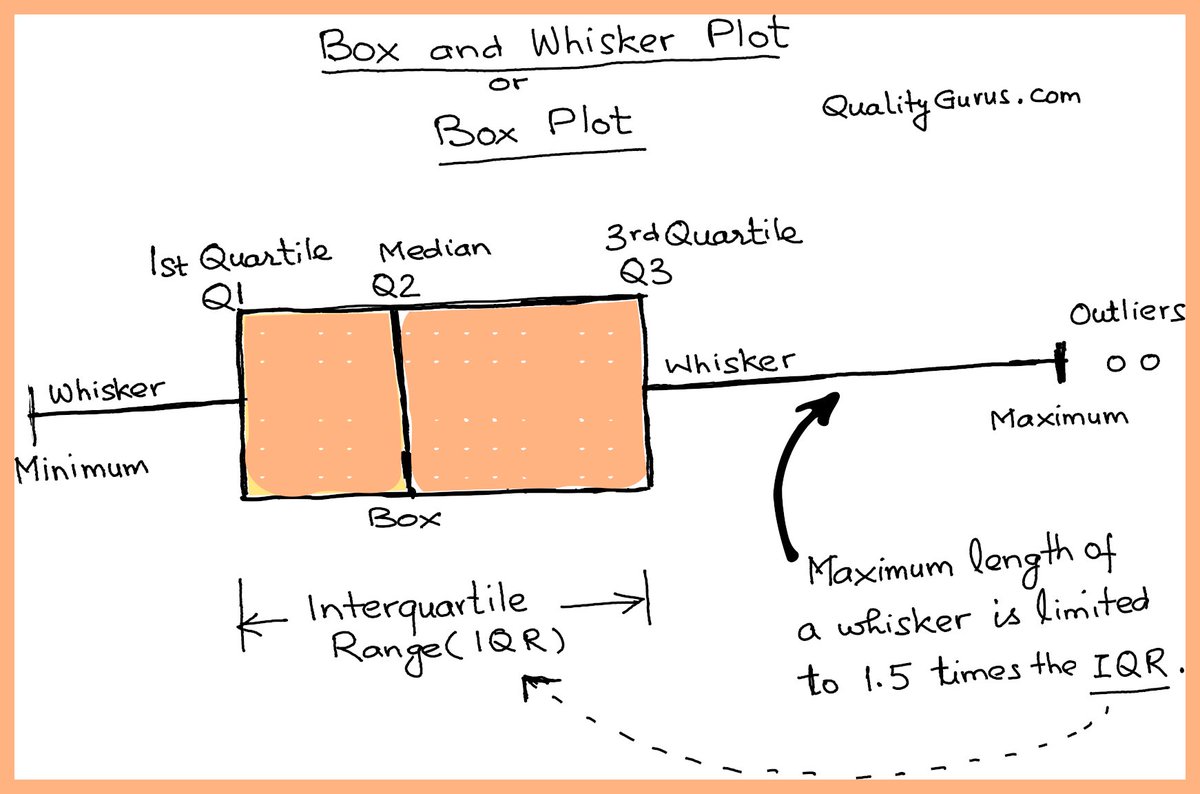
Understanding Box and Whisker Plot (also called Box Plot) #boxplot #matplotlib #seaborn #pandas #minitab #R #Rprogramming #statistics #python #boxandwhiskerplot #datavisualization
Now this is a good #boxplot with important implications: genetic predispositions and habits are correlated to breast cancer insurgence #SIOP2019
Something went wrong.
Something went wrong.
United States Trends
- 1. Elander 2,964 posts
- 2. Wirtz 39.1K posts
- 3. Tosin 8,064 posts
- 4. Danny White 2,522 posts
- 5. Ajax 67.5K posts
- 6. Tony Vitello 11.7K posts
- 7. $TSLA 42.6K posts
- 8. Caicedo 17.4K posts
- 9. East Wing 138K posts
- 10. #YesOnProp50 5,420 posts
- 11. Estevao 22.4K posts
- 12. Enzo 27.7K posts
- 13. Ekitike 22.6K posts
- 14. SNAP 655K posts
- 15. Frankfurt 43.8K posts
- 16. Frank Anderson N/A
- 17. Juve 16.7K posts
- 18. Vini 17.9K posts
- 19. Hamburger Helper N/A
- 20. Vicario 1,906 posts