#ggplot2 search results
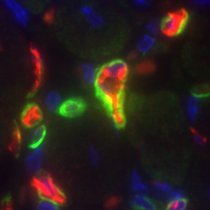
#ggkegg, an extension of #ggplot2 #R to visualize KEGG MODULE/PATHWAY bioconductor.org/packages/relea… Compatible with bulk & scRNAseq & microbiome data Seiya Imoto lab Bioinformatics 2023 academic.oup.com/bioinformatics…


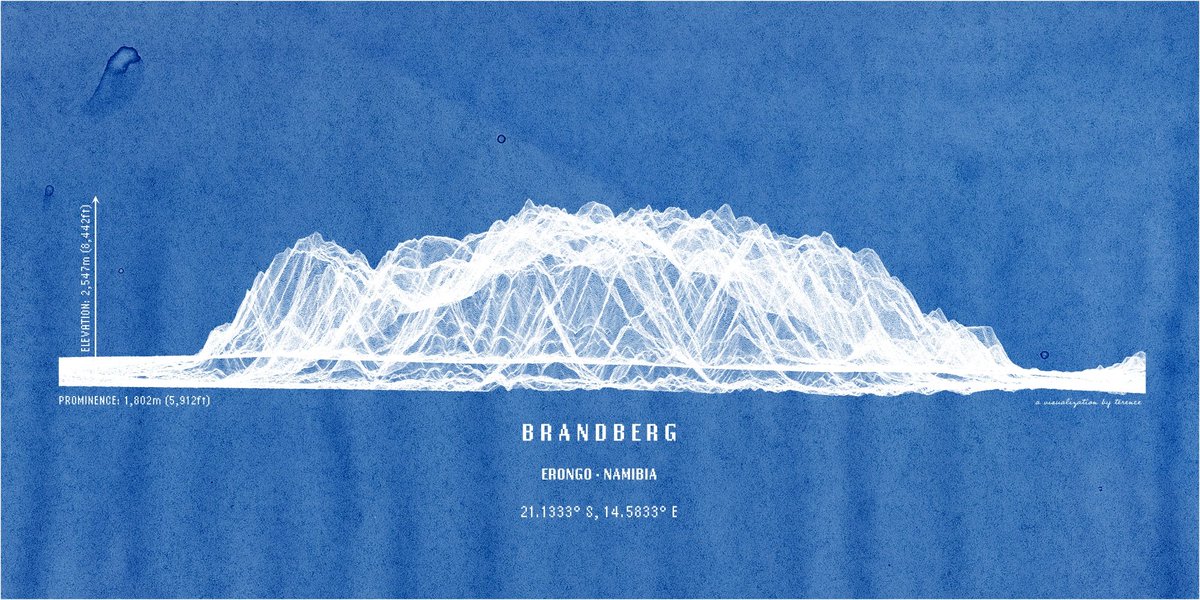
Namibia's highest mountain, the Brandberg. In lines. Anything else you'd like to see? #ggplot2 adventures, an #rstats tale

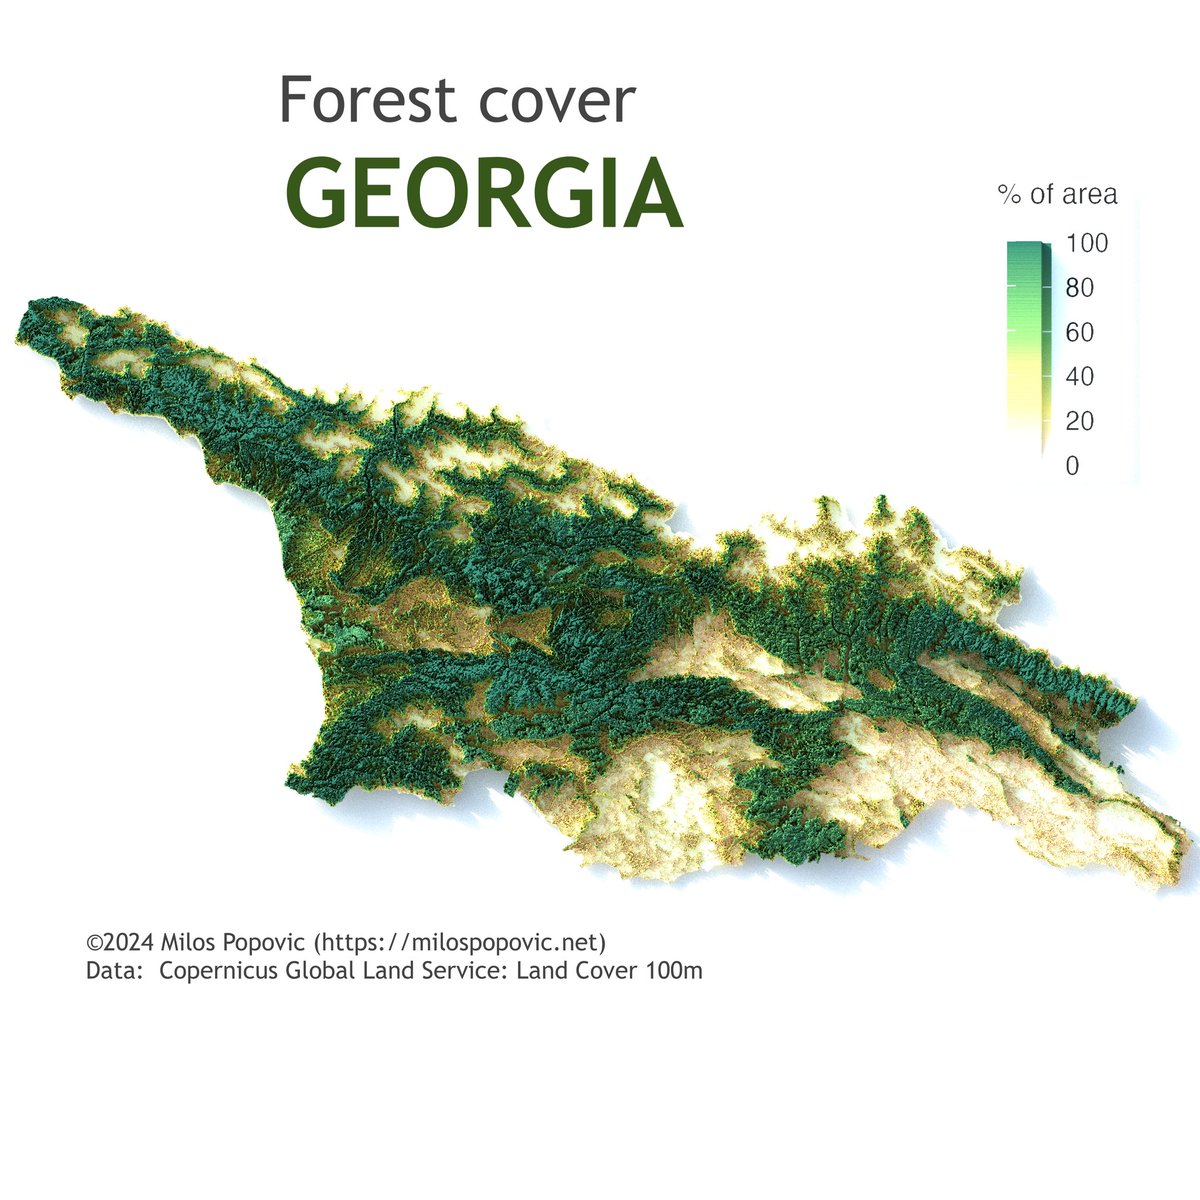
👋 Hi friends! Check out Georgia's 🇬🇪 natural beauty in my 2019 forest cover map. 🌳 I've used Copernicus data to showcase the country's forest richness. 🌲 Interested in map-making with R? My tutorial with #ggplot2 and #rayshader makes it accessible and fun. 🗺️ Begin mapping…

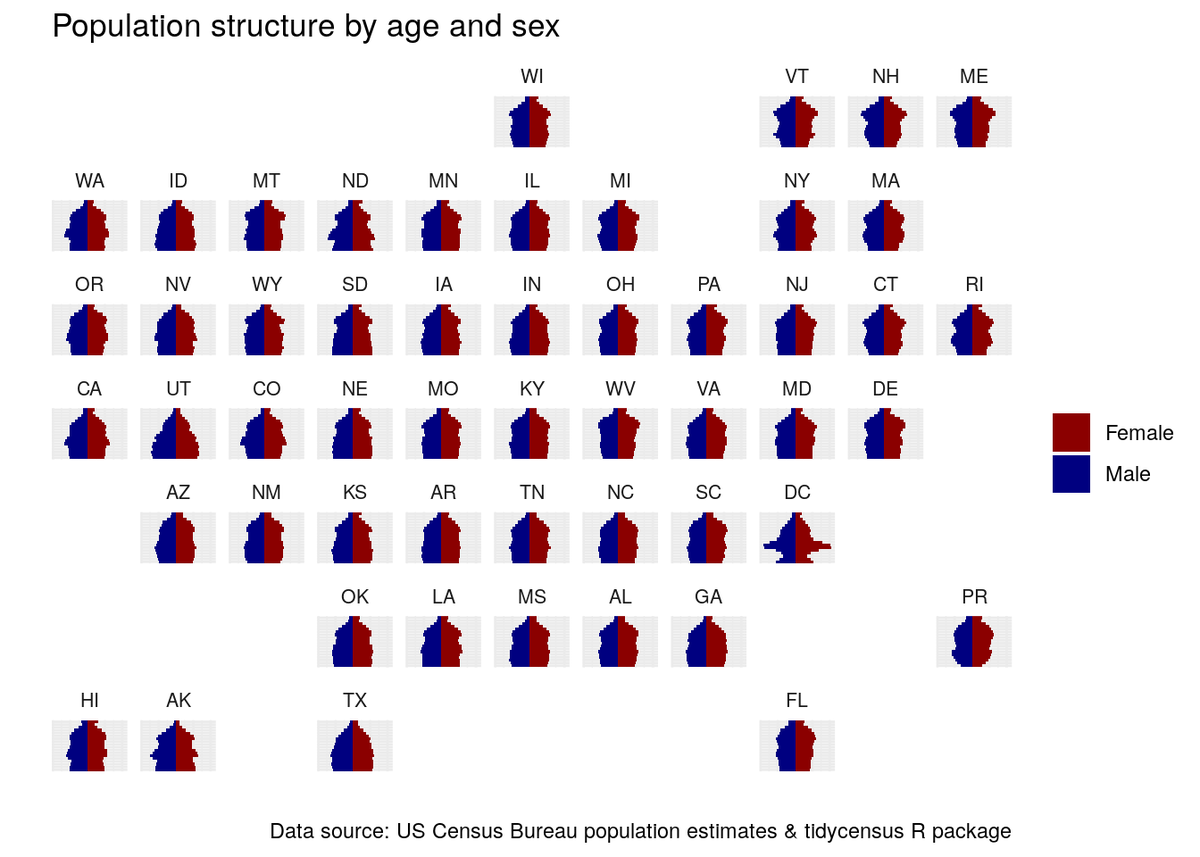
Want to learn #dataviz with #ggplot2 and #rstats, but with real-world data instead of built-in datasets? Check out Chapter 4 of my book Analyzing US Census Data, which helps you learn ggplot2 with step-by-step examples from the US Census. walker-data.com/census-r/explo…


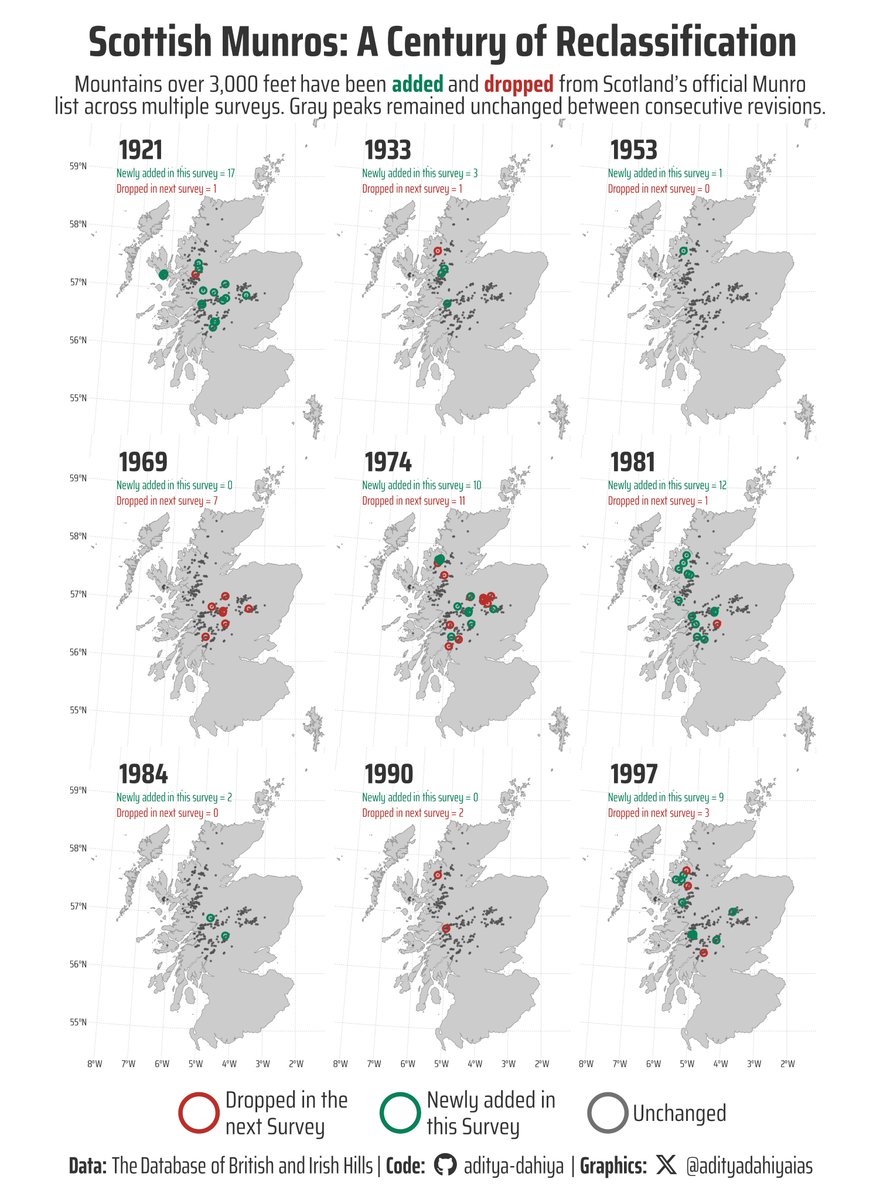
#TidyTuesday Used {sf} for mapping Scottish Munros, custom helper functions to track changes across survey years, and {ggtext} for rich formatting in a cartographic viz! Data: @nrennie35 Code 🔗 tinyurl.com/tidy-scot-munr… Made with #RStats #ggplot2

#TidyTuesday pushing #ggplot2 boundaries with income inequality dumbbell chart! 🔧 segments with a gradient effect, custom legend & HTML-styled text annotations. Data: @OurWorldInData @JoeHasell Full code 📷 tinyurl.com/tidy-gini-dumb… Made with #rstats #DataViz #ggnewscale


Does anyone know how to nudge the text off the points an equal distance across facets of unequal levels? ##ggplot2 #rstats


Just figured out how to allow for different x-axis labels when using facet_warp(). The trick has a few steps, which I've annotated in the code below. #ggplot2 #RStats


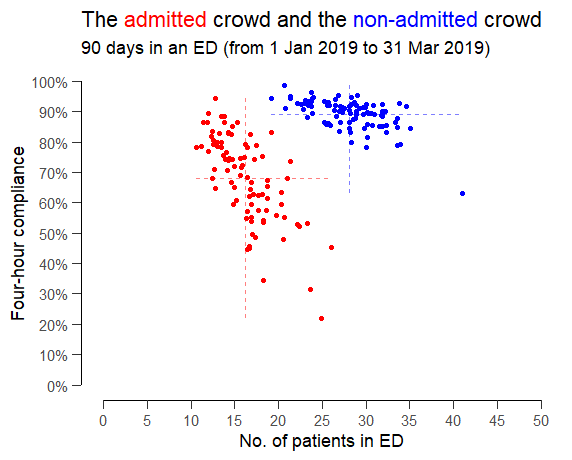
Someone suggested exploring the relationship between ED crowding and four-hour compliance but splitting the patients into (red) admitted patients and (blue) non-admitted patients as if they were two completely separate queues that didn't interact with each other. #rstats #ggplot2

Fun with #ggplot2 and splines; recent trend of total rad onc in 🇺🇸, ggplot gives the best #dataviz hands down


.Ok @AOC, @frankiethull and I have created a package to help building #ggplot2 plots like yours in #rstats

Yosemite Valley in lines. This was more challenging to do; probably needs more fiddling around so consider this a WIP. Feedback welcome, as always. #ggplot2 adventures, an #rstats tale

📊 #TidyTuesday Visualizing crane observation patterns at Lake Hornborgasjön (1994-2024) 🦩 Spring: Daily counts (all 7 days) 🍂 Autumn: Select days only (2000s+) 📈 Trend: Rising observations Code 🔗 tinyurl.com/tidy-cranes-la… Made with #RStats #ggplot2


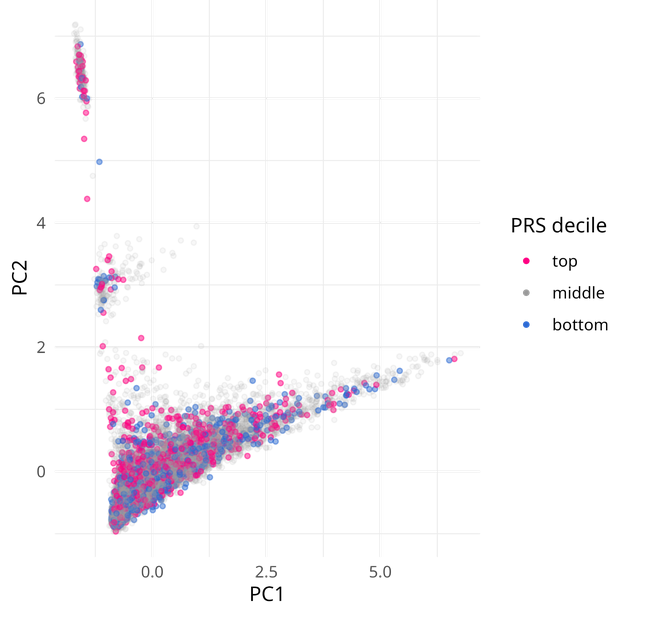
TIL you can set different values of alpha based on categories on #ggplot2. Set 'aes(alpha = categories_col)', and then use scale_alpha_manual() to set specific transparency proportions. I used a lower alpha in order to visualize the most important categories here. #rstats


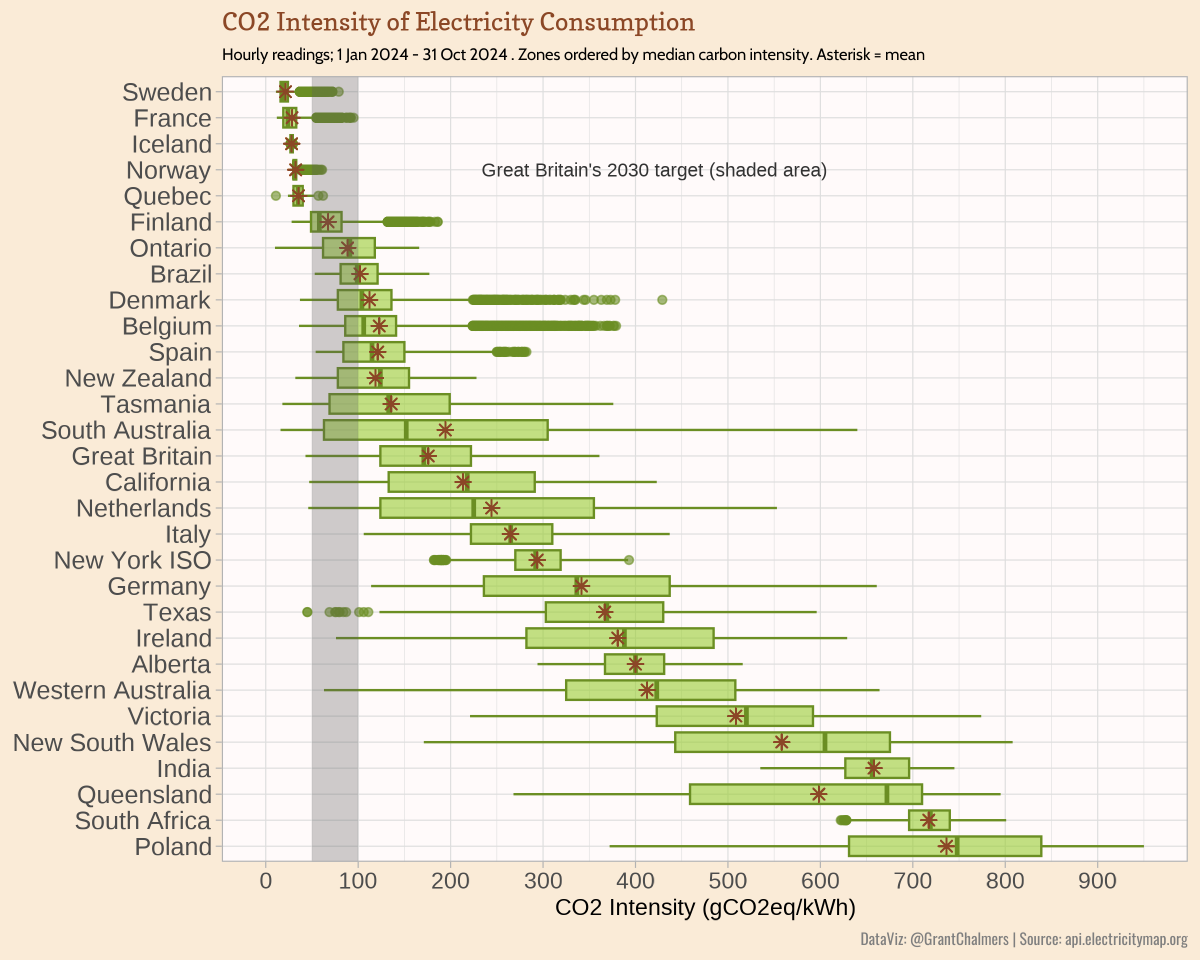
CO2 Intensity of Electricity consumption. Hourly readings Jan-Oct 2024. #rstats #ggplot2 #cleanenergy #energytwitter h/t @ElectricityMaps @Bowenchris @AlboMP


🎨 ggsci 4.0.0 released with 400+ new color palettes! New discrete color palettes from Primer, Atlassian, and iterm2-color-schemes for ggplot2. Upgrade your scientific visualizations with publication-ready color schemes #DataViz #ggplot2 #Rstats nanx.me/blog/post/ggsc…


#TidyTuesday Map of elite basketball clubs in Europe with {ggimage}, {ggplot2}, {magick}, {ggrepel} and {ggtext}. Data: @EuroLeague Full Code 🔗 tinyurl.com/tidy-euro-bskt… Made with #rstats #ggplot2


📊 #TidyTuesday Visualizing crane observation patterns at Lake Hornborgasjön (1994-2024) 🦩 Spring: Daily counts (all 7 days) 🍂 Autumn: Select days only (2000s+) 📈 Trend: Rising observations Code 🔗 tinyurl.com/tidy-cranes-la… Made with #RStats #ggplot2


[R CHARTS] 📊📈 Featuring over 1400 R plots with reproducible code! 🥳 🔗 r-charts.com/ggplot2/ #Rstats #ggplot2
![RCoderWeb's tweet image. [R CHARTS] 📊📈 Featuring over 1400 R plots with reproducible code! 🥳
🔗 r-charts.com/ggplot2/
#Rstats #ggplot2](https://pbs.twimg.com/media/GYU9VqgXsAAFybf.jpg)
![RCoderWeb's tweet image. [R CHARTS] 📊📈 Featuring over 1400 R plots with reproducible code! 🥳
🔗 r-charts.com/ggplot2/
#Rstats #ggplot2](https://pbs.twimg.com/media/GYU9Z1uW8AAWNFH.jpg)
Namibia's highest mountain, the Brandberg. In lines. Anything else you'd like to see? #ggplot2 adventures, an #rstats tale
#ggkegg, an extension of #ggplot2 #R to visualize KEGG MODULE/PATHWAY bioconductor.org/packages/relea… Compatible with bulk & scRNAseq & microbiome data Seiya Imoto lab Bioinformatics 2023 academic.oup.com/bioinformatics…
👋 Hi friends! Check out Georgia's 🇬🇪 natural beauty in my 2019 forest cover map. 🌳 I've used Copernicus data to showcase the country's forest richness. 🌲 Interested in map-making with R? My tutorial with #ggplot2 and #rayshader makes it accessible and fun. 🗺️ Begin mapping…
🌍 Ever wondered how much of humanity lives near water? An analysis on global patterns. Island nations: have 100% of population within 1 km of major water body, while some countries have <1% !! Full Code 🔗 tinyurl.com/pop-near-water Made with #rstats #terra & #ggplot2 #DataViz

TIL you can set different values of alpha based on categories on #ggplot2. Set 'aes(alpha = categories_col)', and then use scale_alpha_manual() to set specific transparency proportions. I used a lower alpha in order to visualize the most important categories here. #rstats
Want to learn #dataviz with #ggplot2 and #rstats, but with real-world data instead of built-in datasets? Check out Chapter 4 of my book Analyzing US Census Data, which helps you learn ggplot2 with step-by-step examples from the US Census. walker-data.com/census-r/explo…
#TidyTuesday pushing #ggplot2 boundaries with income inequality dumbbell chart! 🔧 segments with a gradient effect, custom legend & HTML-styled text annotations. Data: @OurWorldInData @JoeHasell Full code 📷 tinyurl.com/tidy-gini-dumb… Made with #rstats #DataViz #ggnewscale
Yosemite Valley in lines. This was more challenging to do; probably needs more fiddling around so consider this a WIP. Feedback welcome, as always. #ggplot2 adventures, an #rstats tale
Does anyone know how to nudge the text off the points an equal distance across facets of unequal levels? ##ggplot2 #rstats
#TidyTuesday Used {sf} for mapping Scottish Munros, custom helper functions to track changes across survey years, and {ggtext} for rich formatting in a cartographic viz! Data: @nrennie35 Code 🔗 tinyurl.com/tidy-scot-munr… Made with #RStats #ggplot2
🗺️ Mapping Europe's energy pivot: Russian gas imports before/after Ukraine war. #ggplot2 techniques for Choropleth (% dependency) with overlaid Scatter pies (absolute volumes). Data: @EU_Eurostat Full code 🔗 tinyurl.com/chloro-sctr-pi… Made with #RStats #scatterpie #dataviz

#30DayMapChallenge · Day 19 · Typography. Had a few ideas but don't know how to use Illustrator so this viz of North America's elevation using only characters will do. Inspired and made possible by @nrennie35 and @infowetrust. #ggplot2 adventures, an #rstats tale


#TidyTuesday Map of global climate attribution studies using 📍 {sf} for geospatial magic +🥧 {scatterpie} for proportional pie charts on maps. Data: @CarbonBrief Full Code 🔗 tinyurl.com/tidy-extr-wthr Made with #rstats and #ggplot2

Something went wrong.
Something went wrong.
United States Trends
- 1. Bears 89.7K posts
- 2. Jake Moody 13.7K posts
- 3. Snell 24.4K posts
- 4. Caleb 49.5K posts
- 5. Bills 142K posts
- 6. Falcons 51.4K posts
- 7. Josh Allen 26.7K posts
- 8. Jayden 23K posts
- 9. phil 177K posts
- 10. #BearDown 2,383 posts
- 11. Happy Birthday Charlie Kirk 4,893 posts
- 12. Swift 291K posts
- 13. Joji 30.2K posts
- 14. Ben Johnson 4,450 posts
- 15. Turang 4,332 posts
- 16. #Dodgers 15.4K posts
- 17. Troy Aikman 6,557 posts
- 18. Roki 6,132 posts
- 19. Bijan 33K posts
- 20. AFC East 10.9K posts