#ggplot2 搜索结果
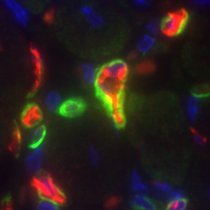
#ggkegg, an extension of #ggplot2 #R to visualize KEGG MODULE/PATHWAY bioconductor.org/packages/relea… Compatible with bulk & scRNAseq & microbiome data Seiya Imoto lab Bioinformatics 2023 academic.oup.com/bioinformatics…


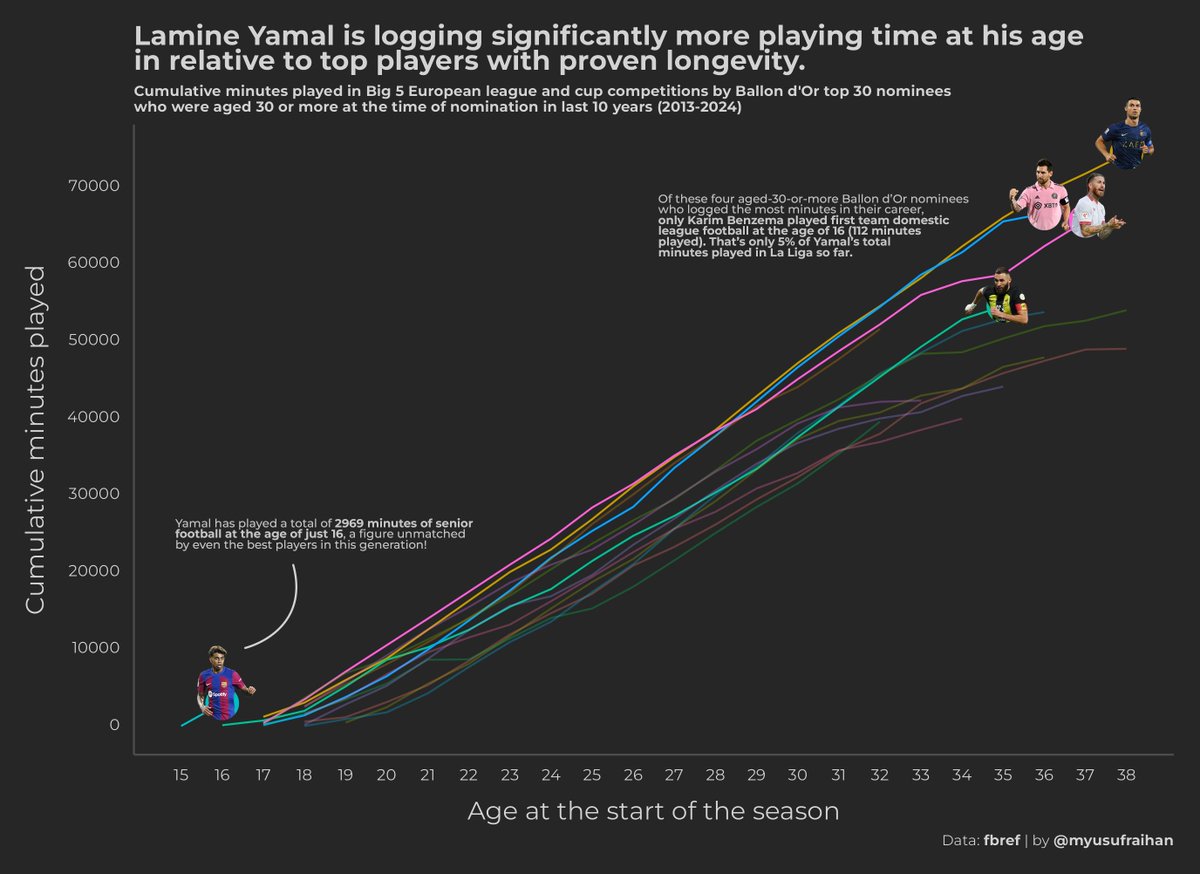

Namibia's highest mountain, the Brandberg. In lines. Anything else you'd like to see? #ggplot2 adventures, an #rstats tale

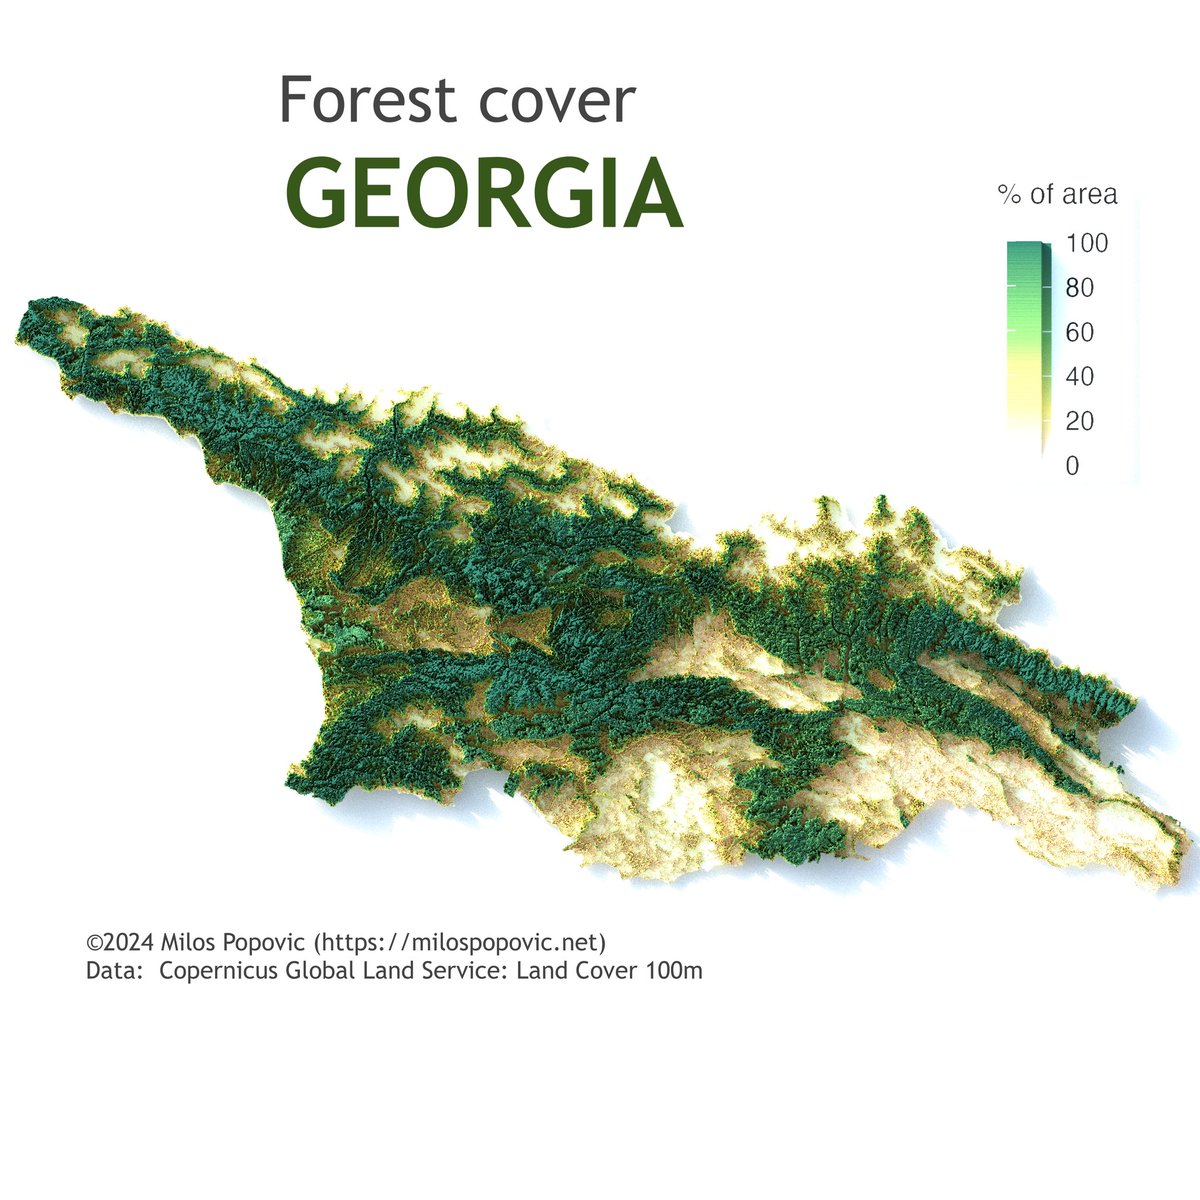
👋 Hi friends! Check out Georgia's 🇬🇪 natural beauty in my 2019 forest cover map. 🌳 I've used Copernicus data to showcase the country's forest richness. 🌲 Interested in map-making with R? My tutorial with #ggplot2 and #rayshader makes it accessible and fun. 🗺️ Begin mapping…

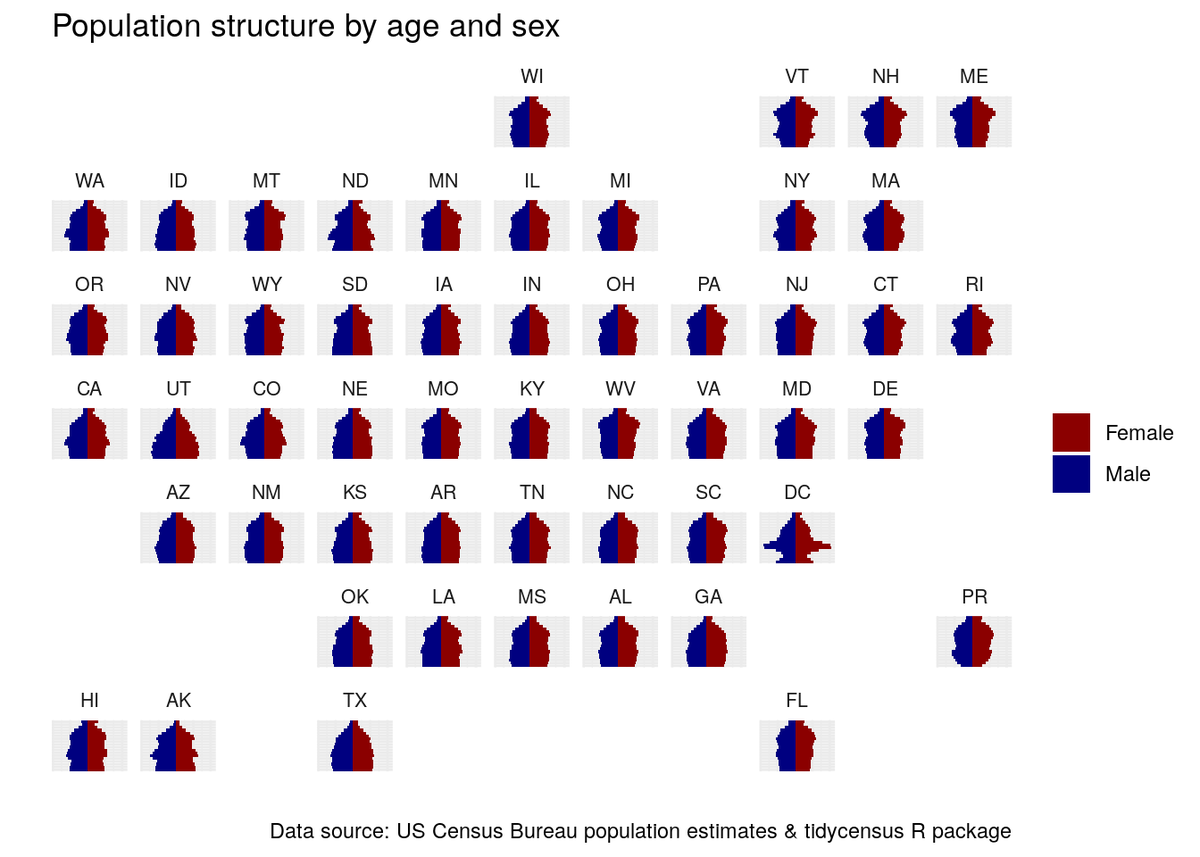
Want to learn #dataviz with #ggplot2 and #rstats, but with real-world data instead of built-in datasets? Check out Chapter 4 of my book Analyzing US Census Data, which helps you learn ggplot2 with step-by-step examples from the US Census. walker-data.com/census-r/explo…


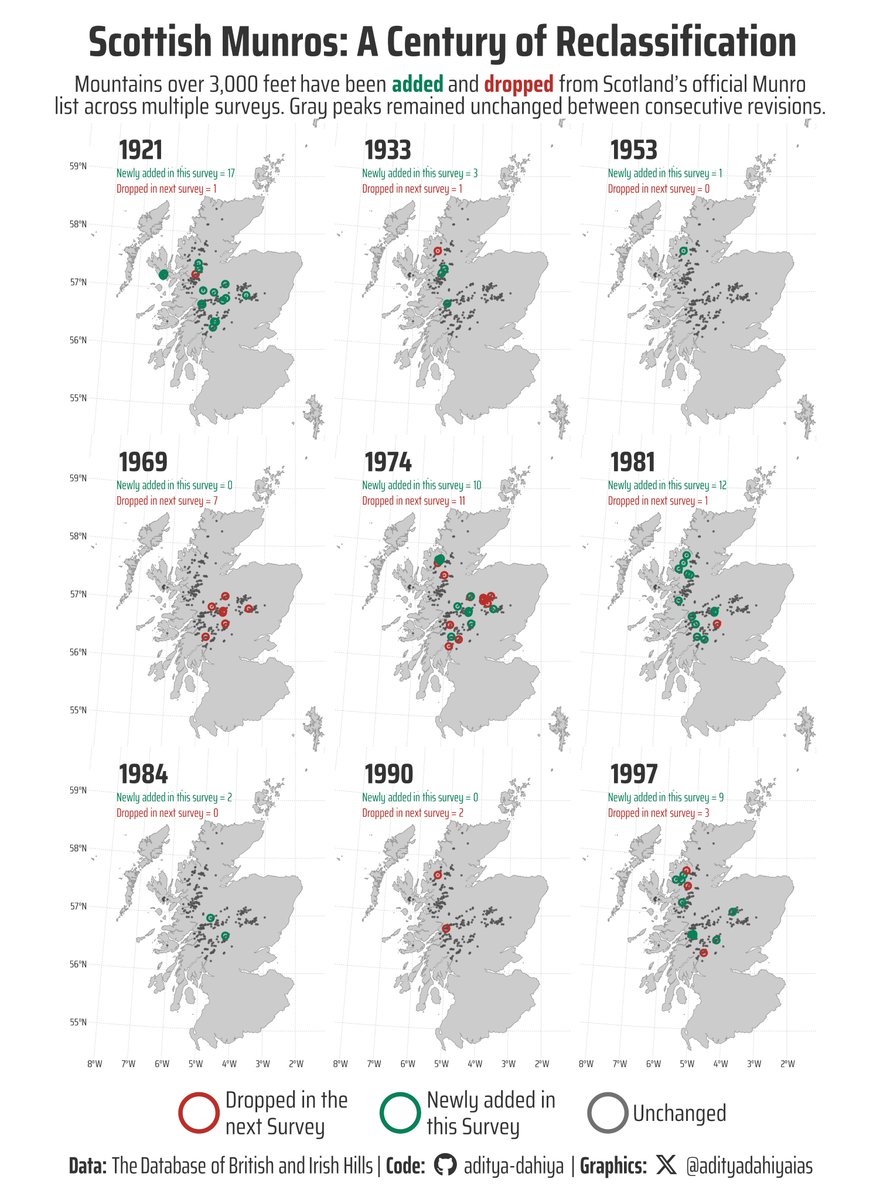
#TidyTuesday Used {sf} for mapping Scottish Munros, custom helper functions to track changes across survey years, and {ggtext} for rich formatting in a cartographic viz! Data: @nrennie35 Code 🔗 tinyurl.com/tidy-scot-munr… Made with #RStats #ggplot2


Does anyone know how to nudge the text off the points an equal distance across facets of unequal levels? ##ggplot2 #rstats


Just figured out how to allow for different x-axis labels when using facet_warp(). The trick has a few steps, which I've annotated in the code below. #ggplot2 #RStats


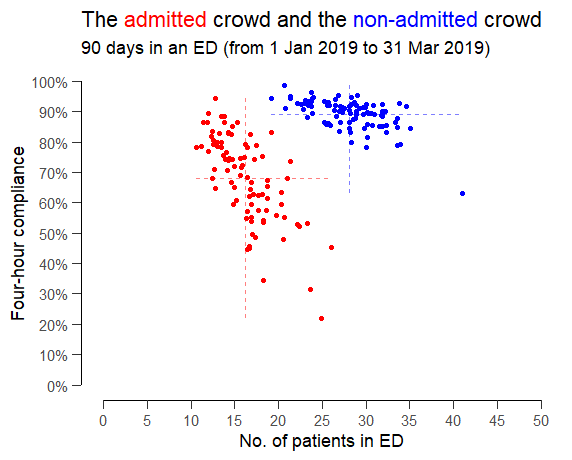
Someone suggested exploring the relationship between ED crowding and four-hour compliance but splitting the patients into (red) admitted patients and (blue) non-admitted patients as if they were two completely separate queues that didn't interact with each other. #rstats #ggplot2

Fun with #ggplot2 and splines; recent trend of total rad onc in 🇺🇸, ggplot gives the best #dataviz hands down


.Ok @AOC, @frankiethull and I have created a package to help building #ggplot2 plots like yours in #rstats

Yosemite Valley in lines. This was more challenging to do; probably needs more fiddling around so consider this a WIP. Feedback welcome, as always. #ggplot2 adventures, an #rstats tale


📊 #TidyTuesday Visualizing crane observation patterns at Lake Hornborgasjön (1994-2024) 🦩 Spring: Daily counts (all 7 days) 🍂 Autumn: Select days only (2000s+) 📈 Trend: Rising observations Code 🔗 tinyurl.com/tidy-cranes-la… Made with #RStats #ggplot2


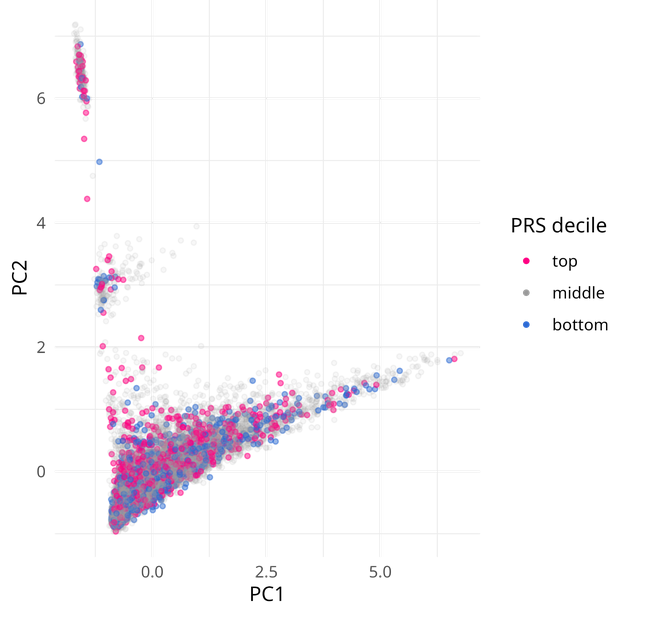
TIL you can set different values of alpha based on categories on #ggplot2. Set 'aes(alpha = categories_col)', and then use scale_alpha_manual() to set specific transparency proportions. I used a lower alpha in order to visualize the most important categories here. #rstats


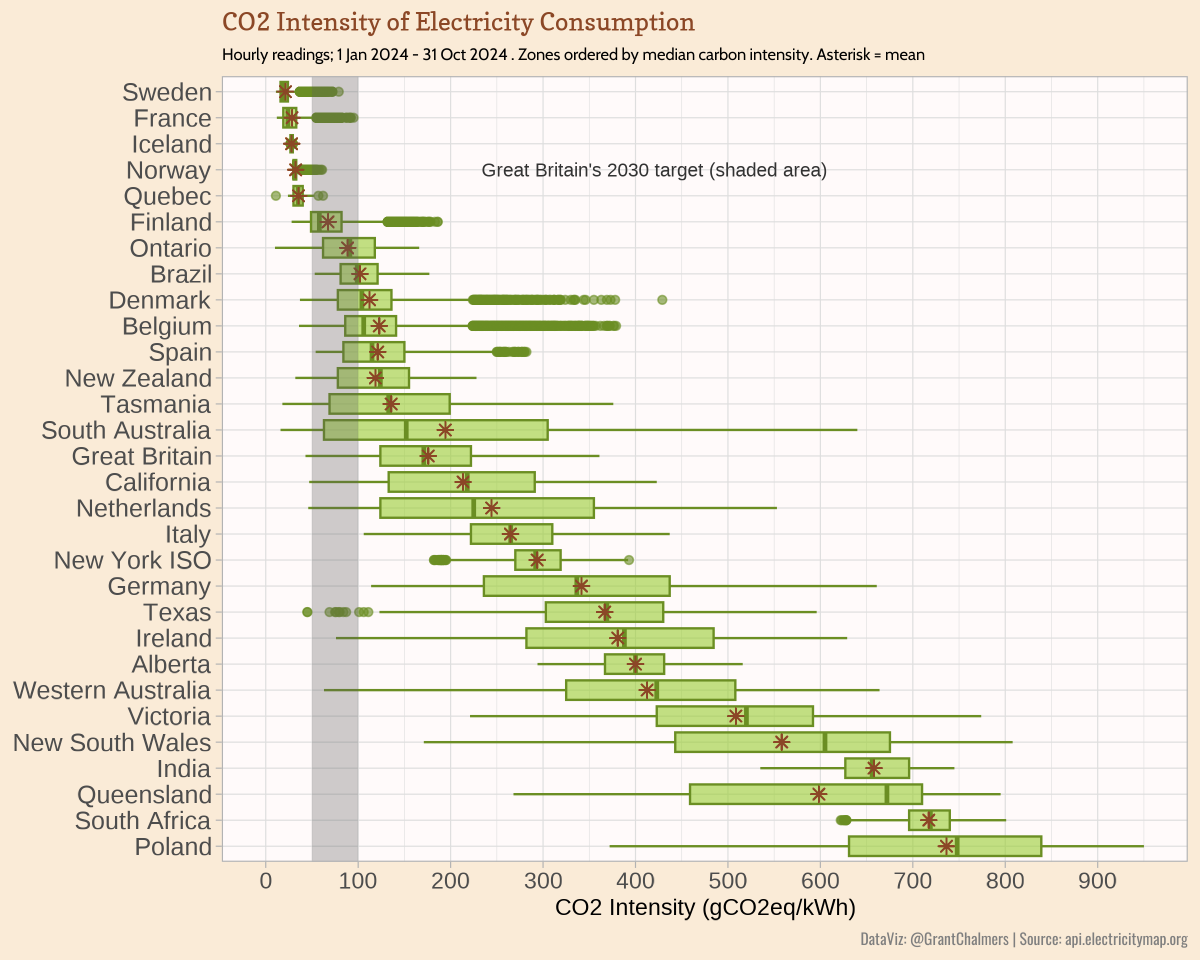
CO2 Intensity of Electricity consumption. Hourly readings Jan-Oct 2024. #rstats #ggplot2 #cleanenergy #energytwitter h/t @ElectricityMaps @Bowenchris @AlboMP
Percentage of electricity generation from low-carbon sources in 2024, via Statistical Review of World Energy June 2025. #rstats #ggplot2 #tidyverse #cleanenergy #energy #datavisualisation


🎨 ggsci 4.0.0 released with 400+ new color palettes! New discrete color palettes from Primer, Atlassian, and iterm2-color-schemes for ggplot2. Upgrade your scientific visualizations with publication-ready color schemes #DataViz #ggplot2 #Rstats nanx.me/blog/post/ggsc…


#TidyTuesday Map of elite basketball clubs in Europe with {ggimage}, {ggplot2}, {magick}, {ggrepel} and {ggtext}. Data: @EuroLeague Full Code 🔗 tinyurl.com/tidy-euro-bskt… Made with #rstats #ggplot2


📊 #TidyTuesday Visualizing crane observation patterns at Lake Hornborgasjön (1994-2024) 🦩 Spring: Daily counts (all 7 days) 🍂 Autumn: Select days only (2000s+) 📈 Trend: Rising observations Code 🔗 tinyurl.com/tidy-cranes-la… Made with #RStats #ggplot2


👉 Extensiones más fáciles: gg_par(), make_constructor(), complete_theme() y nuevos elementos de tema para puntos y polígonos. 👉 Sistema S7: más robusto y estricto en validación de tipos, con nuevas posibilidades para extensiones. #RStats #DataVisualization #ggplot2 #Tidyverse


#ggkegg, an extension of #ggplot2 #R to visualize KEGG MODULE/PATHWAY bioconductor.org/packages/relea… Compatible with bulk & scRNAseq & microbiome data Seiya Imoto lab Bioinformatics 2023 academic.oup.com/bioinformatics…
Namibia's highest mountain, the Brandberg. In lines. Anything else you'd like to see? #ggplot2 adventures, an #rstats tale
👋 Hi friends! Check out Georgia's 🇬🇪 natural beauty in my 2019 forest cover map. 🌳 I've used Copernicus data to showcase the country's forest richness. 🌲 Interested in map-making with R? My tutorial with #ggplot2 and #rayshader makes it accessible and fun. 🗺️ Begin mapping…
Want to learn #dataviz with #ggplot2 and #rstats, but with real-world data instead of built-in datasets? Check out Chapter 4 of my book Analyzing US Census Data, which helps you learn ggplot2 with step-by-step examples from the US Census. walker-data.com/census-r/explo…
Yosemite Valley in lines. This was more challenging to do; probably needs more fiddling around so consider this a WIP. Feedback welcome, as always. #ggplot2 adventures, an #rstats tale
Does anyone know how to nudge the text off the points an equal distance across facets of unequal levels? ##ggplot2 #rstats
#30DayMapChallenge · Day 19 · Typography. Had a few ideas but don't know how to use Illustrator so this viz of North America's elevation using only characters will do. Inspired and made possible by @nrennie35 and @infowetrust. #ggplot2 adventures, an #rstats tale


Just figured out how to allow for different x-axis labels when using facet_warp(). The trick has a few steps, which I've annotated in the code below. #ggplot2 #RStats

The #DiatoViz package provides a simple function to add silhouettes of #diatoms to plots generated #ggplot2. Great work by @junqueiragaabi junqueiragaabi.github.io/DiatoViz/
Largest 5-year deployments of low-carbon electricity generation via Statistical Review of World Energy June 2023. Bold text indicates most recent period. #rstats #ggplot2 #electricity #cleanenergy #visualisation

CO2 Intensity of Electricity consumption. Hourly readings Jan-Oct 2024. #rstats #ggplot2 #cleanenergy #energytwitter h/t @ElectricityMaps @Bowenchris @AlboMP
Fun with #ggplot2 and splines; recent trend of total rad onc in 🇺🇸, ggplot gives the best #dataviz hands down
Percentage of electricity generation from low-carbon sources in 2024, via Statistical Review of World Energy June 2025. #rstats #ggplot2 #tidyverse #cleanenergy #energy #datavisualisation
TIL you can set different values of alpha based on categories on #ggplot2. Set 'aes(alpha = categories_col)', and then use scale_alpha_manual() to set specific transparency proportions. I used a lower alpha in order to visualize the most important categories here. #rstats
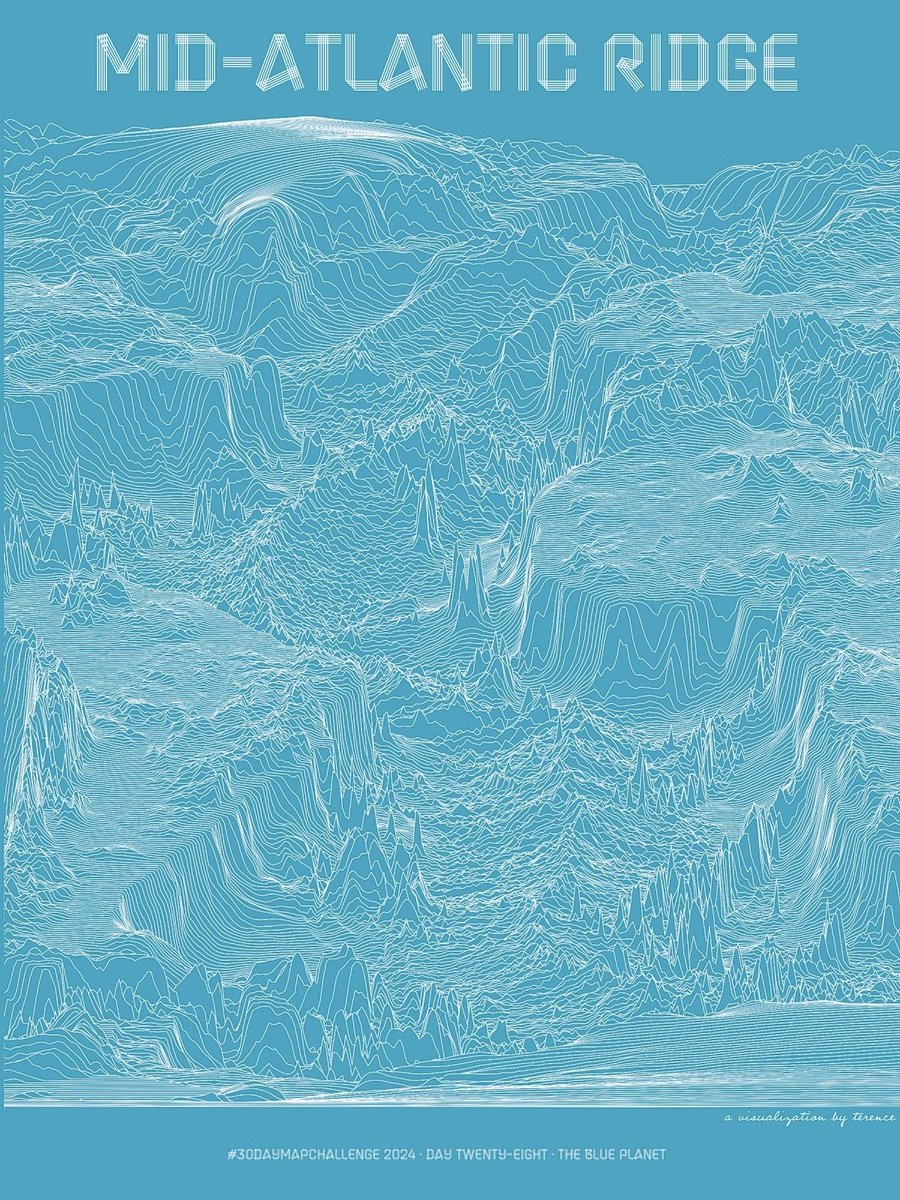
#30DayMapChallenge · Day 28 · The blue planet. I've shared the Mid-Atlantic Ridge in shaded relief. And I've shared it in hexagons. Now see it in lines. #ggplot2 adventures, an #rstats tale
Something went wrong.
Something went wrong.
United States Trends
- 1. Columbus 139K posts
- 2. President Trump 1.02M posts
- 3. Middle East 234K posts
- 4. #IndigenousPeoplesDay 9,718 posts
- 5. Brian Callahan 4,817 posts
- 6. Seth 46.1K posts
- 7. $BURU 1,034 posts
- 8. Thanksgiving 52.5K posts
- 9. #WWERaw 52K posts
- 10. Macron 199K posts
- 11. Marc 45.9K posts
- 12. Darius Smith 3,487 posts
- 13. HAZBINTOOZ 4,043 posts
- 14. Shildt 2,452 posts
- 15. Apple TV 4,907 posts
- 16. Egypt 241K posts
- 17. Vrabel 6,010 posts
- 18. Titans 34.7K posts
- 19. Cape Verde 3,792 posts
- 20. Flip 51.8K posts