#ggplot Suchergebnisse

Finally, beautiful arrows in #ggplot #rstats (I cringe whenever I have to draw arrows in base R) teunbrand.github.io/ggarrow/


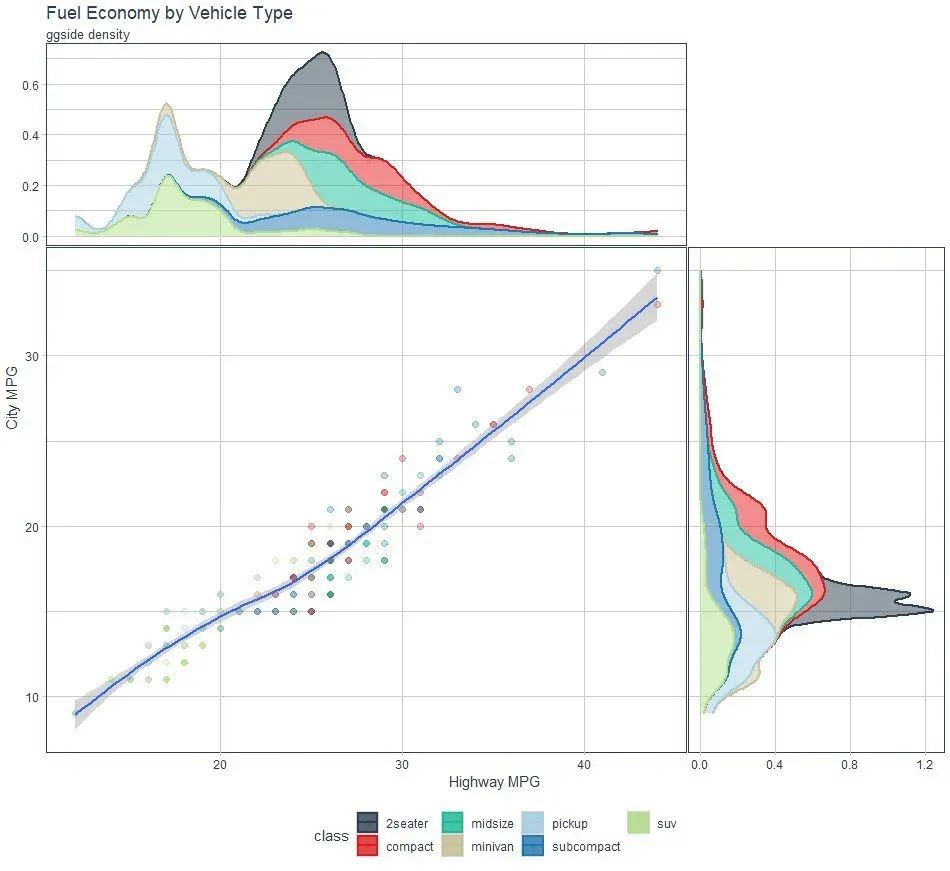
I'm in love with this package and I don't care who knows it. #ggside is insane for making side plots with #ggplot. You can make marginal distributions, side-box plots, & many other #ggplot2 geoms. Learn more: buff.ly/3OVfwgV #rstats #datascience

🎯 12 TOP 📦 #RStats para ahorrar horas de trabajo en tus análisis de datos 👀 1. Crea gráficos #ggplot de forma interactiva 📦 esquisse, recupera el código para reproducir el gráfico 2. Elige los colores para tus gráficos de forma interactiva 📦 colourpicker #dataviz #stats

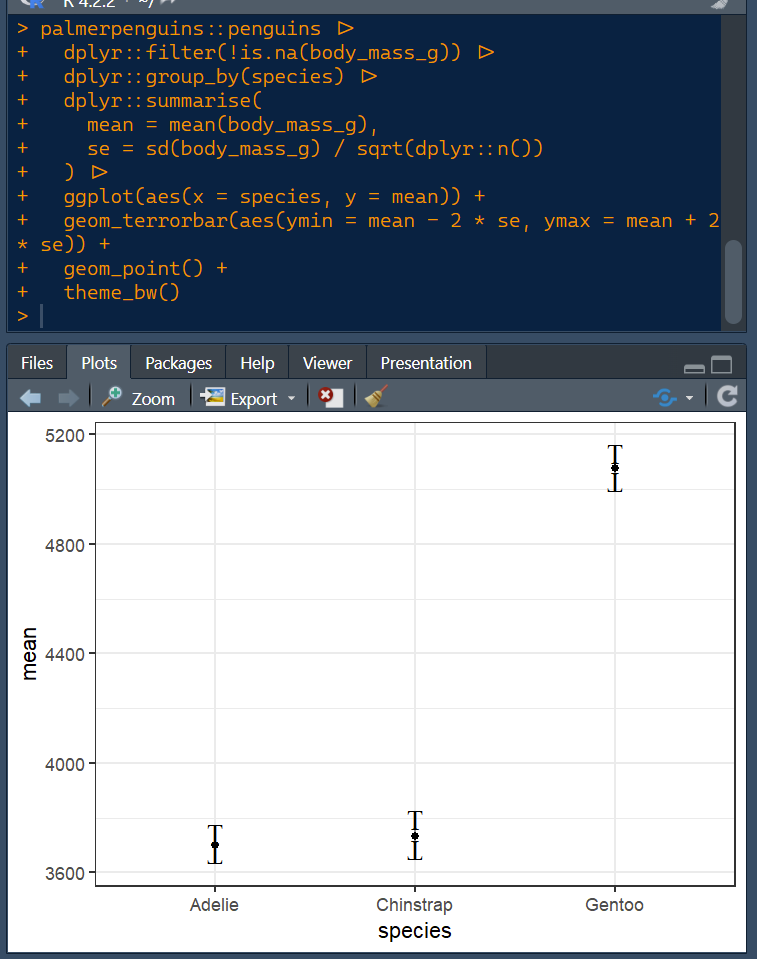
With my geom_terrorbar() you too can now use Ts for errorbars just like they did in that genius paper! Read more in my latest blog post mival.netlify.app/blog/2023/01/i… Happy new year! #Rstats #ggplot #hindawi

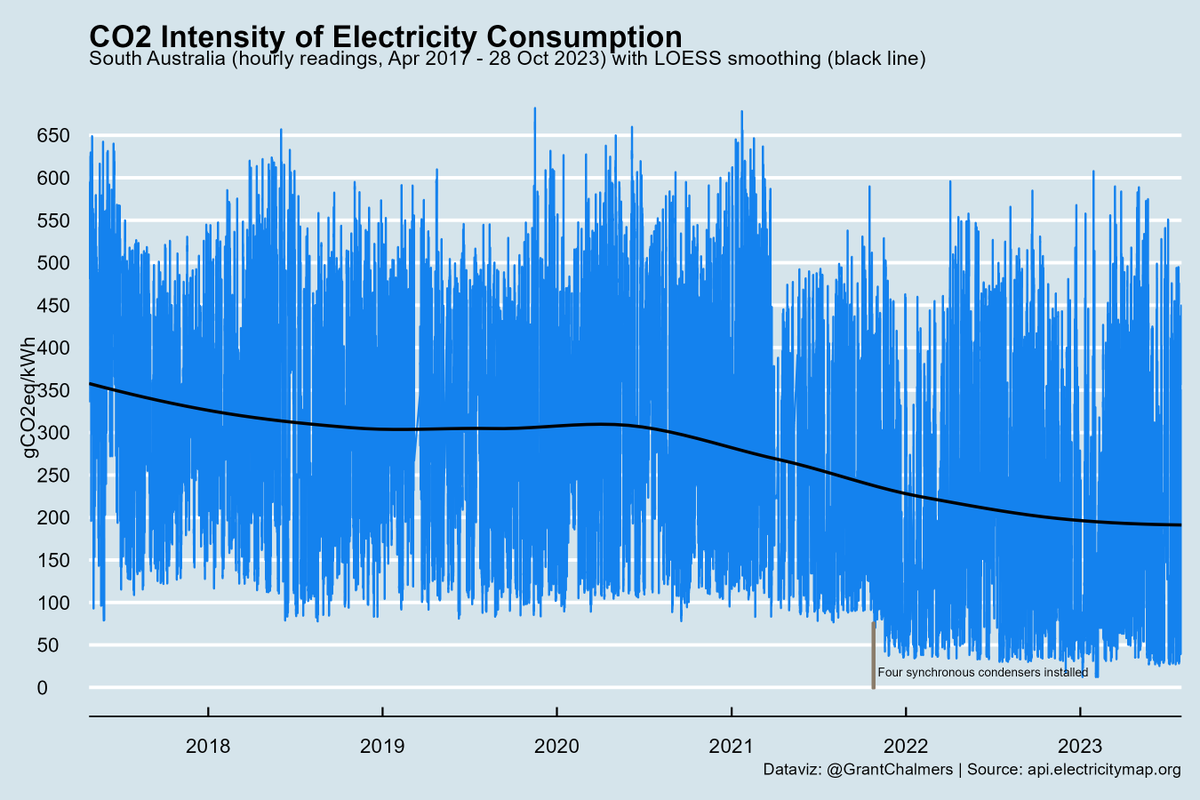
CO2 intensity of electricity consumption in South Australia Apr 2017 - 28 Oct 2023. #rstats #ggplot @ElectricityMaps

Day 2 of our RStudio Workshop sponsored by @wpi_aimec here in the Faculty of Agriculture @TohokuUniPR @tohoku_univ Grad students learning #ggplot with experts from University of New Hampshire


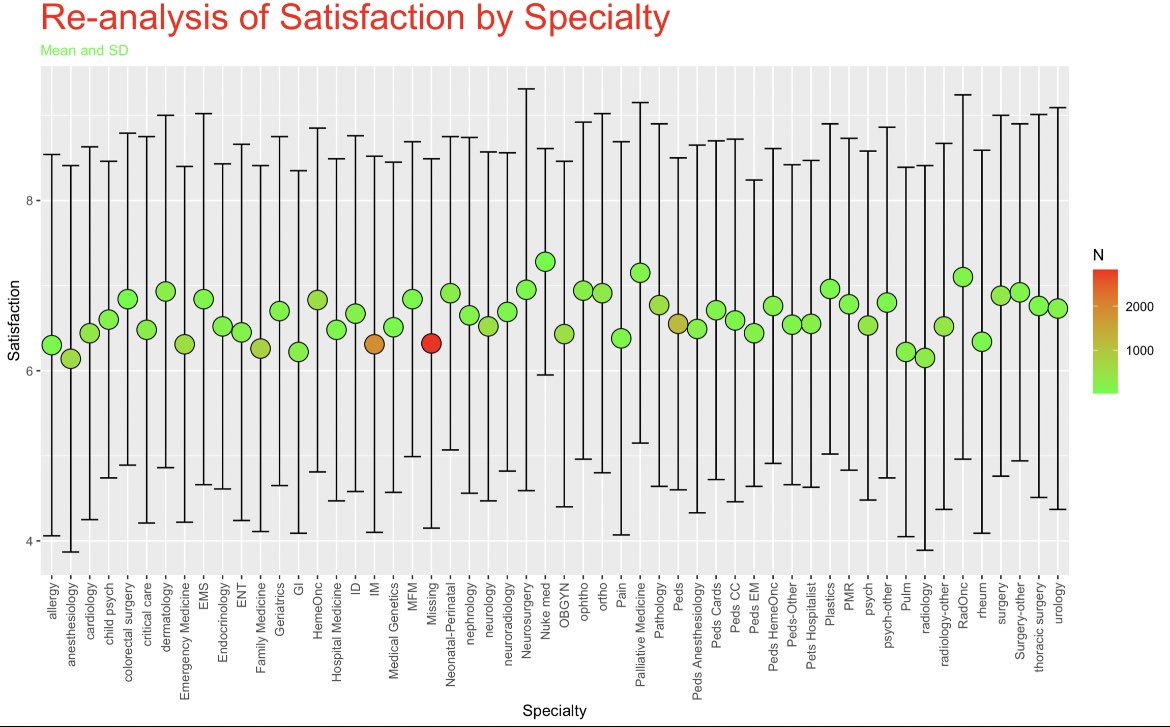
Re-analysis of the recent @JAMANetworkOpen article with satisfaction by specialty, cutpoints removed, and just mean score and SD. Christmas 🎄 themed #ggplot #Rstats

#MasterOfWine is an established expert who understands all aspects of wine and works in wide area. The 1st MW exam was organised in May 1953, 70 years ago, to improve wine trade professionals' standard in UK. 500 people have been qualified since then. #RStats #ggplot

You can also use #ggplot's stat_smooth() on-the-fly to draw in residuals! 📊🤩 #rstats Here's how: - set geom to 'segment' - set xseq to observed values of x (data$x). - supply xend and yend as vectors (data$x, data$y) But, note that xseq is 'off-label'.

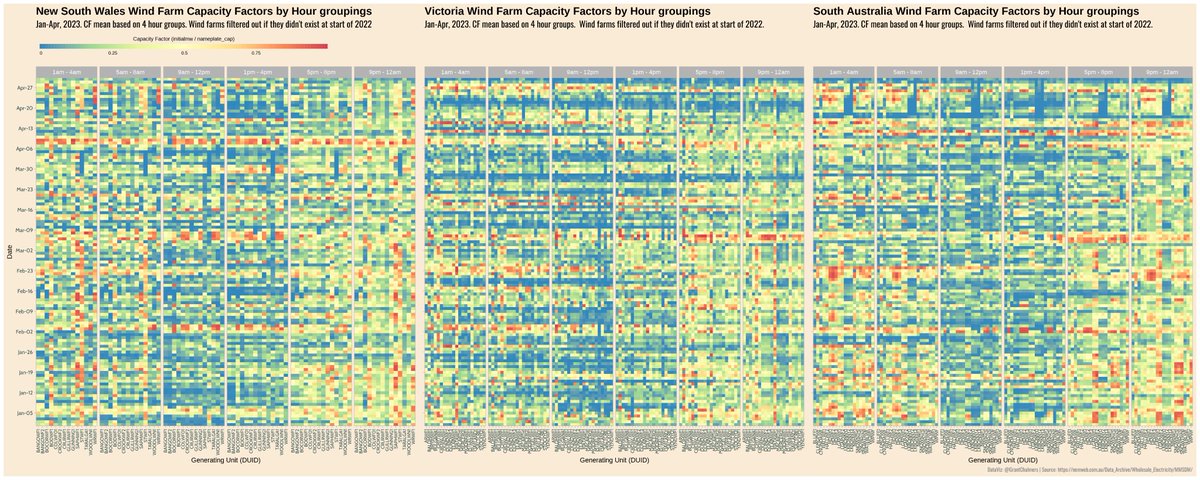
Taking a look at NEM wind capacity factors by lining up NSW, VIC and SA for the first four months of 2023. Looks like Lake Bonney Wind Farm (LKBONNY1-3) in SA had an outage. #rstats #ggplot #heatmap #energy #electricity #dataviz #nem
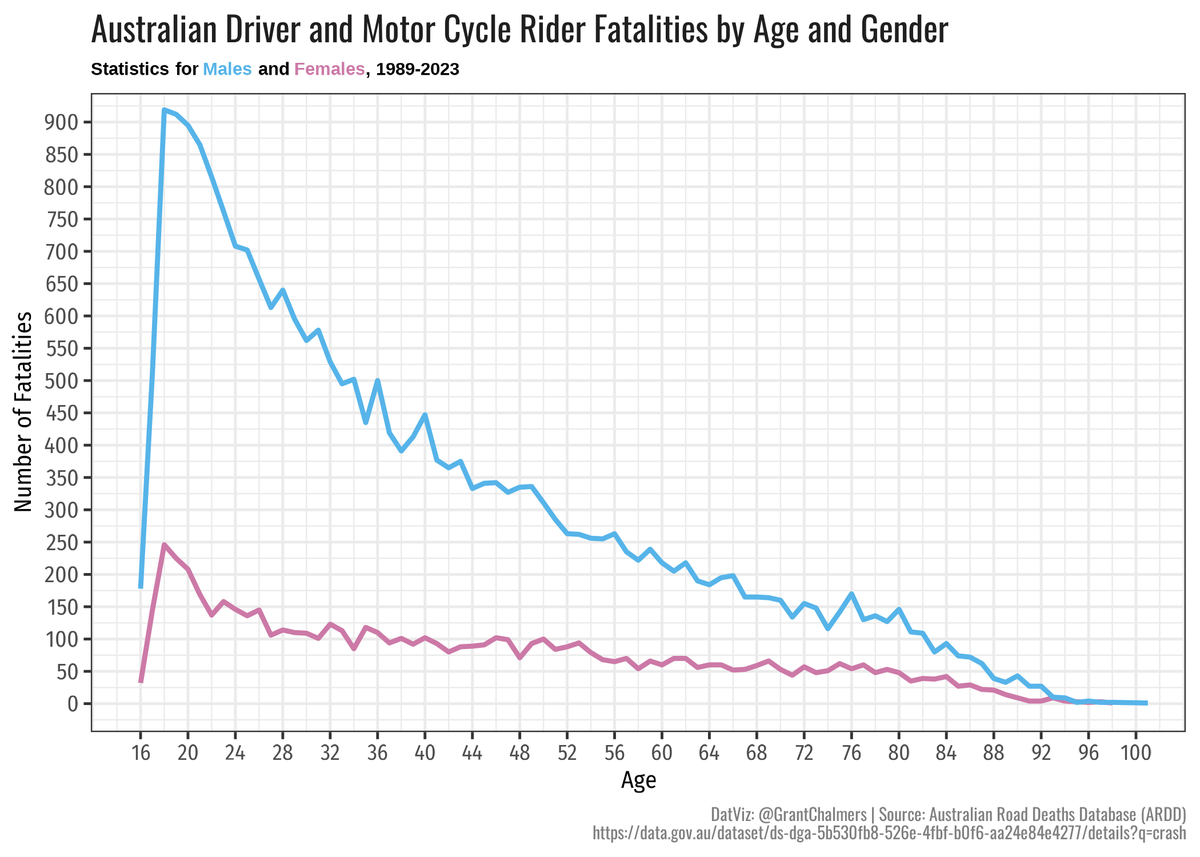
There is a striking disparity in the number of driver and motorcycle rider fatalities in Australia, particularly in terms of age and gender. The combination of testosterone and driving is not a favorable one. #rstats #ggplot #ardd #RoadSafety

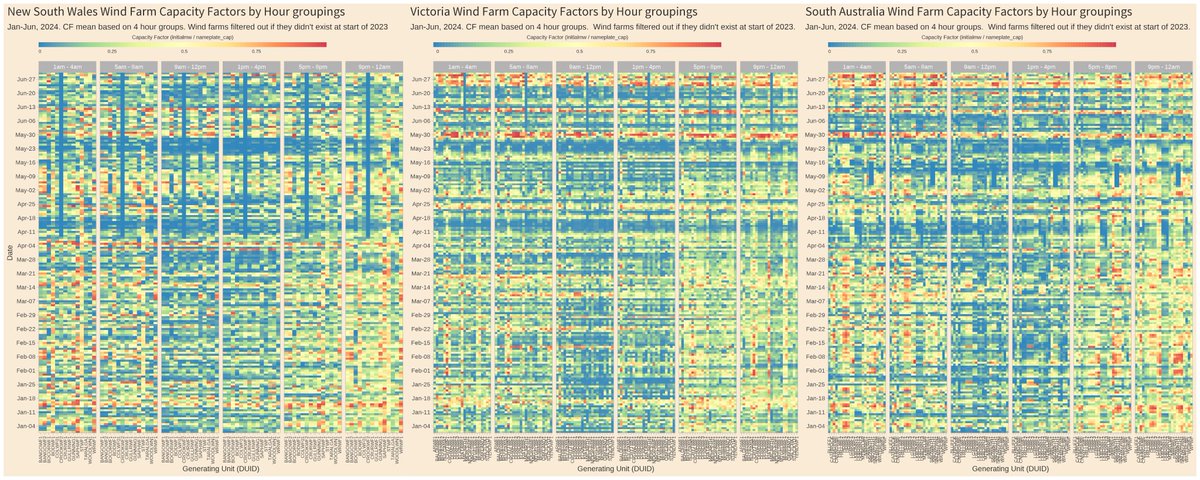
NEM mean wind capacity factors by four hour groupings in NSW, VIC and SA for the first 3 months of 2024. Dunkelflaute (prolonged period of calm or very light winds) correlation pretty strong! #rstats #ggplot #heatmap #energy #electricity #dataviz #nem

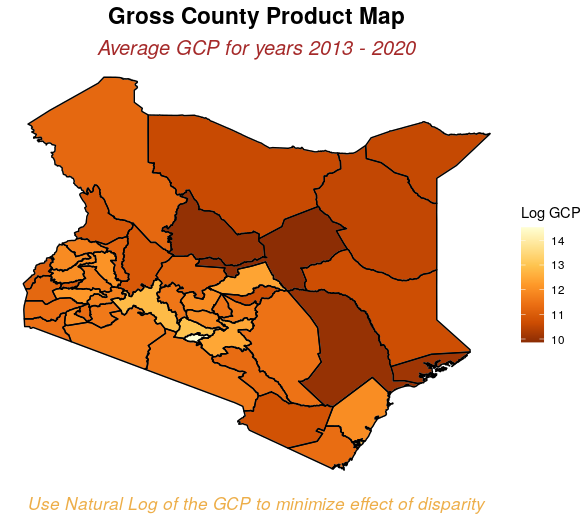
Working on a data visualization project dataset provided by KNBS GCP report Final project will include interactive app and article showing steps followed #rstats #ggplot #dataviz #datavisualization #geospatial

The fact the you have different icons to make a bar or column chart in PowerBI and not, say, just swap the mapping of variables to the opposite axis is 👎 Ugh I miss #ggplot.


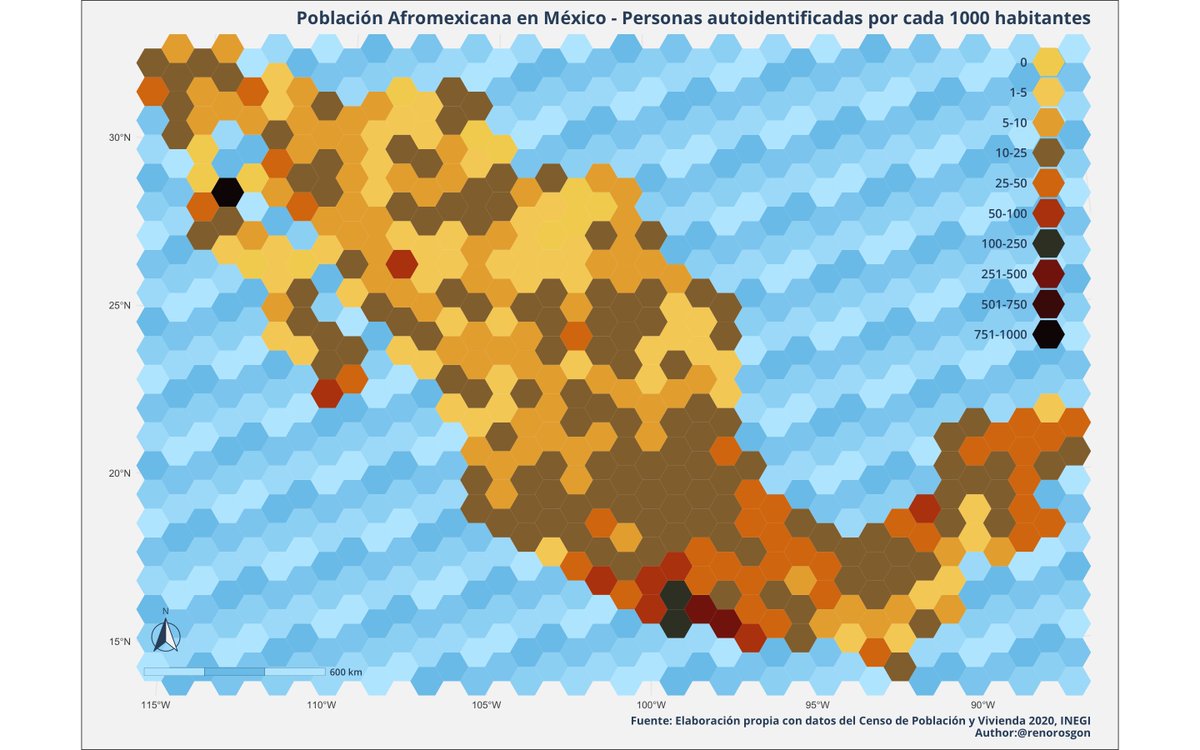
Día 4 - Hexágonos La población afromexicana no fue reconocida oficialmente hasta 2016. Hoy por hoy la adscripción a este grupo es por autoidentificación. Qué interesante saber dónde están las personas que portan con orgullo la tercera raíz. #30DayMapChallenge #rstats #ggplot


#statstab #457 Using color packages Thoughts: Some package ideas to make your {ggplot2} figures more interesting. #dataviz #ggplot #r #figures #plots bookdown.org/hneth/ds4psy/D…

Analysis of New York City Real Estate Listings This was done on #Rprogramming with the help of #ggplot, #tidyverse, #GoogleMaps and more. isabelcabrerar.wordpress.com/2025/09/15/ana… #DataAnalytics #dataanalysis


Presenting this data only as the relative ranking of values overestimates the differences between groups! Hope you don't mind, @SteveKornacki - grabbed the data from your post and popped into #ggplot to paint a fuller picture.
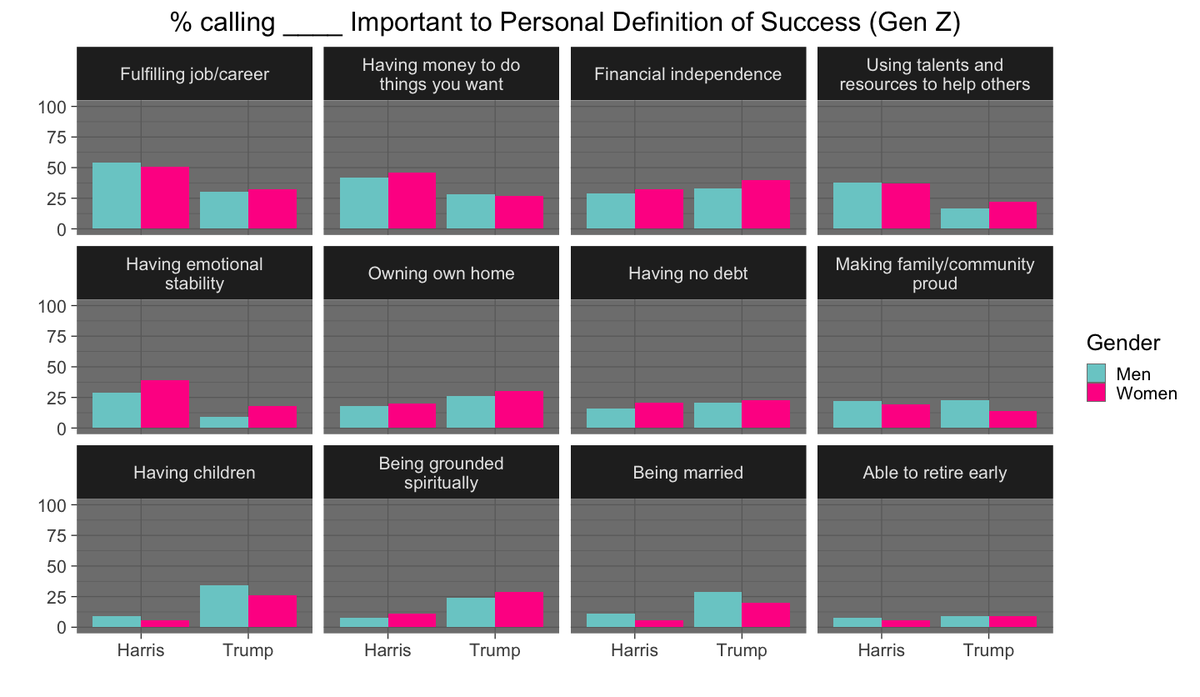
Our NBC News Decision Desk poll asked Gen Z adults (18-29 years old) what they consider important to a successful life. The combination of gender and politics produced two very different sets of priorities:


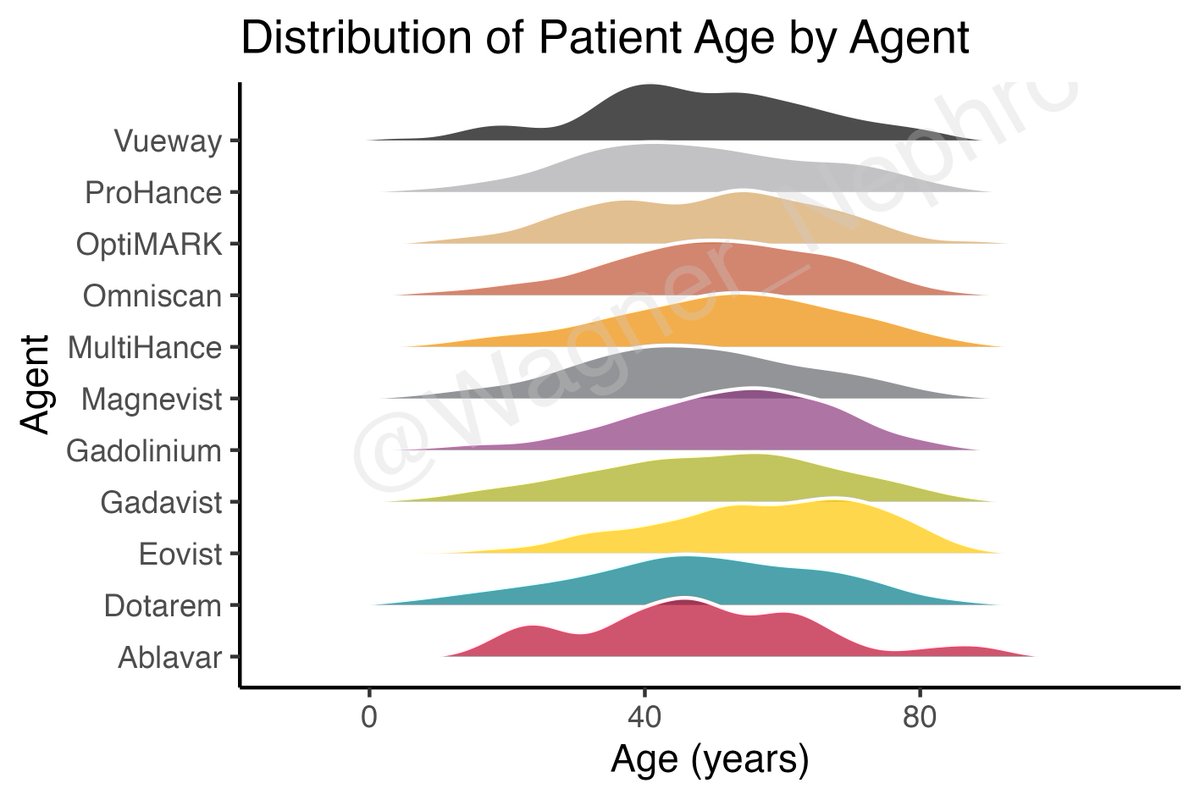
MRI contrast agents and reported adverse events from FAERS (duplicates removed). Age trends visualized with #ggplot ridge plots. #Rstats #pharmacovigilance #FDA
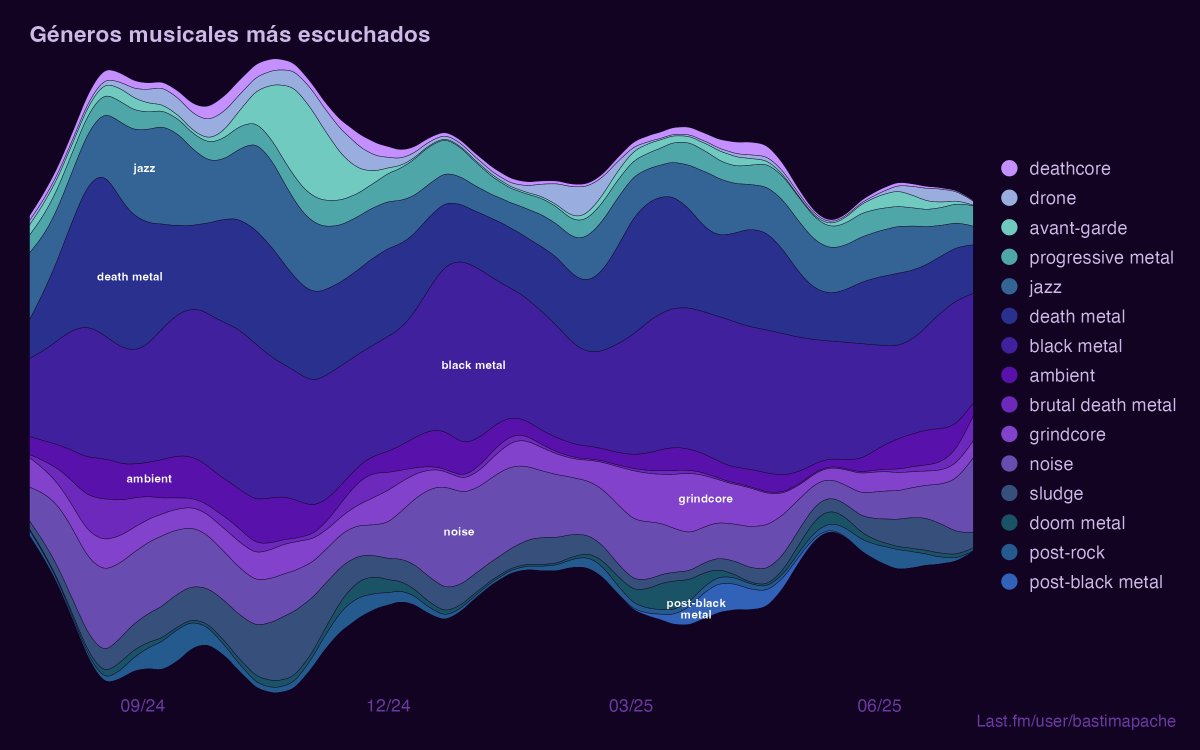
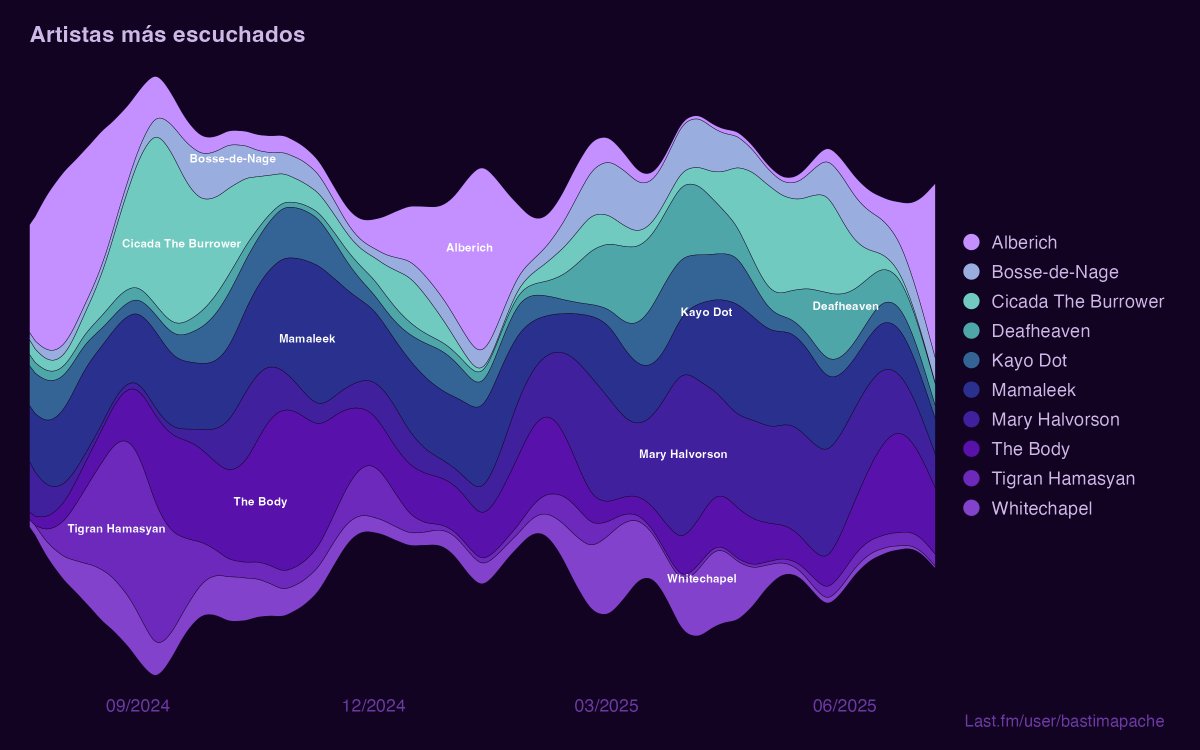
Mis artistas más escuchados, y mi ranking semanal de artistas por género. Quería hacer uno de esos que fluyen de columna a columna, pero la rotación es demasiado alta 😂 #rstats #ggplot #lastfm


Hey dataviz and sci people. I was absent for quite a while but decided to give bluesky a try to post my #dataviz #RStats #ggplot #gis work. I would love to reconnect there. You can find me with the handle '@toebr.bsky.social'. See you there :)

I use #ggplot #gganimate #Rstats to visualize spatiotemporal trends in public ICE detention data Watch ICE detention increase over time: more detainees (bigger dots), more non-criminals (blue → red), and more jails popping up inland in 2025 Code #gist: gist.github.com/JEFworks/899a1…
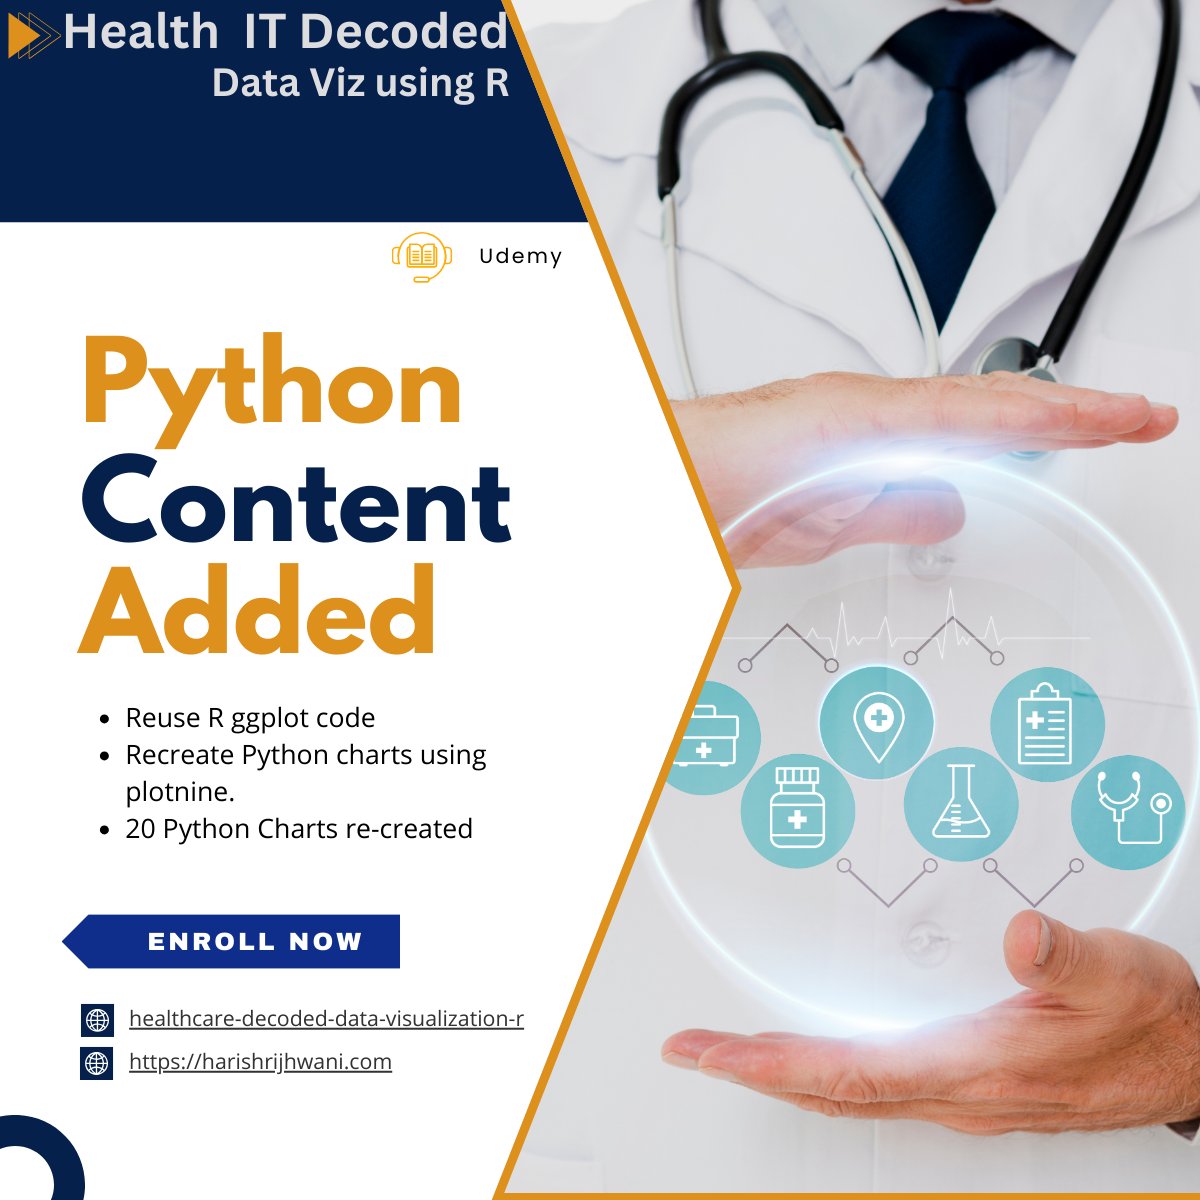
New content to my recently launched course: "Healthcare IT Decoded – Data Visualization using R"! Reuse your ggplot2-based R code in Python Enroll using the discounted link valid till 05/15/2025 6:00 PM IST udemy.com/course/healthc… #datavisualization #Python #ggplot #plotnine

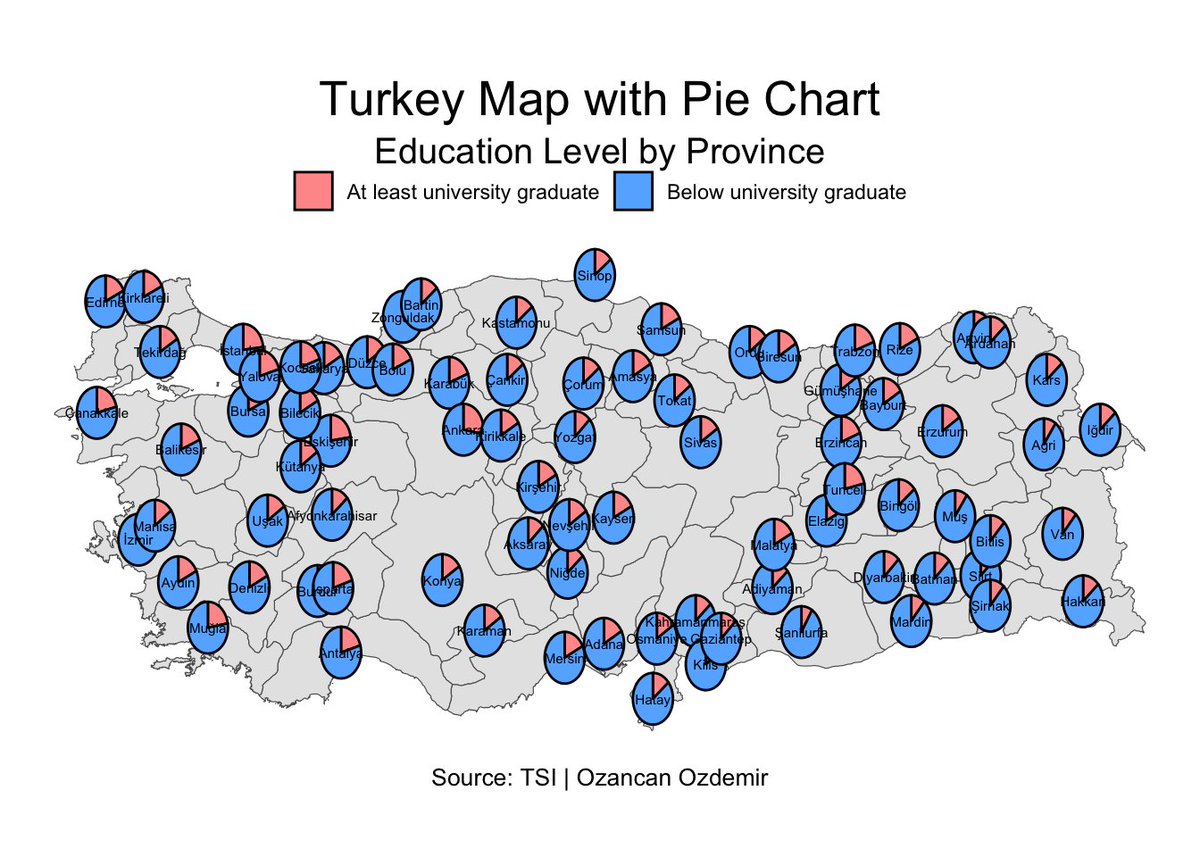
R programlama dilinde, haritaların üzerine pasta grafiklerini nasıl ekleyebileceğinizi gösteren bir öğretici hazırladım. #Rstats #dataviz #ggplot ozancanozdemir.github.io/map_and_piecha…


Finally, beautiful arrows in #ggplot #rstats (I cringe whenever I have to draw arrows in base R) teunbrand.github.io/ggarrow/
🎯 12 TOP 📦 #RStats para ahorrar horas de trabajo en tus análisis de datos 👀 1. Crea gráficos #ggplot de forma interactiva 📦 esquisse, recupera el código para reproducir el gráfico 2. Elige los colores para tus gráficos de forma interactiva 📦 colourpicker #dataviz #stats
I'm in love with this package and I don't care who knows it. #ggside is insane for making side plots with #ggplot. You can make marginal distributions, side-box plots, & many other #ggplot2 geoms. Learn more: buff.ly/3OVfwgV #rstats #datascience
With my geom_terrorbar() you too can now use Ts for errorbars just like they did in that genius paper! Read more in my latest blog post mival.netlify.app/blog/2023/01/i… Happy new year! #Rstats #ggplot #hindawi
CO2 intensity of electricity consumption in South Australia Apr 2017 - 28 Oct 2023. #rstats #ggplot @ElectricityMaps


Re-analysis of the recent @JAMANetworkOpen article with satisfaction by specialty, cutpoints removed, and just mean score and SD. Christmas 🎄 themed #ggplot #Rstats
👀📈¿Cómo depurar tus visualizaciones de datos? 🙌 👉 Consejos para simplificar y minimizar 🔗 buff.ly/3rDWBh0 👤 by @andrewheiss #Rstats #ggplot #dataviz #datavisualization #stats #analytics

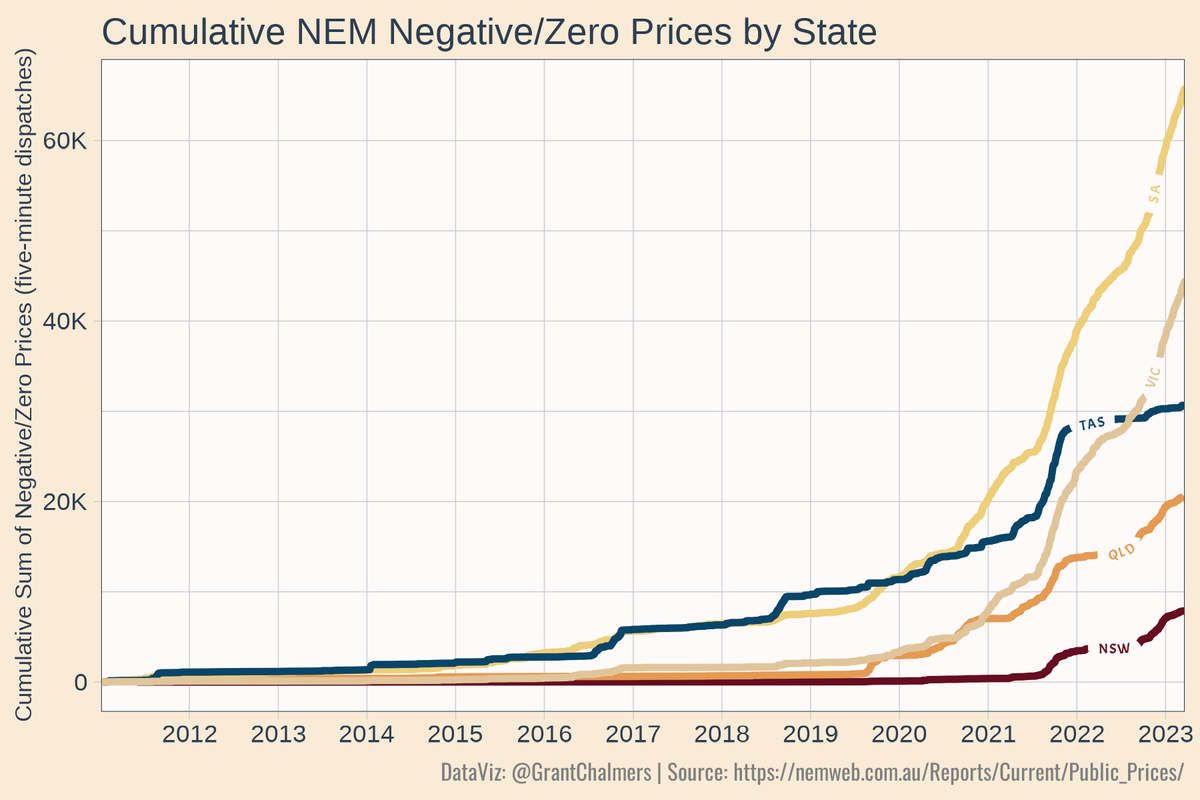
Cumulative sum of negative/zero prices (five-minute dispatches) per state in the NEM since 2011. #rstats #ggplot #dataviz #NEM
Day 2 of our RStudio Workshop sponsored by @wpi_aimec here in the Faculty of Agriculture @TohokuUniPR @tohoku_univ Grad students learning #ggplot with experts from University of New Hampshire

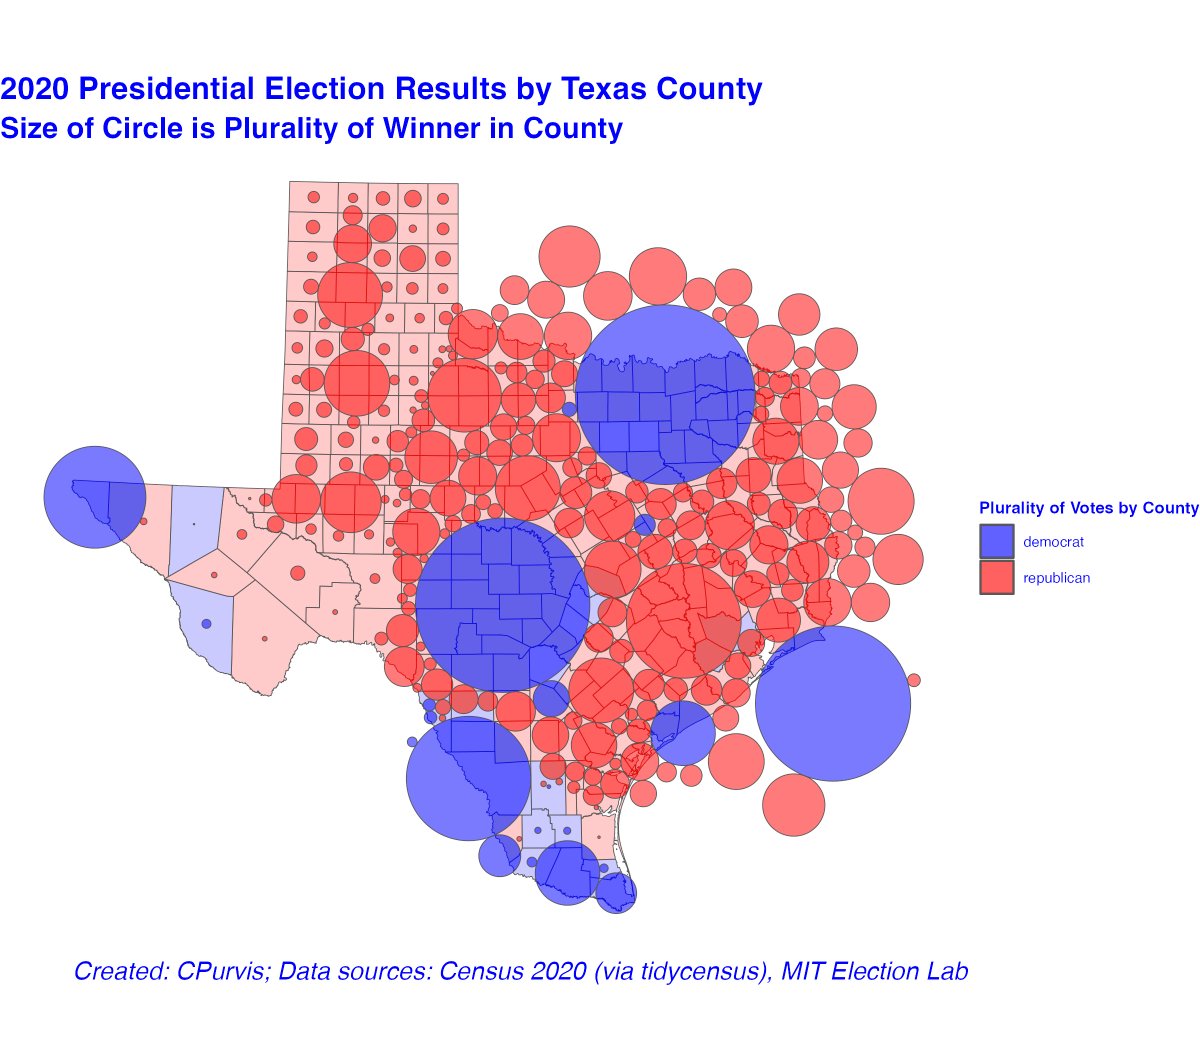
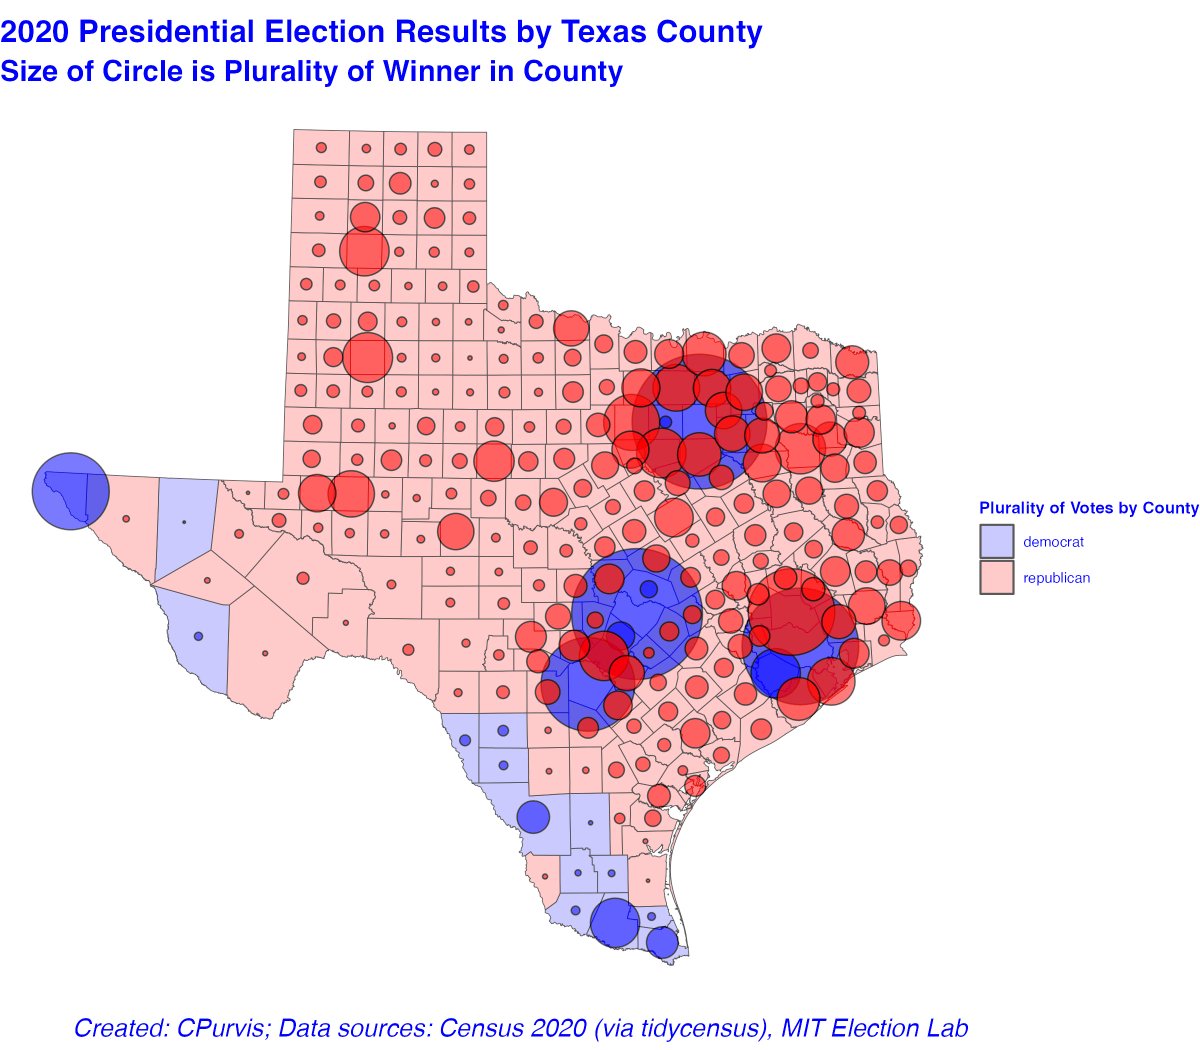
The #rstats #cartogram package, using #ggplot is even more striking for #texas #tidyverse #tidycensus #crsuggest The Dorling cartogram pushes Harris County (Houston) into the Gulf of Mexico Dallas County is clearly visible, repelling all the little red bubbles. This is fun
Taking a look at NEM wind capacity factors by lining up NSW, VIC and SA for the first four months of 2023. Looks like Lake Bonney Wind Farm (LKBONNY1-3) in SA had an outage. #rstats #ggplot #heatmap #energy #electricity #dataviz #nem
deploying interactive app to visualize county GCP #rstats #ggplot #dataviz #datavisualization #geospatial

There is a striking disparity in the number of driver and motorcycle rider fatalities in Australia, particularly in terms of age and gender. The combination of testosterone and driving is not a favorable one. #rstats #ggplot #ardd #RoadSafety
🤖 En un mundo donde los asistentes virtuales son omnipresentes, podrías querer uno que te ayude a resolver problemas comunes de formato en ggplot. Usa 📦ggx RT @rfunctionaday buff.ly/3Xa1bB5 #DataScience #Rstats #ggplot #dataviz #analytics #stats

NEM mean wind capacity factors by four hour groupings in NSW, VIC and SA for the first 3 months of 2024. Dunkelflaute (prolonged period of calm or very light winds) correlation pretty strong! #rstats #ggplot #heatmap #energy #electricity #dataviz #nem

Making grouped, proportional histograms and density plots in #ggplot is not intuitive & there's a ton of confusing advice online, so I put together an #Rmarkdown with instructions & explanations for why many proposed solutions don't work. #R #Coding github.com/donaldtmcknigh…

Something went wrong.
Something went wrong.
United States Trends
- 1. Clemson 9,849 posts
- 2. #SmackDown 44.1K posts
- 3. Zack Ryder 13.2K posts
- 4. Dabo 1,717 posts
- 5. Landry Shamet 4,827 posts
- 6. Matt Cardona 2,477 posts
- 7. #OPLive 2,085 posts
- 8. Brohm 1,130 posts
- 9. #CLAWMARK3D 24.8K posts
- 10. Miller Moss N/A
- 11. #BostonBlue 2,498 posts
- 12. Marjorie Taylor Greene 33.6K posts
- 13. Will Richard 4,461 posts
- 14. Steph 30.7K posts
- 15. Kon Knueppel 2,325 posts
- 16. Ersson N/A
- 17. #TNATurningPoint 7,664 posts
- 18. Tre Mann 5,432 posts
- 19. Charles Lee N/A
- 20. Bill Clinton 166K posts