#rawgraphs نتائج البحث

Data visualization has never been that fun! @ComSciCon you're nailing it 👌 #ComSciCon18 #RAWgraphs #DataBasic #ColorBrewer #Canva #Datawrapper #Palladio

I do information visualization in daily work, often used Rawgraphs @rawgraphs Looking forward to version 2.0 If there is an internal test, I can test it! #DataVisualization #rawgraphs #dataviz


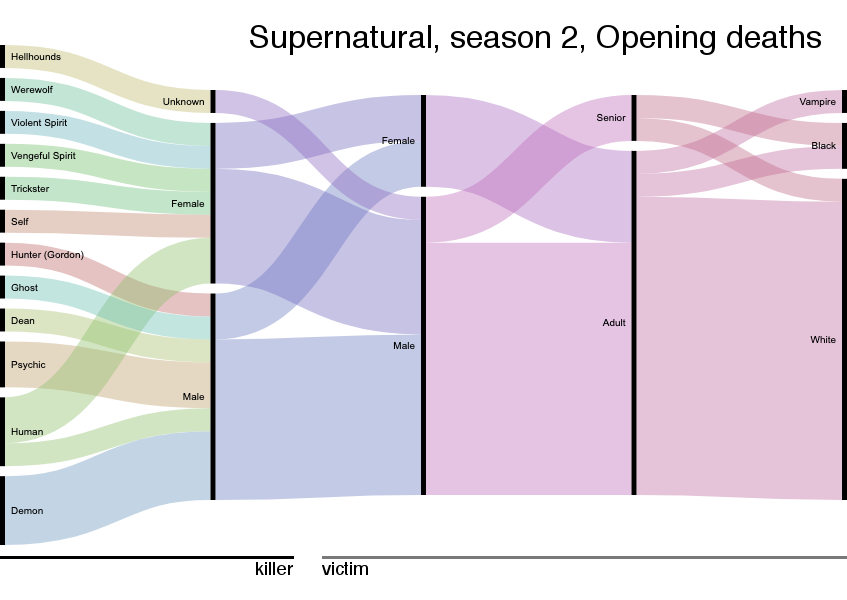
All the opening sequence deaths in #Supernatural, season 2 in #rawgraphs. A lot fewer, and many of them were visions of preventable deaths. docs.google.com/spreadsheets/d…

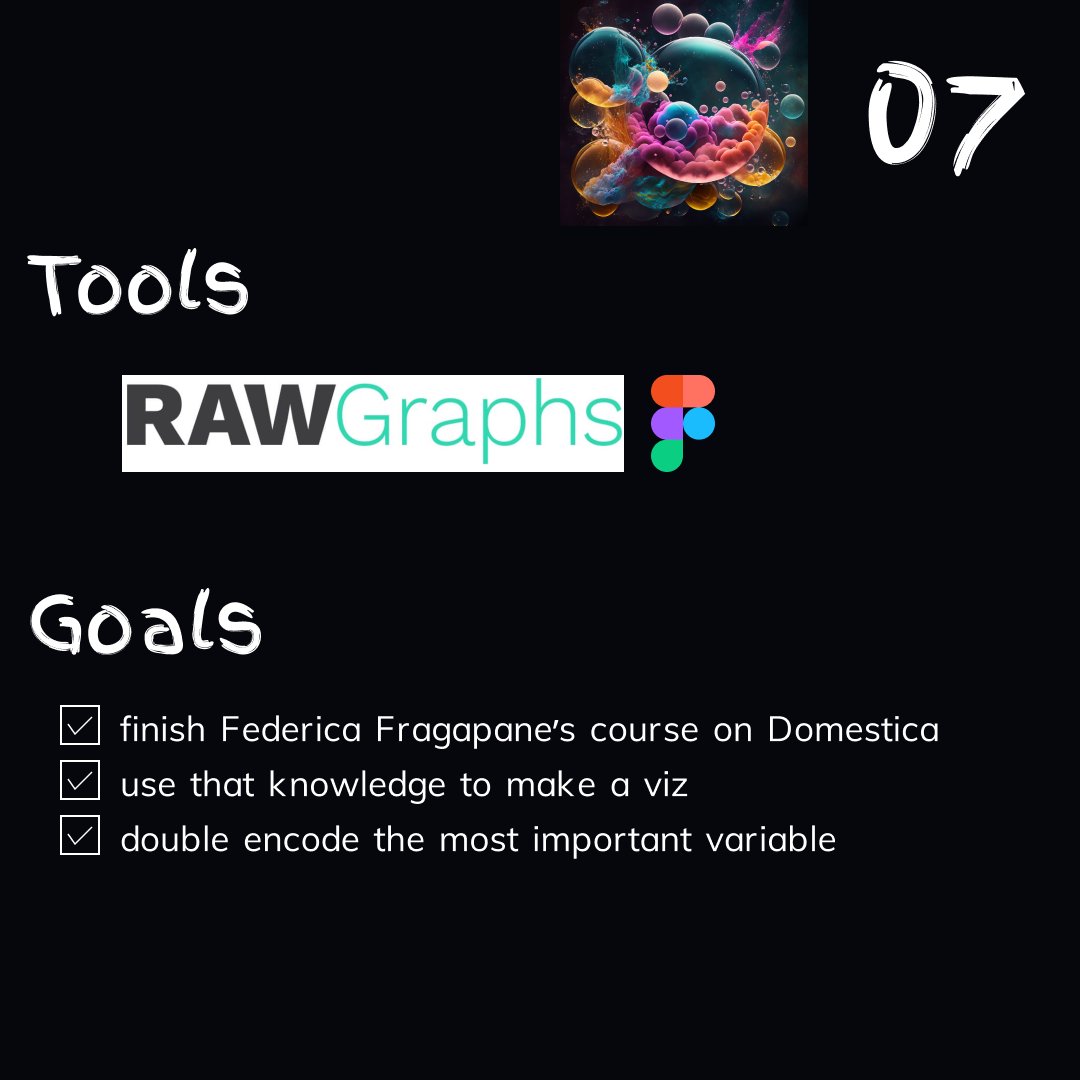
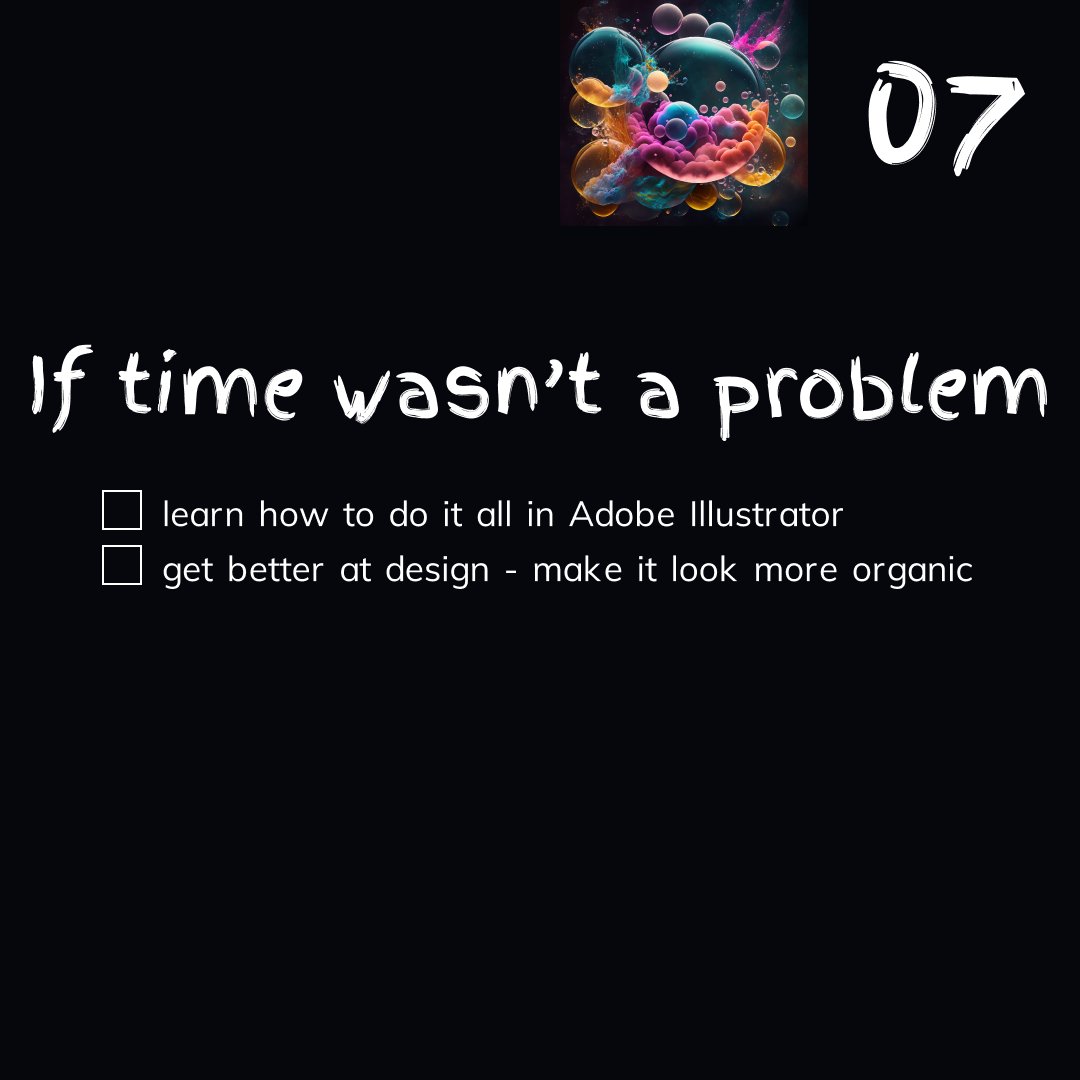
Although the initial idea was to do everything in Adobe illustrator, I just could not be bothered to figure things out and went back to tools I like, #rawgraphs and #figma. I am not too happy with the end result (not good enough), but take this as a learning step. #journaldataviz

8/ Visualize data with RAWGraphs! 📊 RAWGraphs uses AI to help creators turn raw data into interactive visualizations, offering a powerful tool for data-driven storytelling. #RAWGraphs #DataVisualization

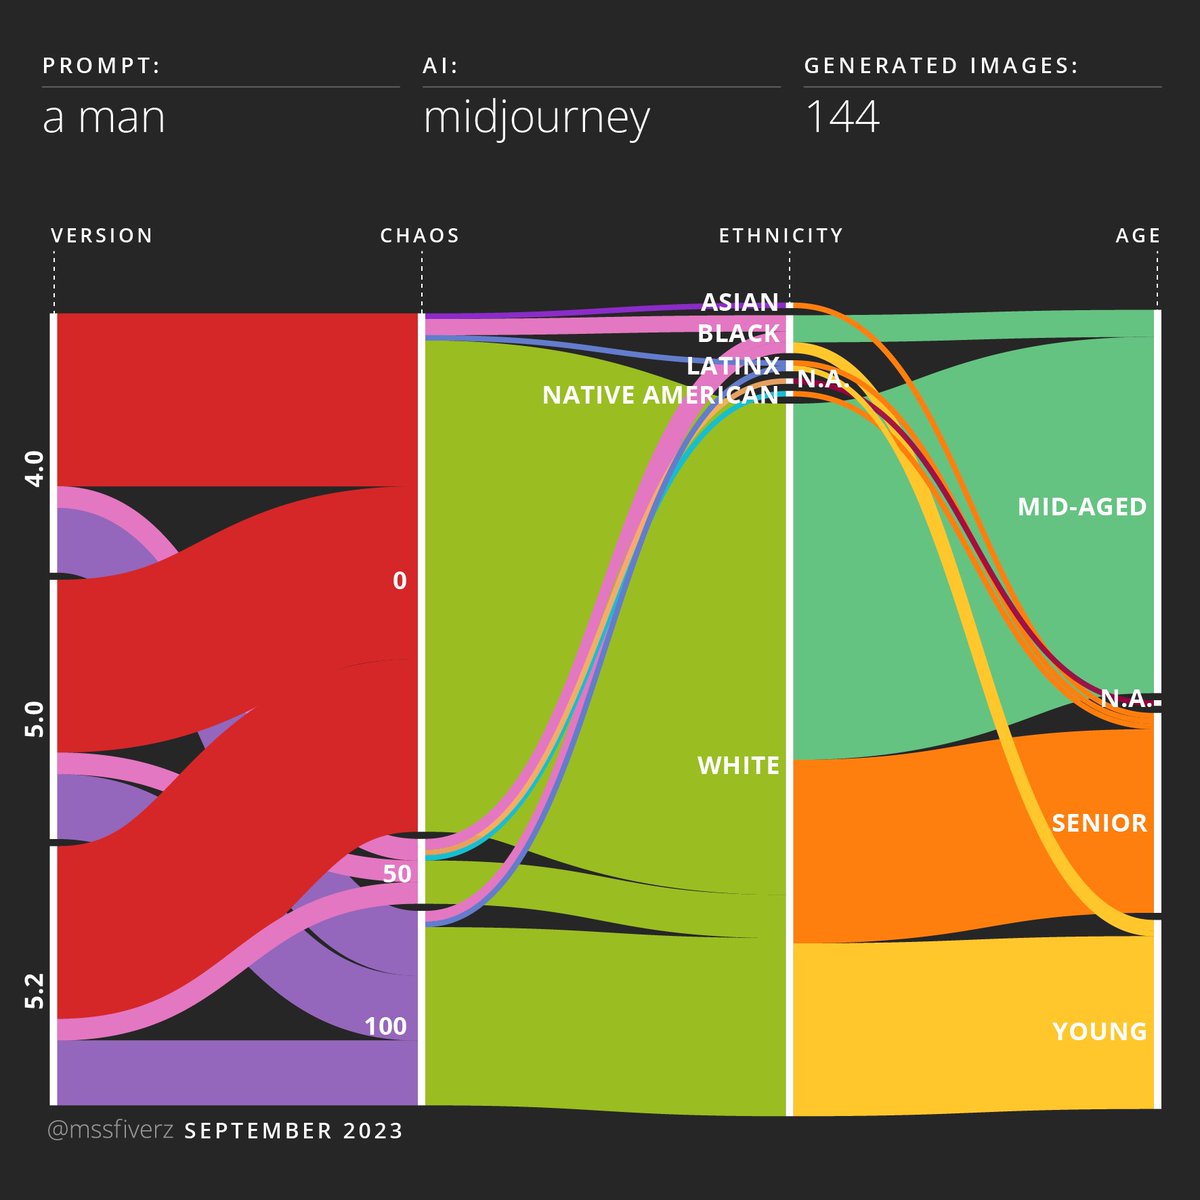
The results show that, unlike women, men are very diverse in terms of age, but very little in terms of ethnicity. In any case, we can say that the representation of Caucasians is disproportionate. #dataviz #datavisualization #rawgraphs #AIArtwork #aiartcommunity #midjourney

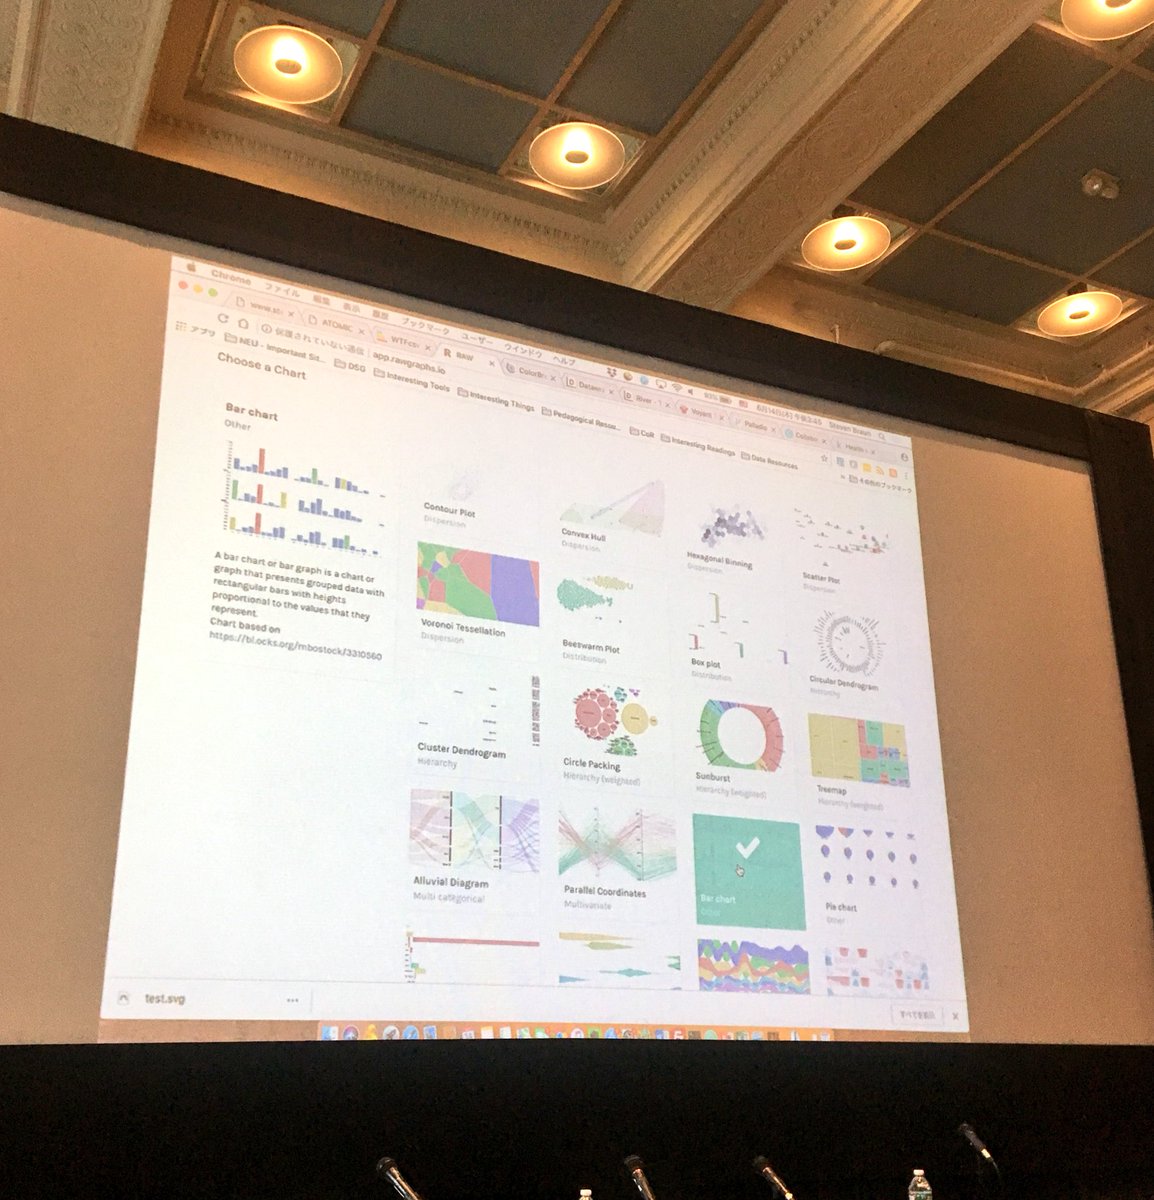
The past month has been productive! Stay tuned for the public release of #RAWGraphs 2.0 and all these new charts 😏 #dataviz #datavisualization #charts #data #opensource


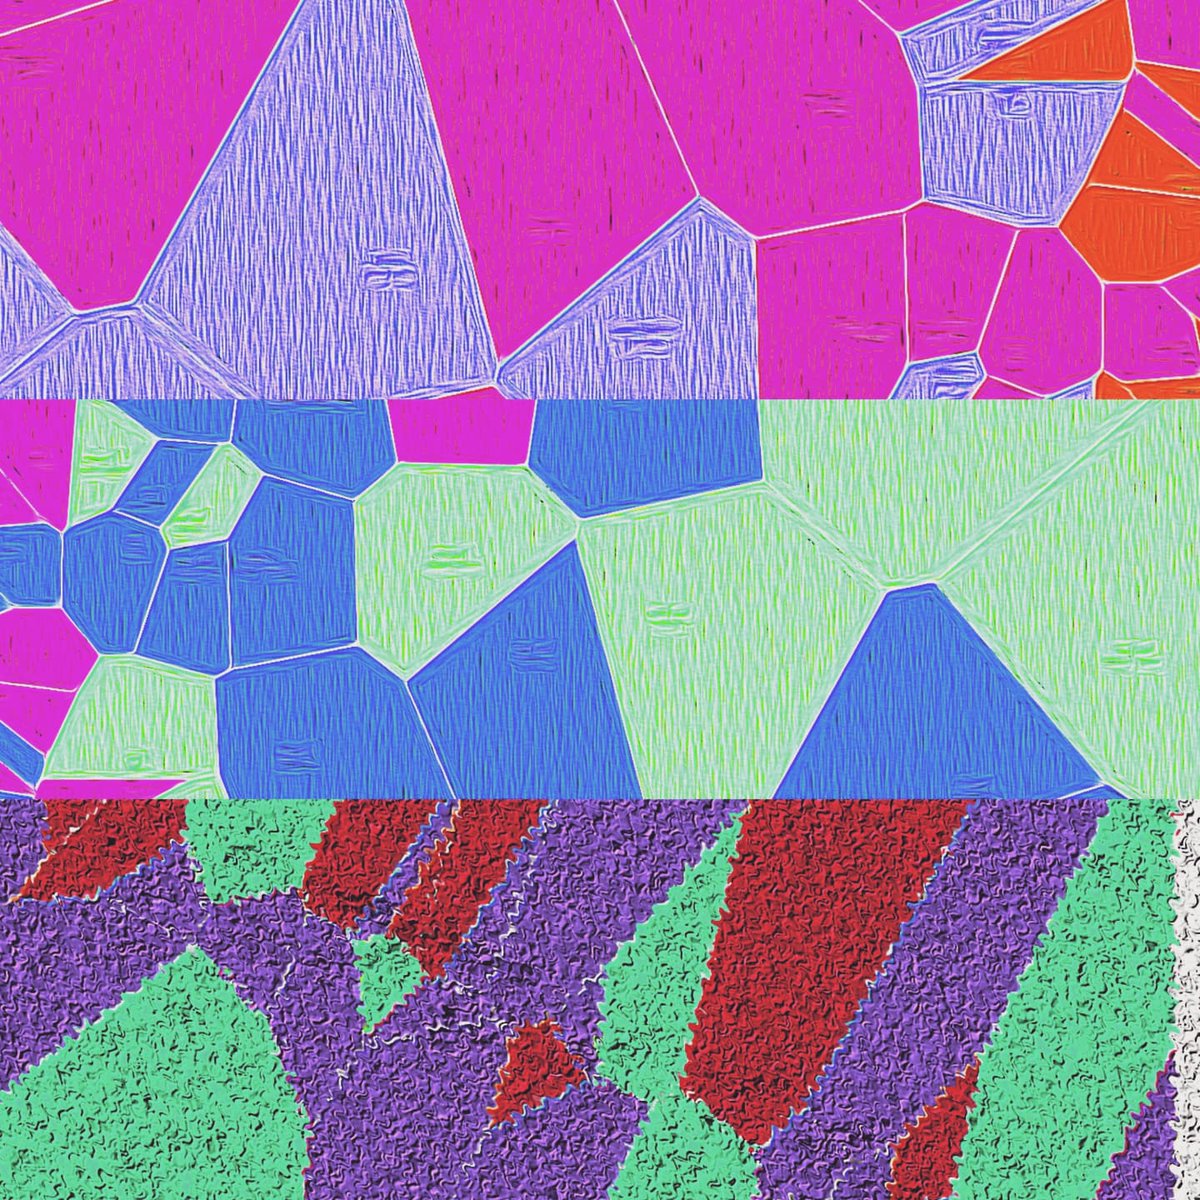
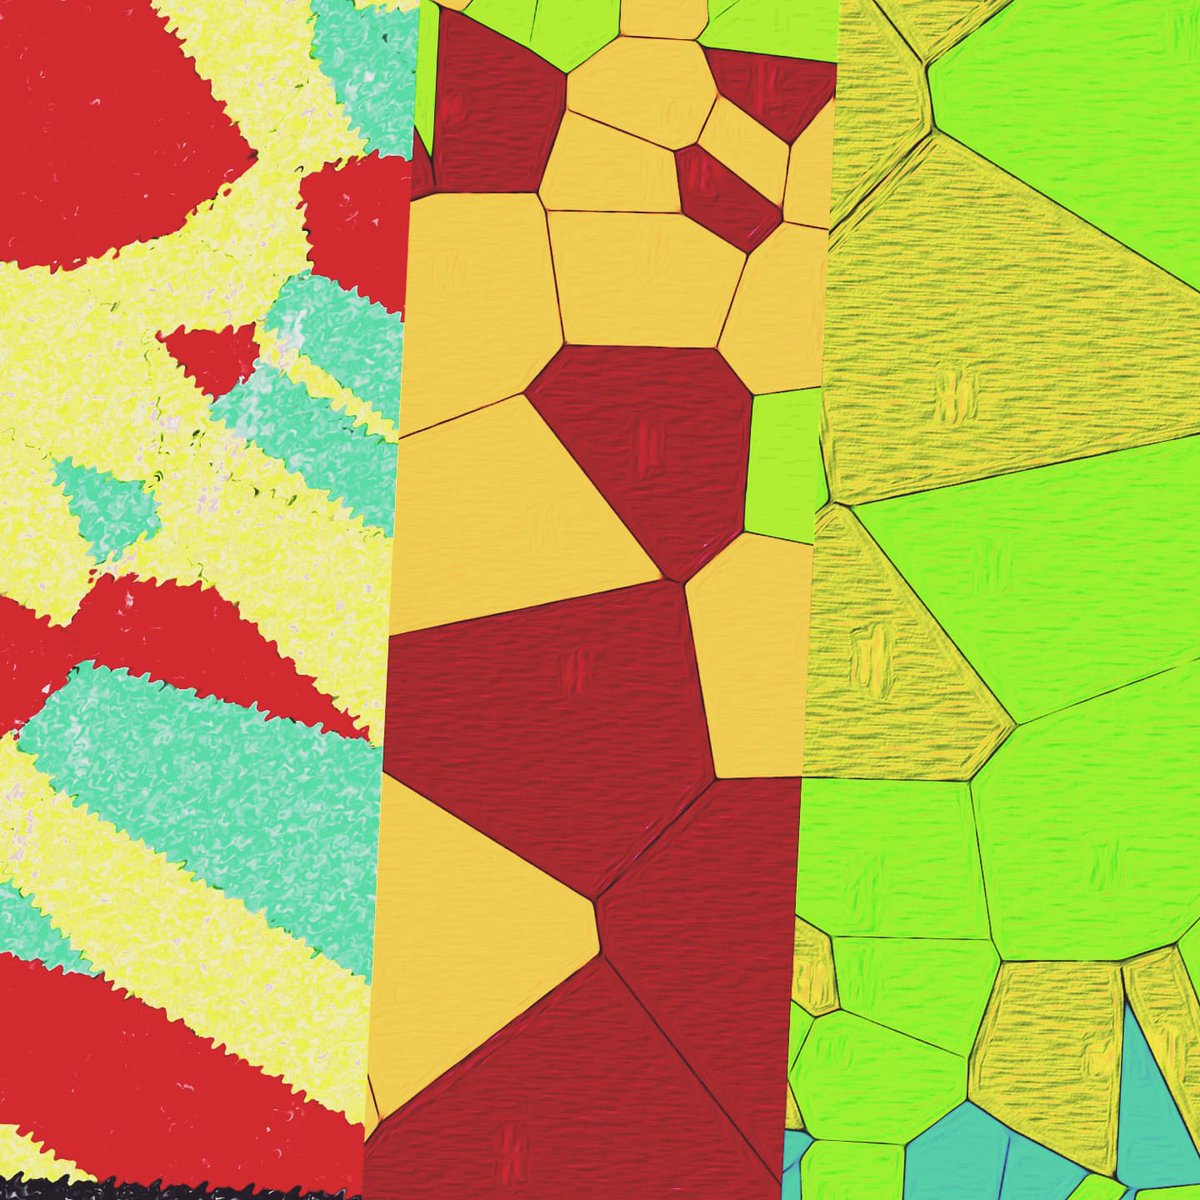
#TidyTuesday week 9 - Long Beach Animal Shelter. I took a creative approach to data visualization by analyzing the primary colors of animals at the Long Beach Animal Shelter (2017–2024) using #Rstats #RawGraphs and #Figma #dataviz

Did you know that you can import data into #RAWGraphs from a #googlespreadsheet or any CORS-enabled API? 1-publish your sheet to the web 2-copy the link and paste it into RAWGraphs 3-enjoy it and refresh data from URL if something has changed!
Today it's the day! 🥳 We (@densitydesign @studiocalibro @inmagiklabs) are very excited to share the new version of #RAWGraphs with everyone. Available at rawgraphs.io #datavisualization #dataviz #opensource #floss
⚠️ New Chart ⚠️ We just added Slope Chart to the private version of #RAWGraphs for all the donors/sponsors/supporters to test and get feedback #opensource #dataviz #DataVisualization #slopechart #OpenData
Four weeks ago we have launched RAWGraphs 2.0 for our campaign backers and we keep on working on new charts and features. What do you think about this new version? What's your favorite update? 🤔 #DataVisualization #dataviz #rawgraphs

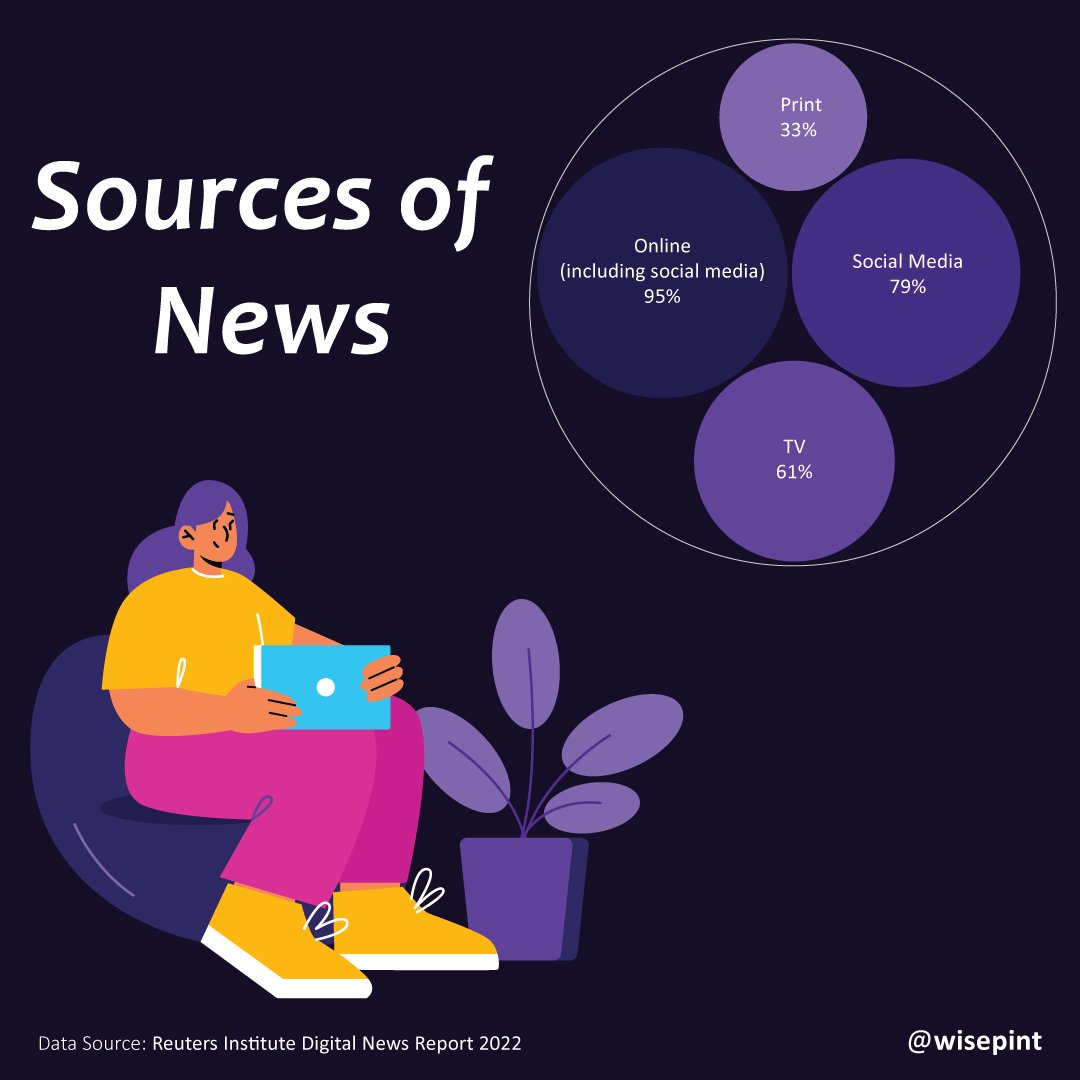
A survey of online news users in #Nigeria who are between the ages of 18-50 revealed that 95% of the sample population uses online platforms as well as the social media to source for news. 🧑💻 #excel, #RAWGraphs & #adobeillustrator Data: Reuters Institute Digital News Report 2022


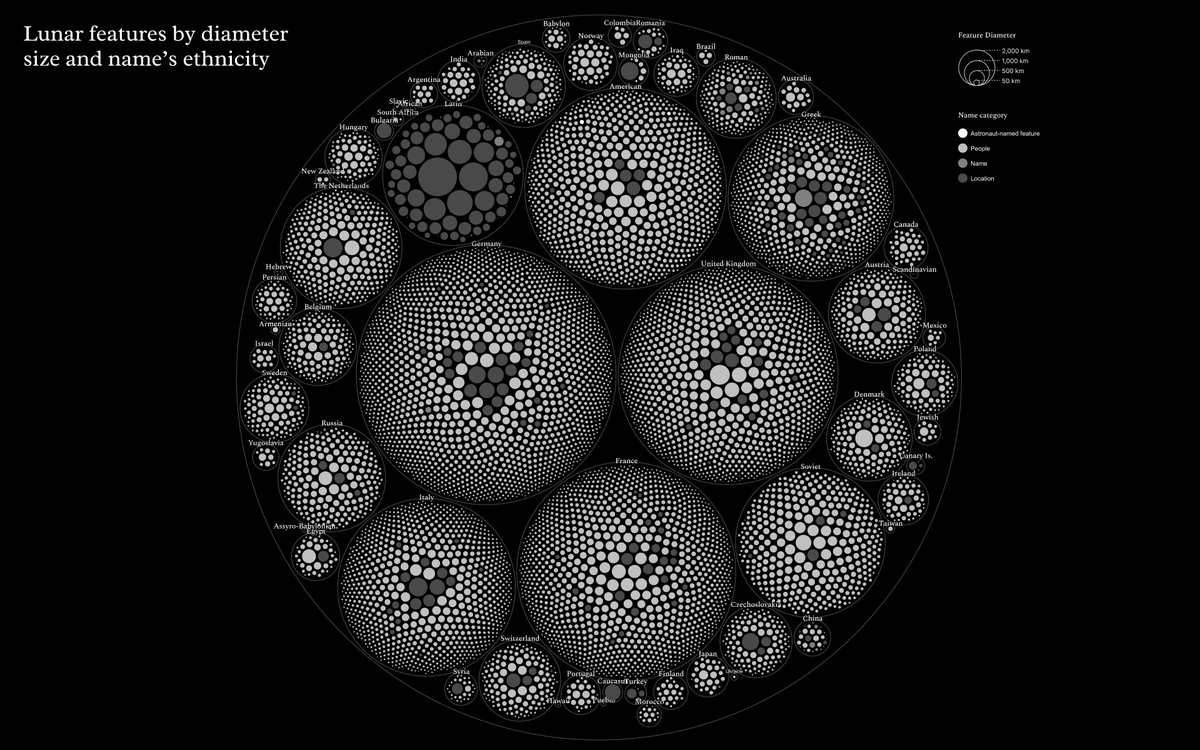
[#DATAVIZ|#RAWGRAPHS] 🥳 Welcome back circle pack-ing! We just added a “classic” of RAWGraphs to visualize proportions and hierarchical structures with more options, better label placement, and legends. Available in RAWGraphs 2.0 (via @rawgraphs)

Thanks for asking! Combining #RAWGraphs with #Illustrator is my favourite, like applying the Art Brush tool and adding annotations. Other fun projects RAWGraphs ❤️ vizualism.nl/tag/rawgraphs/
在中国,我已第一时间同步了使用体验!非常的棒! #RAWGraphs @rawgraphs @densitydesign 直达阅读地址: mp.weixin.qq.com/s/XgqfTeTDuLBr… #datavisualization #dataviz #opensource #floss


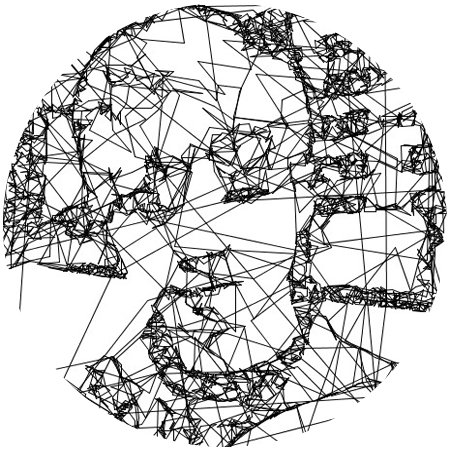
Information designer in me says - Dude! This is a mess! All the data is blended altogether! Remove this alluvial and choose some other shape! Graphic designer in me says - This is simply beautiful! Don't change it! #RawGraphs + #Illustrator


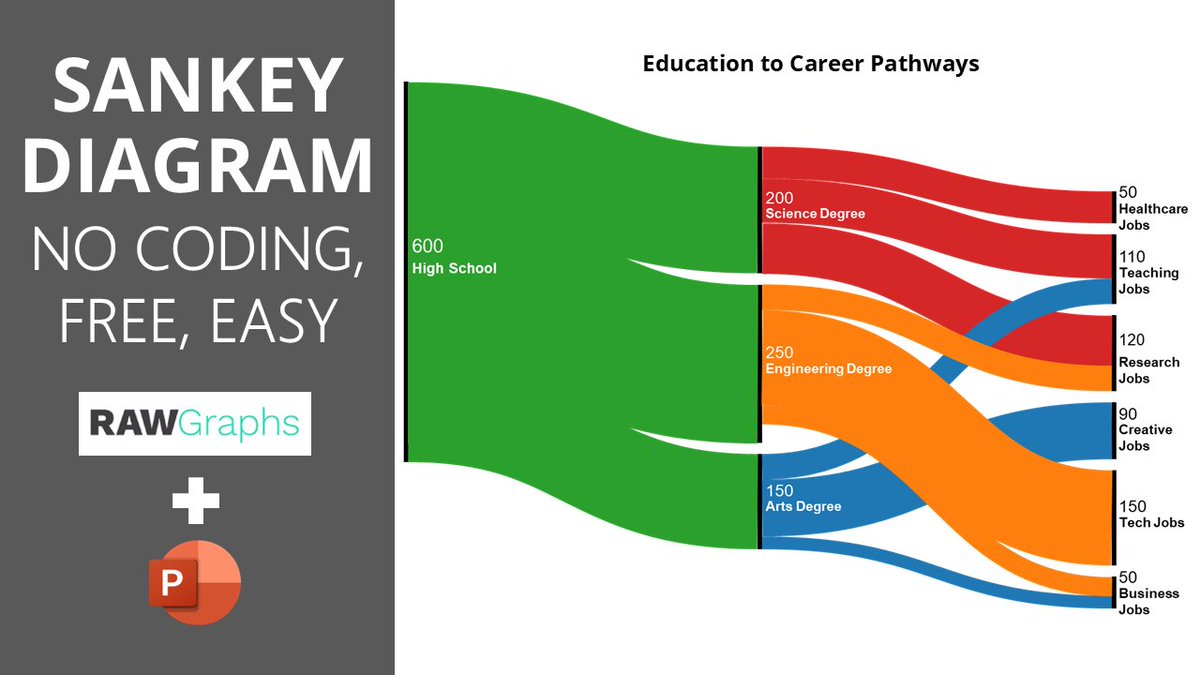
How to Create a Stunning Sankey Diagram in PowerPoint with RAWGraphs 2.0 (Free & Easy!) youtu.be/akG4x8_VvW4 #SankeyDiagram #PowerPoint #RAWGraphs
#TidyTuesday week 9 - Long Beach Animal Shelter. I took a creative approach to data visualization by analyzing the primary colors of animals at the Long Beach Animal Shelter (2017–2024) using #Rstats #RawGraphs and #Figma #dataviz

Veri görselleştirmede pek çok imkan sunan #RAWGraphs uygulamasını anlattığım yeni blog yazısı 🔗

Empower your data storytelling with #RAWGraphs! 📊✨ This user-friendly tool opens the door to effortless #DataAnalytics and visualization for all. Dive into the world of captivating #datastorytelling with guest contributor Özge Eda Kaya. #research digitalorientalist.com/2023/11/28/raw…
Empower your data storytelling with #RAWGraphs! 📊✨ This user-friendly tool opens the door to effortless #DataAnalytics and visualization for all. Dive into the world of captivating #datastorytelling with guest contributor Özge Eda Kaya. #research digitalorientalist.com/2023/11/28/raw…
We just started the 1st webinars for developers learn how to develop new custom charts for #RAWGraphs! @mikima (@densitydesign) and @bianchimro (@inmagiklabs) are explaining the structure of our app, how to render the charts and the different options available

8/ Visualize data with RAWGraphs! 📊 RAWGraphs uses AI to help creators turn raw data into interactive visualizations, offering a powerful tool for data-driven storytelling. #RAWGraphs #DataVisualization
The results show that, unlike women, men are very diverse in terms of age, but very little in terms of ethnicity. In any case, we can say that the representation of Caucasians is disproportionate. #dataviz #datavisualization #rawgraphs #AIArtwork #aiartcommunity #midjourney
Results confirmed my suspicion. Here is the data I collected. I must truly thank the rawgraphs.io team for creating a tool as powerful as it is easy to use! Bravə! 👏 #dataviz #datavisualization #rawgraphs

Do you use RAWGraphs for teaching activities? We need your help! We are doing some research on how our software RAWGraphs is used in educational activities. Fill the form by April 12th: forms.gle/Ee7VP17Xj1fuEz… #opensource #rawgraphs #education #datavisualization
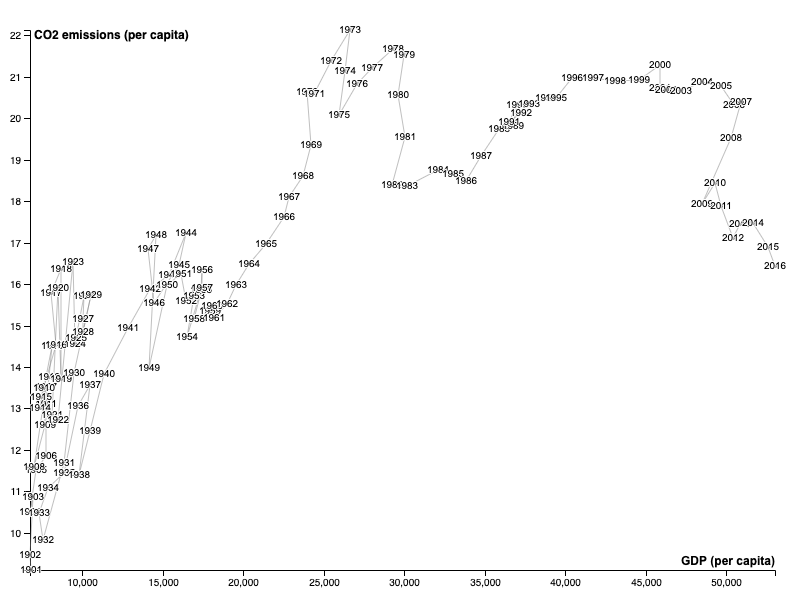
#figma, #rawgraphs, lots of search in the email history to find the flights and use of icao.int/environmental-… to quantify the C02 emitted. #metajournal #journaldataviz #dataviz
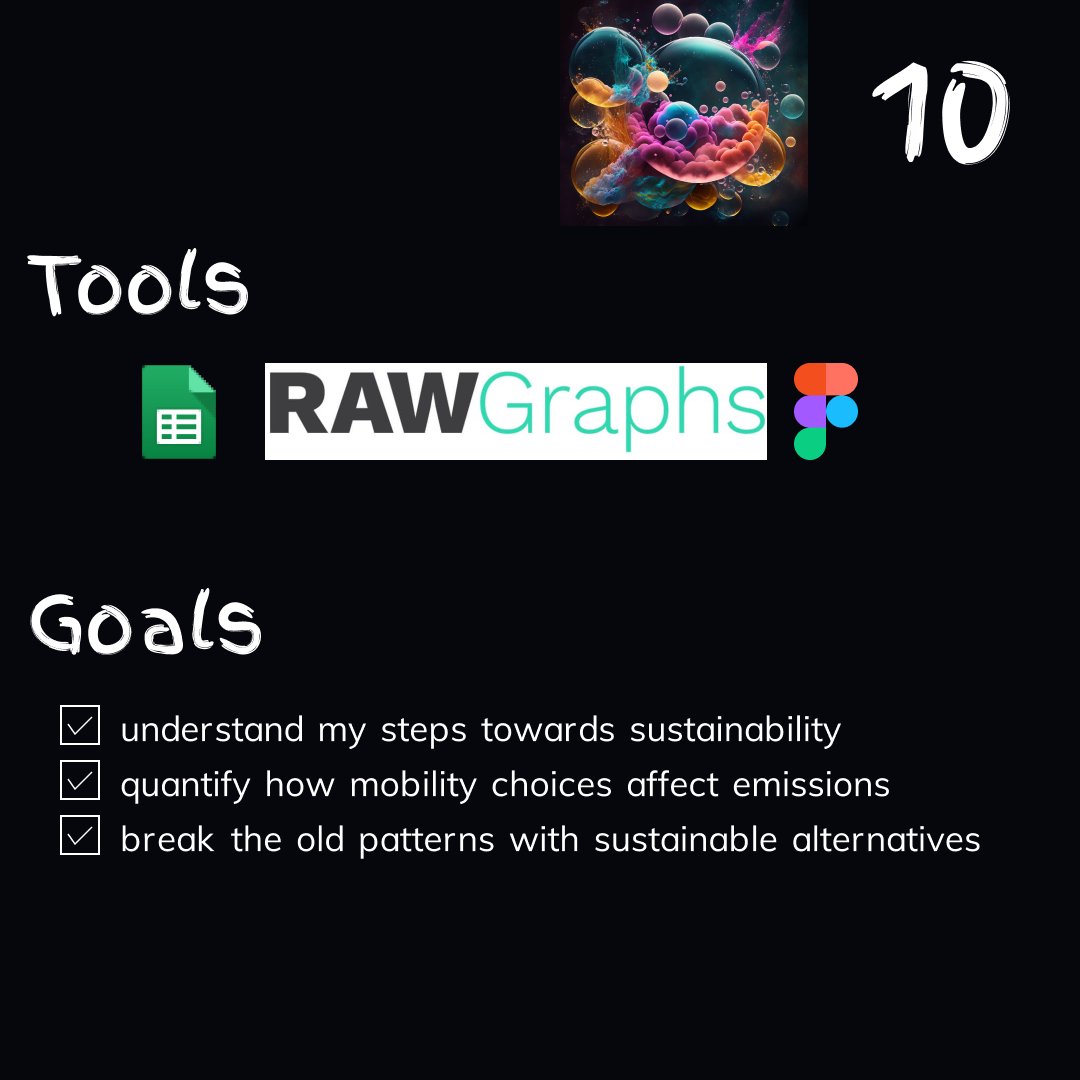
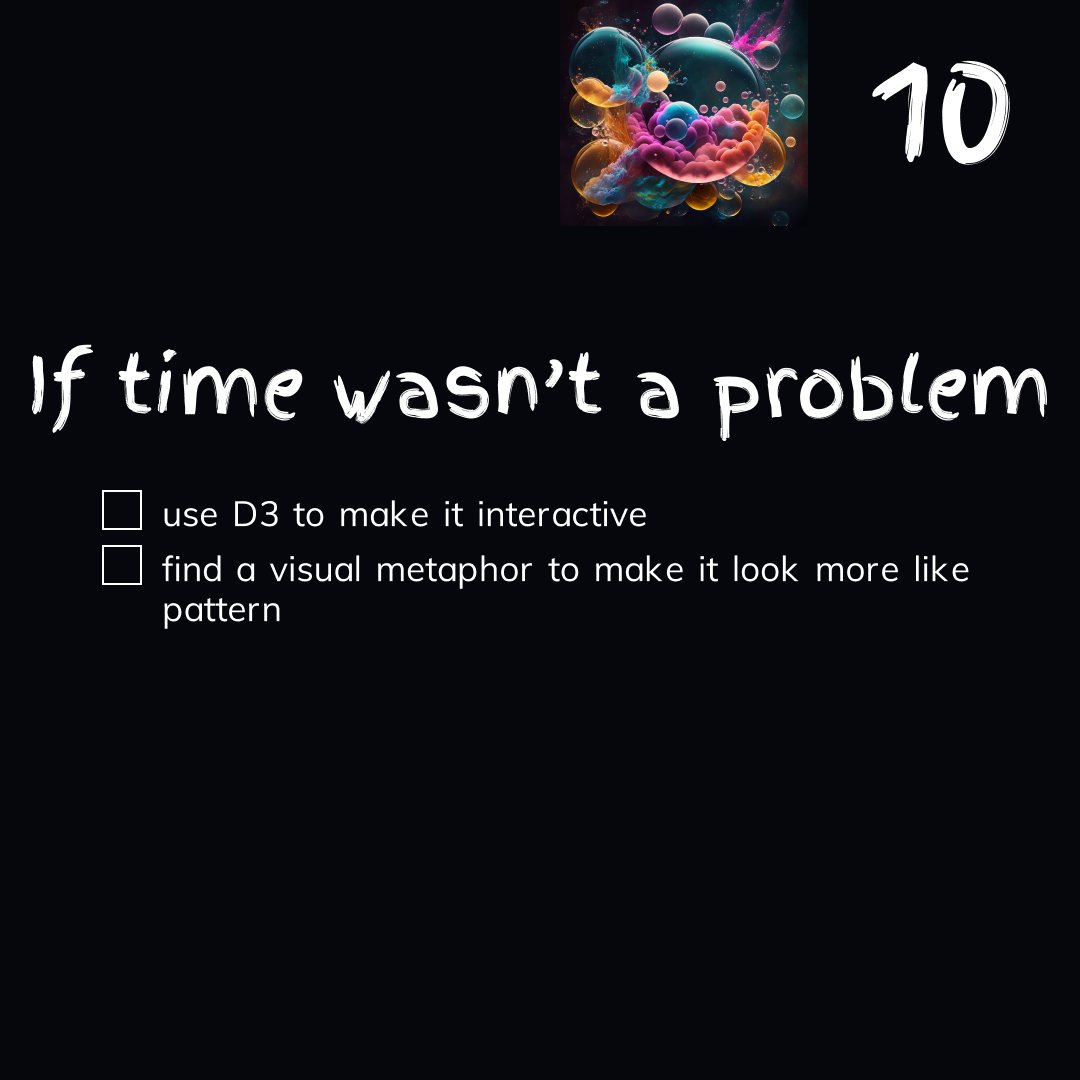
Although the initial idea was to do everything in Adobe illustrator, I just could not be bothered to figure things out and went back to tools I like, #rawgraphs and #figma. I am not too happy with the end result (not good enough), but take this as a learning step. #journaldataviz
A survey of online news users in #Nigeria who are between the ages of 18-50 revealed that 95% of the sample population uses online platforms as well as the social media to source for news. 🧑💻 #excel, #RAWGraphs & #adobeillustrator Data: Reuters Institute Digital News Report 2022

Parallel coordinates - It displays multiple continuous dimensions as axes, and each row in the dataset produces a line connecting its values across the axes. #RawGraphs

💡 i3 Tips Miriam Civiero ci introduce #RawGraphs, un'applicazione Web che semplifica l'attività di #dataVisualization rendendola accessibile per tutti. Leggi l'articolo di Miriam per saperne di più 👇 tinyurl.com/i3-tips-rawgra… #i3Tips #design #learnCodeDeployValue

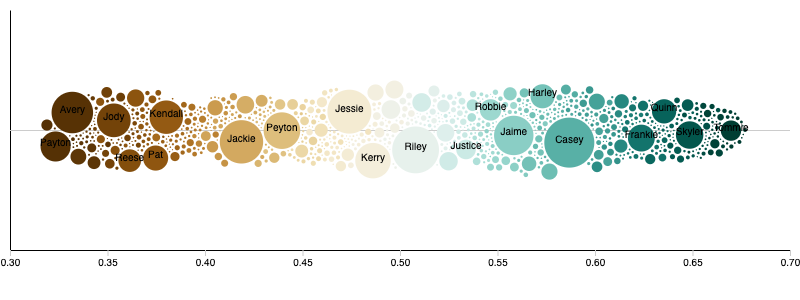
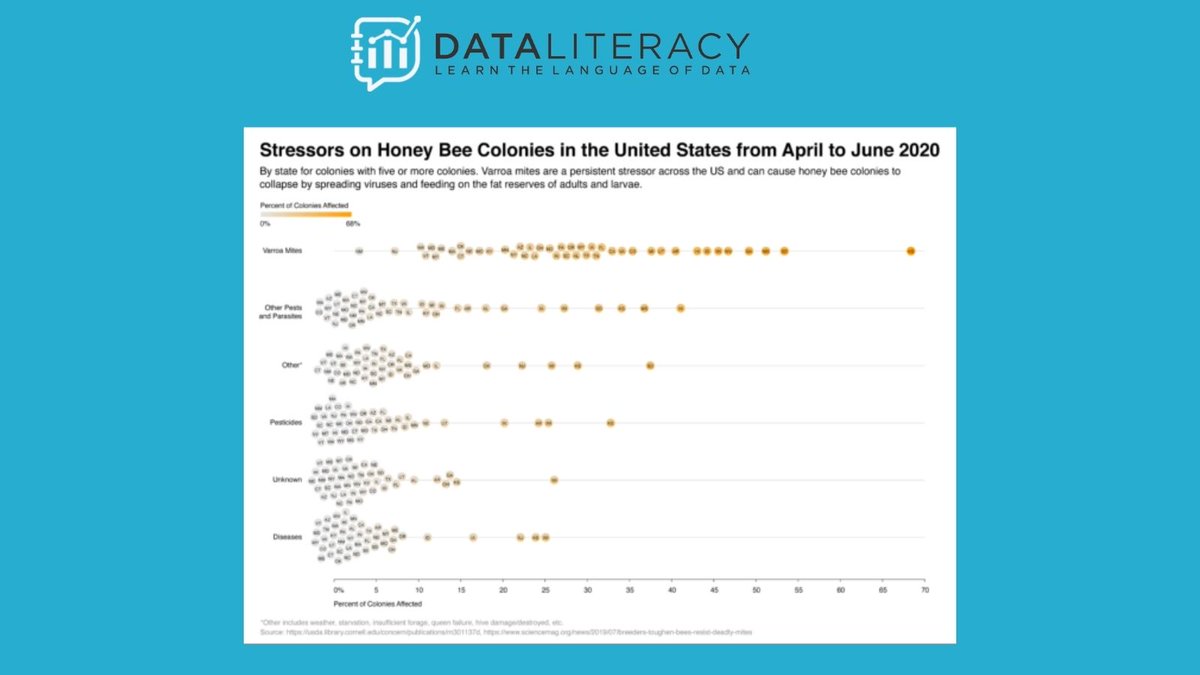
Happy National 🐝Day! Honor those buzzing beauties with this #DataViz tutorial from @AlliTorban and learn how to make this #beeswarmplot in under 15min using #Rawgraphs and #Powerpoint #Data #DataLiteracy hubs.ly/Q01bQJmr0


All the opening sequence deaths in #Supernatural, season 2 in #rawgraphs. A lot fewer, and many of them were visions of preventable deaths. docs.google.com/spreadsheets/d…
I do information visualization in daily work, often used Rawgraphs @rawgraphs Looking forward to version 2.0 If there is an internal test, I can test it! #DataVisualization #rawgraphs #dataviz
Data visualization has never been that fun! @ComSciCon you're nailing it 👌 #ComSciCon18 #RAWgraphs #DataBasic #ColorBrewer #Canva #Datawrapper #Palladio
在中国,我已第一时间同步了使用体验!非常的棒! #RAWGraphs @rawgraphs @densitydesign 直达阅读地址: mp.weixin.qq.com/s/XgqfTeTDuLBr… #datavisualization #dataviz #opensource #floss
The results show that, unlike women, men are very diverse in terms of age, but very little in terms of ethnicity. In any case, we can say that the representation of Caucasians is disproportionate. #dataviz #datavisualization #rawgraphs #AIArtwork #aiartcommunity #midjourney
8/ Visualize data with RAWGraphs! 📊 RAWGraphs uses AI to help creators turn raw data into interactive visualizations, offering a powerful tool for data-driven storytelling. #RAWGraphs #DataVisualization
#TidyTuesday week 9 - Long Beach Animal Shelter. I took a creative approach to data visualization by analyzing the primary colors of animals at the Long Beach Animal Shelter (2017–2024) using #Rstats #RawGraphs and #Figma #dataviz
A survey of online news users in #Nigeria who are between the ages of 18-50 revealed that 95% of the sample population uses online platforms as well as the social media to source for news. 🧑💻 #excel, #RAWGraphs & #adobeillustrator Data: Reuters Institute Digital News Report 2022
How to Create a Stunning Sankey Diagram in PowerPoint with RAWGraphs 2.0 (Free & Easy!) youtu.be/akG4x8_VvW4 #SankeyDiagram #PowerPoint #RAWGraphs
All the opening sequence deaths in #Supernatural, #season1 in #rawgraphs. Can't watch #season14 not until my spreadsheet is complete! docs.google.com/spreadsheets/d… @cw_spn

Although the initial idea was to do everything in Adobe illustrator, I just could not be bothered to figure things out and went back to tools I like, #rawgraphs and #figma. I am not too happy with the end result (not good enough), but take this as a learning step. #journaldataviz
Results confirmed my suspicion. Here is the data I collected. I must truly thank the rawgraphs.io team for creating a tool as powerful as it is easy to use! Bravə! 👏 #dataviz #datavisualization #rawgraphs
It's time to support #RAWGraphs: a free and #opensource software to visualize data. Check the campaign on #Indiegogo and choose a perk: igg.me/at/rawgraphs2 DONATE💰, SUPPORT🤝& SHARE📣! #datavisualization #dataviz #crowdfunding #RAWGraphs2
💡 i3 Tips Miriam Civiero ci introduce #RawGraphs, un'applicazione Web che semplifica l'attività di #dataVisualization rendendola accessibile per tutti. Leggi l'articolo di Miriam per saperne di più 👇 tinyurl.com/i3-tips-rawgra… #i3Tips #design #learnCodeDeployValue
The past month has been productive! Stay tuned for the public release of #RAWGraphs 2.0 and all these new charts 😏 #dataviz #datavisualization #charts #data #opensource
Do you want to learn how to use #RAWGraphs for your data visualization projects? We are organizing a 2-hour webinar in October for you! Buy your ticket here: eventbrite.com/e/data-visuali… #Datavisualization #webinar #opensource #dataviz #graphicdesign #DataScience #dh

#figma, #rawgraphs, lots of search in the email history to find the flights and use of icao.int/environmental-… to quantify the C02 emitted. #metajournal #journaldataviz #dataviz
- 1 to our #crowdfunding campaign!! Are you ready to support the design and development of a brand new version of #RAWGraphs ?!?!? #sapevatelo #opensource #datavisualization #dataviz #datajournalism #mondaymotivation indiegogo.com/projects/rawgr…
Something went wrong.
Something went wrong.
United States Trends
- 1. Good Friday 44.3K posts
- 2. LINGORM DIOR AT MACAU 247K posts
- 3. #GenshinSpecialProgram 12.7K posts
- 4. Josh Allen 41.8K posts
- 5. #FridayVibes 3,247 posts
- 6. Four Seasons 13.3K posts
- 7. Texans 61.1K posts
- 8. #GenshinImpact 63.8K posts
- 9. #FridayMotivation 2,254 posts
- 10. Bills 151K posts
- 11. Niger 54.8K posts
- 12. Cole Palmer 14.1K posts
- 13. Openmind 50.9K posts
- 14. Beane 3,037 posts
- 15. Joe Brady 5,384 posts
- 16. Traitor 116K posts
- 17. Infinit 83.5K posts
- 18. Davis Mills 9,144 posts
- 19. George Burns 1,250 posts
- 20. Seditious 186K posts