#matplotlib 搜索结果


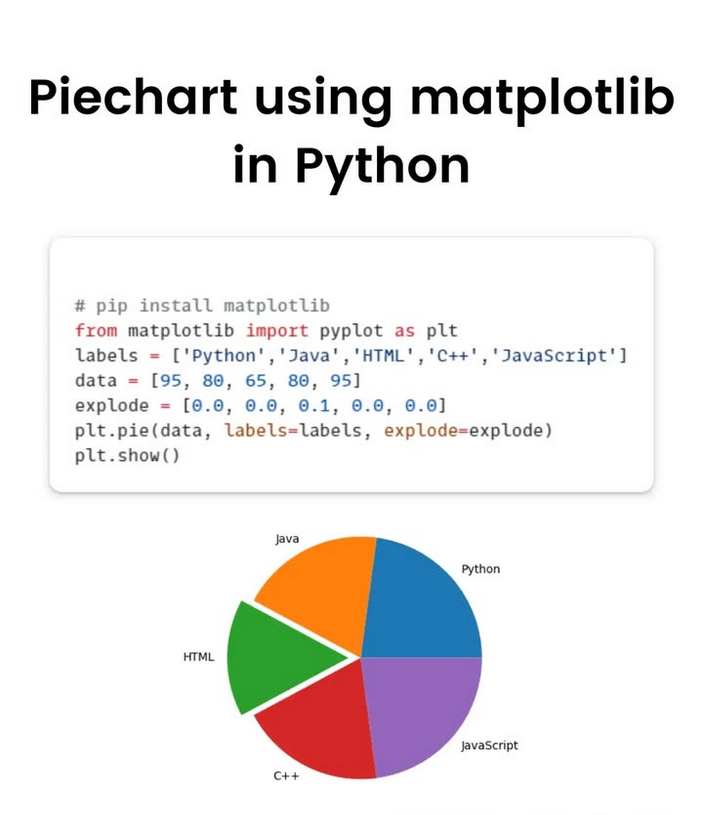
Day 20: Learned pie charts in Matplotlib — explode, wedgeprops, shadow, startangle, autopct & why overcrowding pie charts hurts readability. Choosing the right chart matters! 🚀📊 #DataScience #Matplotlib #Python #LearningInPublic

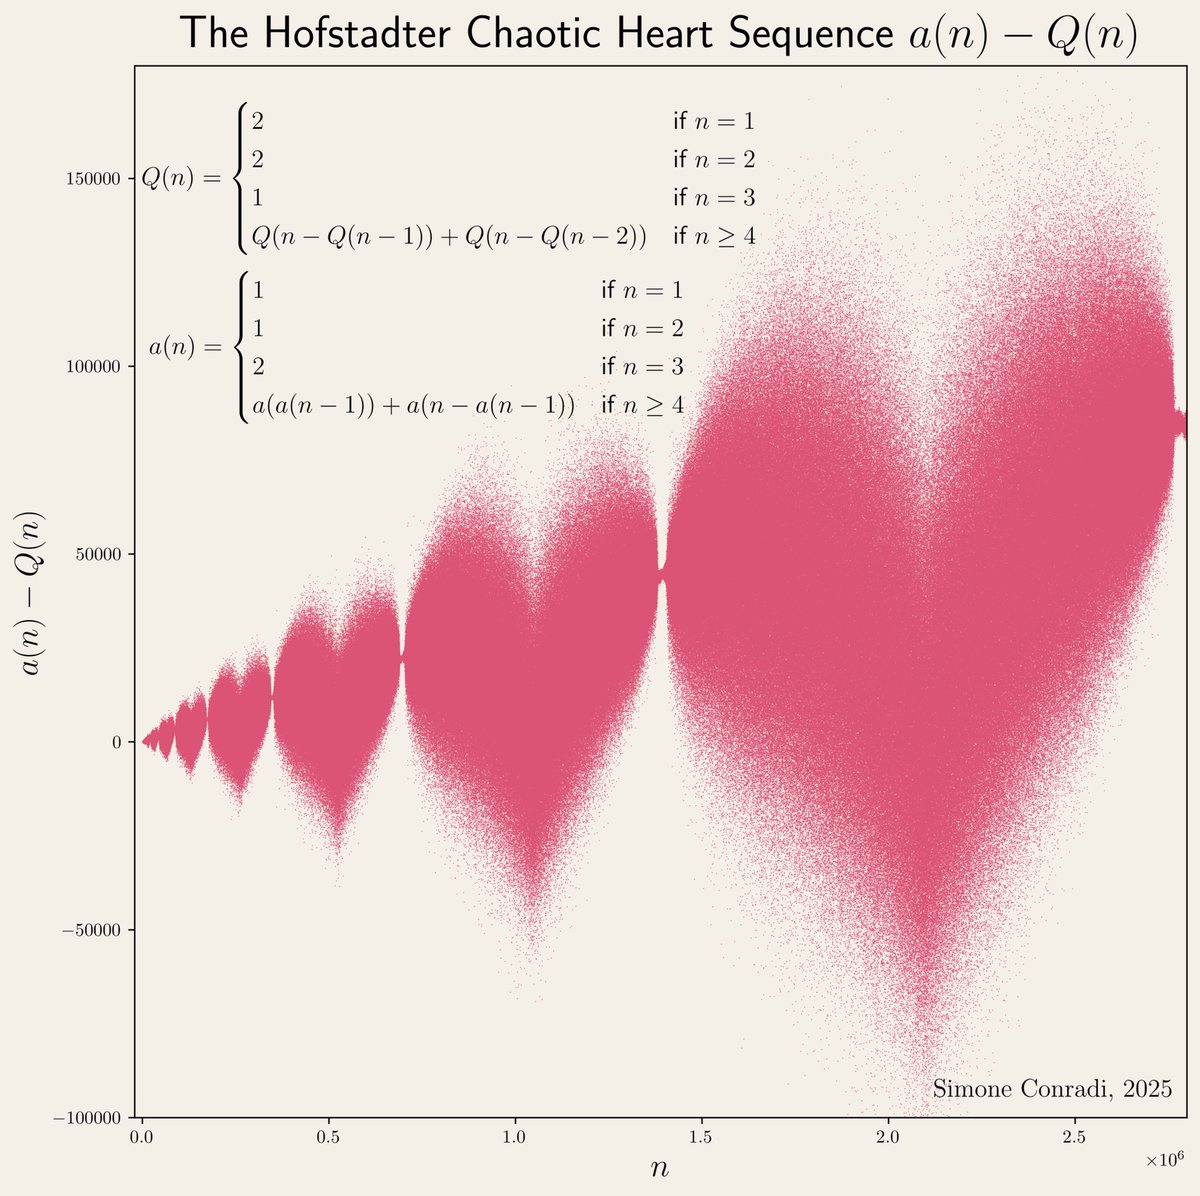
It's amazing to see the beauty of mathematics, try to reproduced this with runcell AI Agent, it's real! Try it runcell.dev #math #visualization #matplotlib

How to Rotate Tick Labels in #Matplotlib pythonguides.com/matplotlib-rot…
Day 19: Learned more about bar charts — bar width, side-by-side bars, horizontal charts with barh(), and adding labels using plt.text(). Bar charts are more powerful than they look! 🚀📊 #DataScience #Matplotlib #LearningInPublic
Date Format and Convert Dates in #Matplotlib plot_date pythonguides.com/matplotlib-plo…
pythonguides.com
Date Format and Convert Dates in Matplotlib plot_date
Learn how to change date format and convert dates in Matplotlib plot_date using Python. Step-by-step guide with examples for US-based time-series data.
Create and Customize Dashed Lines in #Matplotlib pythonguides.com/matplotlib-das…
Day 18: Learned Matplotlib styling — format strings, colors, line styles, widths, layout tweaks, even xkcd mode. Also got a quick intro to bar charts. Loving the visual side! 🚀📊 #DataScience #Python #Matplotlib #LearningInPublic

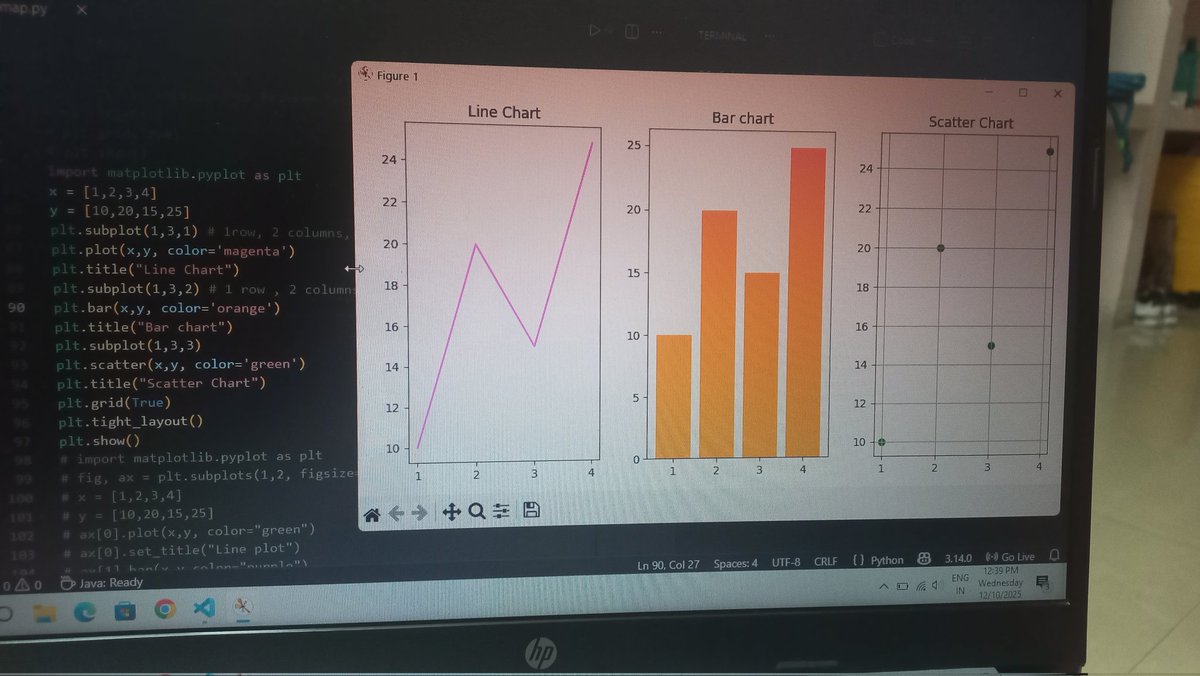
Professional & Learning-focused 📊 Learning Data Visualization with Python! Explored Line, Bar, and Scatter charts using Matplotlib—small practice, big clarity in understanding data patterns. 🚀 #Python #Matplotlib #DataVisualization #Learning
Day 17: Learned plotting with Matplotlib — added labels, drew multiple lines, and understood why direct labels can be clearer than legends. Visualization is getting fun! 🚀📈 #DataScience #Python #Matplotlib #LearningInPublic
Set Loglog Log Scale for X and Y Axes in #Matplotlib pythonguides.com/matplotlib-log…
pythonguides.com
Set Loglog Log Scale for X and Y Axes in Matplotlib
Learn how to set log-log scale for X and Y axes in Python Matplotlib with step-by-step methods, practical examples, and code for clear data visualization.
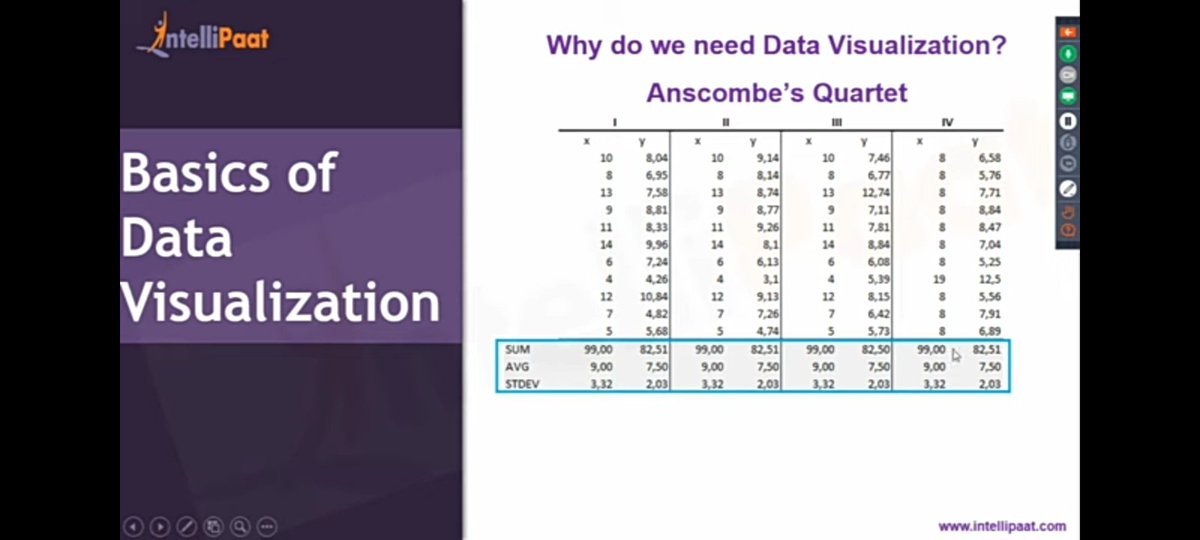
Day 16: Learned why data visualization matters, the difference between exploratory vs explanatory visuals, and got a basic intro to Matplotlib. Excited for the visual side of Data Science! 🚀📊#DataScience #Matplotlib #Python #LearningInPublic
Add Horizontal Line in #Matplotlib Subplots pythonguides.com/add-horizontal…
pythonguides.com
Add Horizontal Line in Matplotlib Subplots
Learn step-by-step how to add a horizontal line in Matplotlib subplots using Python. Includes full code examples, practical tips, and multiple methods.
Set Titles for Each Subplot and Overall Title in #Matplotlib pythonguides.com/set-titles-for…
pythonguides.com
Set Titles for Each Subplot and Overall Title in Matplotlib
Learn how to set titles for each subplot and add an overall title in Python Matplotlib. Step-by-step methods with full code examples explained simply.
Plot Multiple Lines in Subplots Using #Matplotlib pythonguides.com/matplotlib-plo…
Work with Loglog Log Scale and Adjusting Ticks in #Matplotlib pythonguides.com/matplotlib-log…
pythonguides.com
Work with Loglog Log Scale and Adjusting Ticks in Matplotlib
Learn how to use log-log scale and adjust ticks in Matplotlib with Python. Step-by-step methods, code examples, and tips for better data visualization.
Invert the Y-Axis in #Matplotlib pythonguides.com/matplotlib-inv…
Plot Multiple Lines of Different Lengths in #Matplotlib pythonguides.com/plot-multiple-…


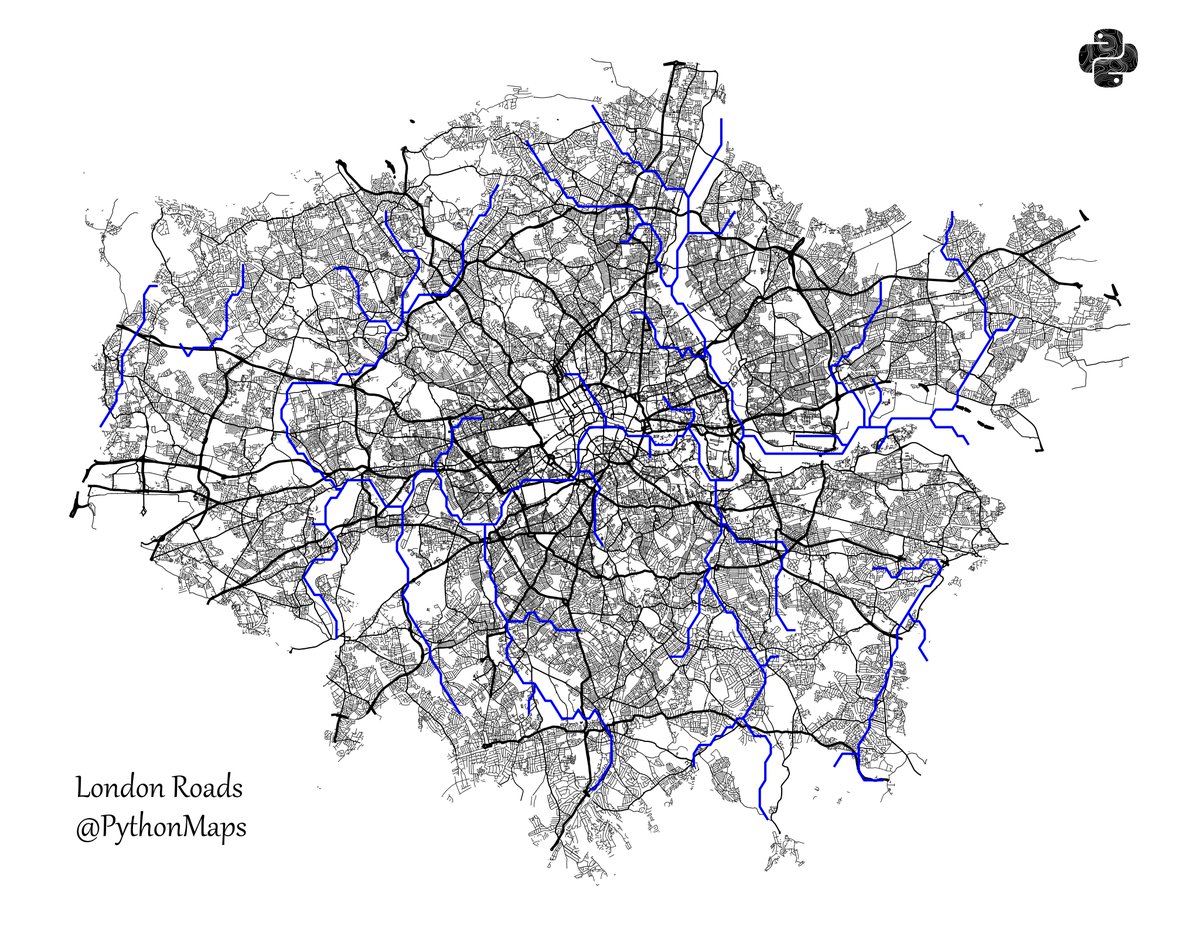
Roads of London! This map was generated using #Matplotlib #Numpy #Geopandas. #Python #DataScience #Data #DataVisualization #London.

Whitebox Workflows can now interact with #matplotlib to make beautiful visualization of raster, vector, and #lidar #geospatial data. #geopython #gis #gischat #geovis More examples here: whiteboxgeo.com/manual/wbw-use…


#30DayMapChallenge Day 1: Points Incendios activos en Sudamérica las últimas 24 h. Source: VIIRS Active Fires #matplotlib #geopandas


Day 11 of my AI Journey 📊 Started with the basics of Data Visualization today! Learned simple plots with Matplotlib: line, bar, and scatter. Next → Seaborn for advanced charts. #AI #Python #Matplotlib #100DaysOfCode #DataScience

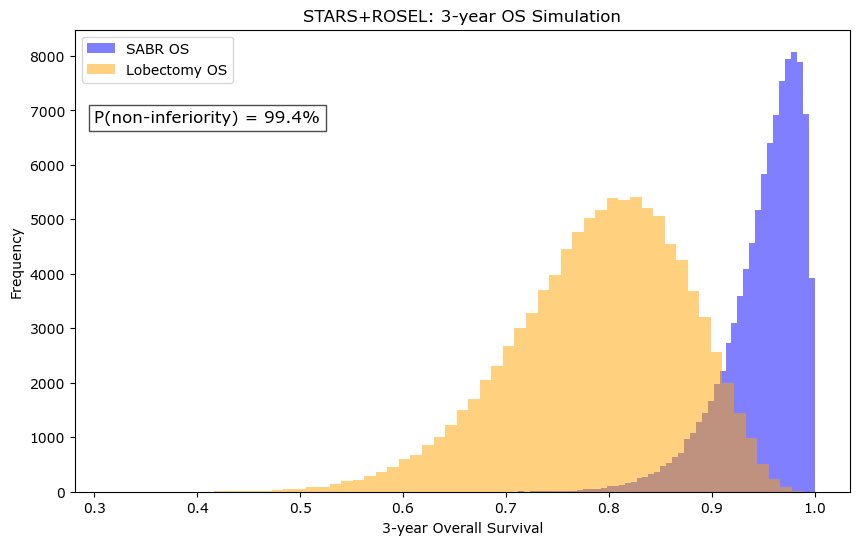
❗️ As VALOR accrues, what is the existing data from STARS ROSEL that SBRT is non-inferior to lobectomy? Using beta moment matching and sampling from this, assuming 5% NI margin, my bet is on SBRT #numpy #matplotlib


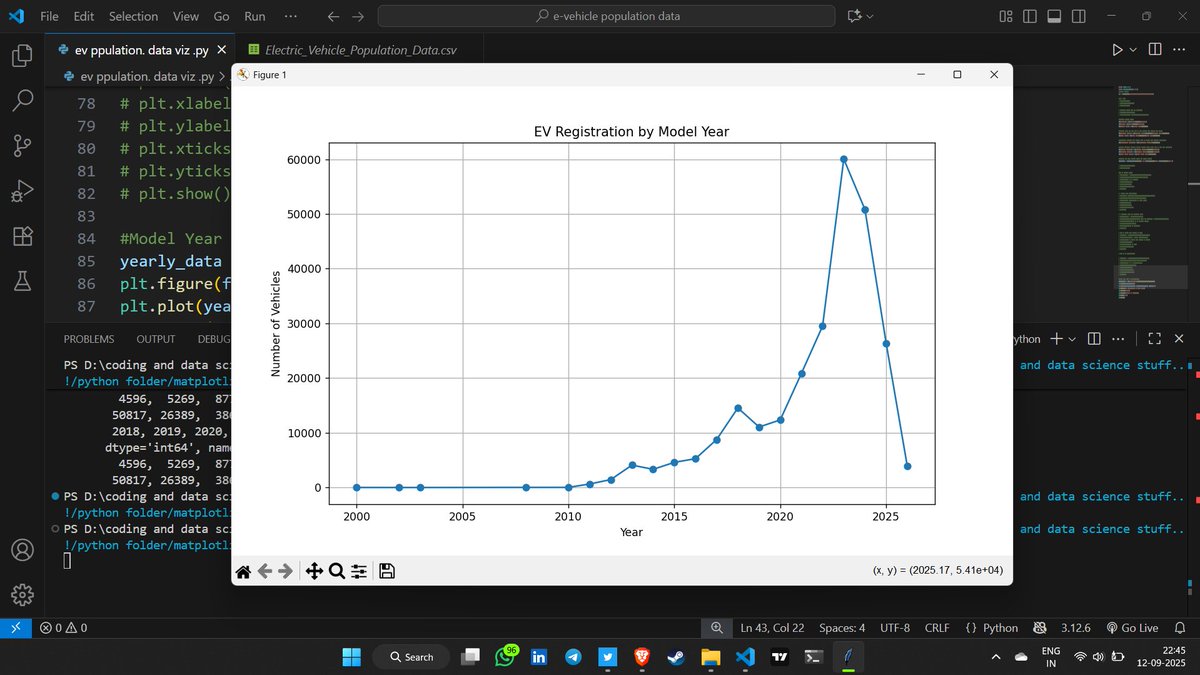
🚀 Day 34 #DataScience Journey! Practiced Python matplotlib on EV dataset today 📊 Getting better at data visualization! Tomorrow exploring new dataset - excited for fresh challenges 💪 Consistency = Growth! 📈 #Python #Matplotlib #DataVisualization #LearningInPublic

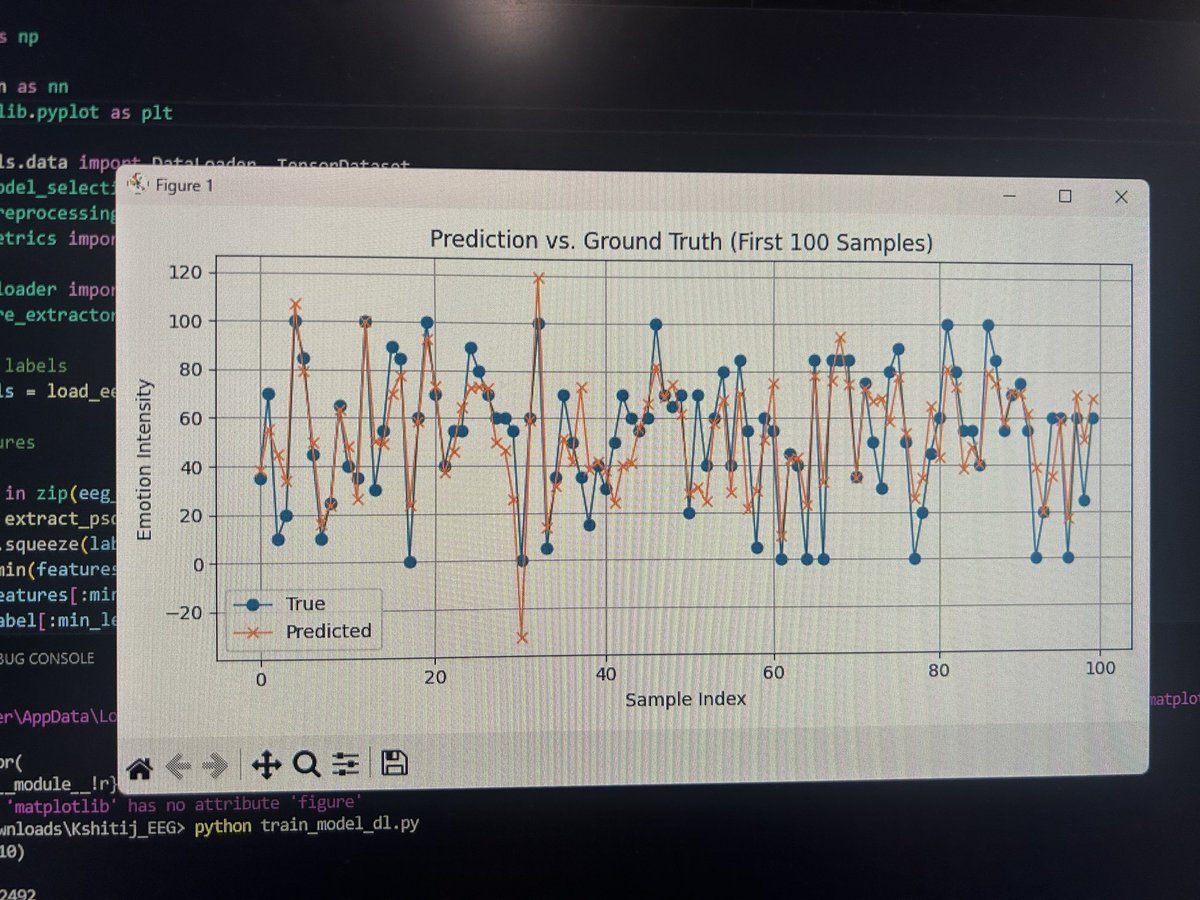
It worked 🎉 istg it feels soo good when you are trying to make a model for a research and the visualisation from @matplotlib makes you feel like you are getting somewhere! #matplotlib #Research #machinelearning


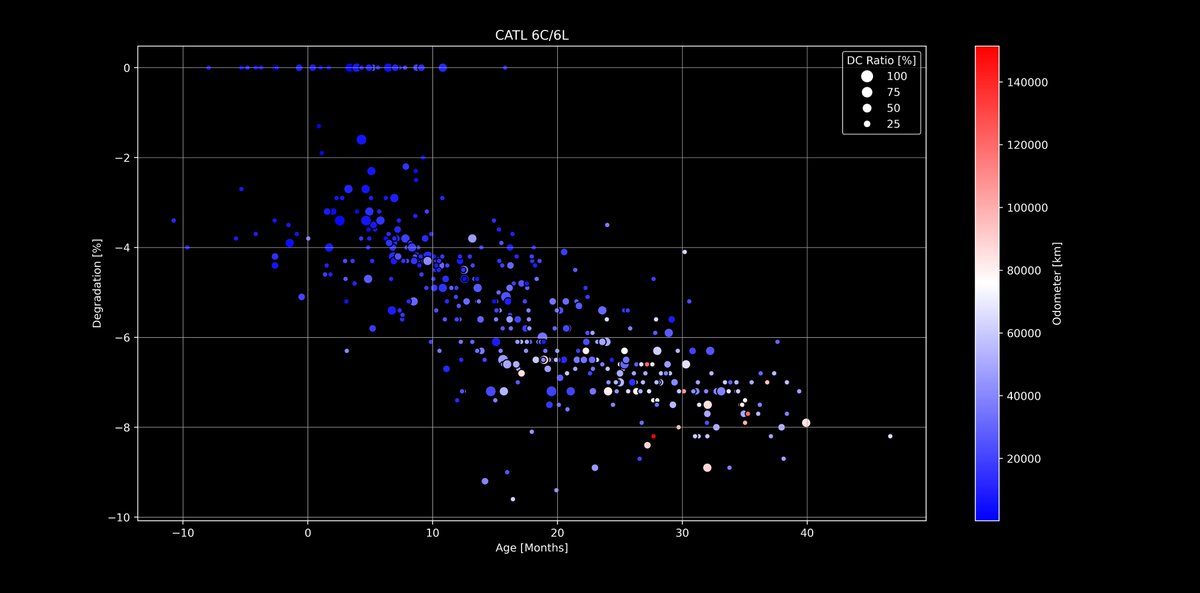
🔋#Tesla Battery Degradation - Next level dive!🪫 Using #Matplotlib I have added two more axis to the evaluations that you already know. I will continue with other packs and values, but LFP was interesting as a start 🙂 Any ideas what to combine next? docs.google.com/spreadsheets/d…


matplotlib豆知識 subplots で作成した余分な Axes を remove() で簡単に除外できます! 中身のないグラフ枠を削除して、見やすいレイアウトに仕上げられます #Python #matplotlib


📊⌨️ ¡Con el taller de Ciencia de Datos continuamos con el tercer día del seminario de #IA! Durante el taller, impartido por el Dr. Eric Castro de @SUNEO_UNSIS, desarrollamos competencias para analizar datos con herramientas como #pandas y #matplotlib para la toma de decisiones.


Something went wrong.
Something went wrong.
United States Trends
- 1. Bondi Beach 155K posts
- 2. Australia 200K posts
- 3. Gunther 92.8K posts
- 4. Hanukkah 56K posts
- 5. Spurs 72.7K posts
- 6. John Cena 576K posts
- 7. Naveed Akram 8,536 posts
- 8. #SNME 300K posts
- 9. #ThankYouCena 460K posts
- 10. Wemby 51.6K posts
- 11. Triple H 101K posts
- 12. Brown University 231K posts
- 13. Good Sunday 57.1K posts
- 14. Chanukah 13.7K posts
- 15. Chet 17K posts
- 16. TOP CALL 6,415 posts
- 17. #JungkookxElleKorea 78K posts
- 18. Chrisean 7,286 posts
- 19. Caruso 8,051 posts
- 20. #UFCVegas112 21.9K posts