#rprogramming 검색 결과

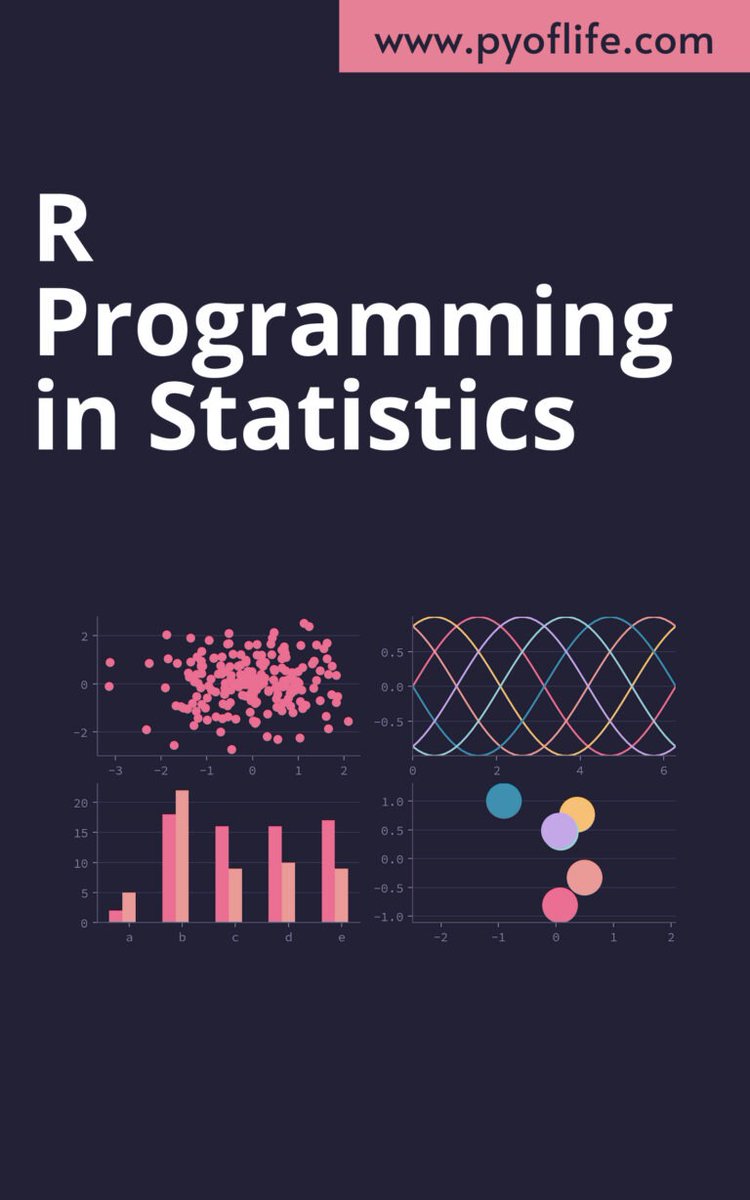
Statistics, the art of deciphering patterns and insights from data, is akin to unraveling the intricate threads of a tapestry. pyoflife.com/r-programming-… #DataScience #rprogramming #statistics #Rstats #MachineLearning #datavisualizations #datascientists

Why R beats SPSS, Stata & SAS! (Data Science) #Rprogramming #DataAnalysis #OpenSource #DataVisualization #StatisticalAnalysis #ReproducibleResearch #ProgrammingTutorial #LearnR #DataScience #RStats
Quarto combines content & code for outputs like PDFs & dashboards. It creates reproducible documents, updating automatically as data changes. Control look & feel, plus code visibility. #RProgramming #Quarto
📌📘R provides a powerful set of tools for advanced analytics and graphics. In this textbook, we’ll discuss the features of R that make it suitable for advanced analytics and graphics. pyoflife.com/r-for-everyone… #DataScience #rprogramming #rstats #DataScientists #datavisualization

Exploring the configuration of sidebar layouts in R, including the use of slider inputs for dynamic data manipulation and graphic rendering. Learn how to create interactive elements and reference input values within your code. #Rprogramming #ShinyApp
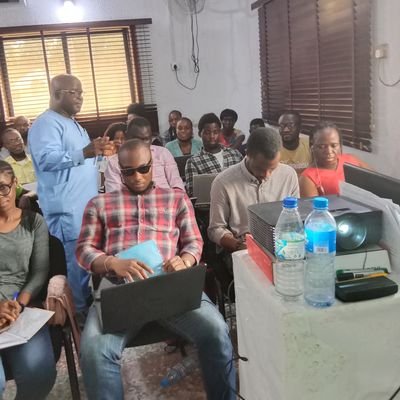
Day 2 of our R Programming Workshop featured sessions on Data Visualization, a Q&A segment, and certificate distribution. Dr. Ajay Kumar Koli was felicitated for his contribution. Vote of Thanks by Dr. Harchand Ram wrapped up the event. #RProgramming #DataAnalysis


📊 Master R for Bioinformatics! 🧬 𝘑𝘰𝘪𝘯 𝘰𝘶𝘳 10-𝘥𝘢𝘺 𝘵𝘳𝘢𝘪𝘯𝘪𝘯𝘨 𝘱𝘳𝘰𝘨𝘳𝘢𝘮 𝘧𝘰𝘳 𝘩𝘢𝘯𝘥𝘭𝘪𝘯𝘨 𝘢𝘯𝘥 𝘢𝘯𝘢𝘭𝘺𝘻𝘪𝘯𝘨 𝘣𝘪𝘰𝘭𝘰𝘨𝘪𝘤𝘢𝘭 𝘥𝘢𝘵𝘢. More Information: ✉️ [email protected] 📞 +91 6398142849 #Bioinformatics #RProgramming #DataAnalysis

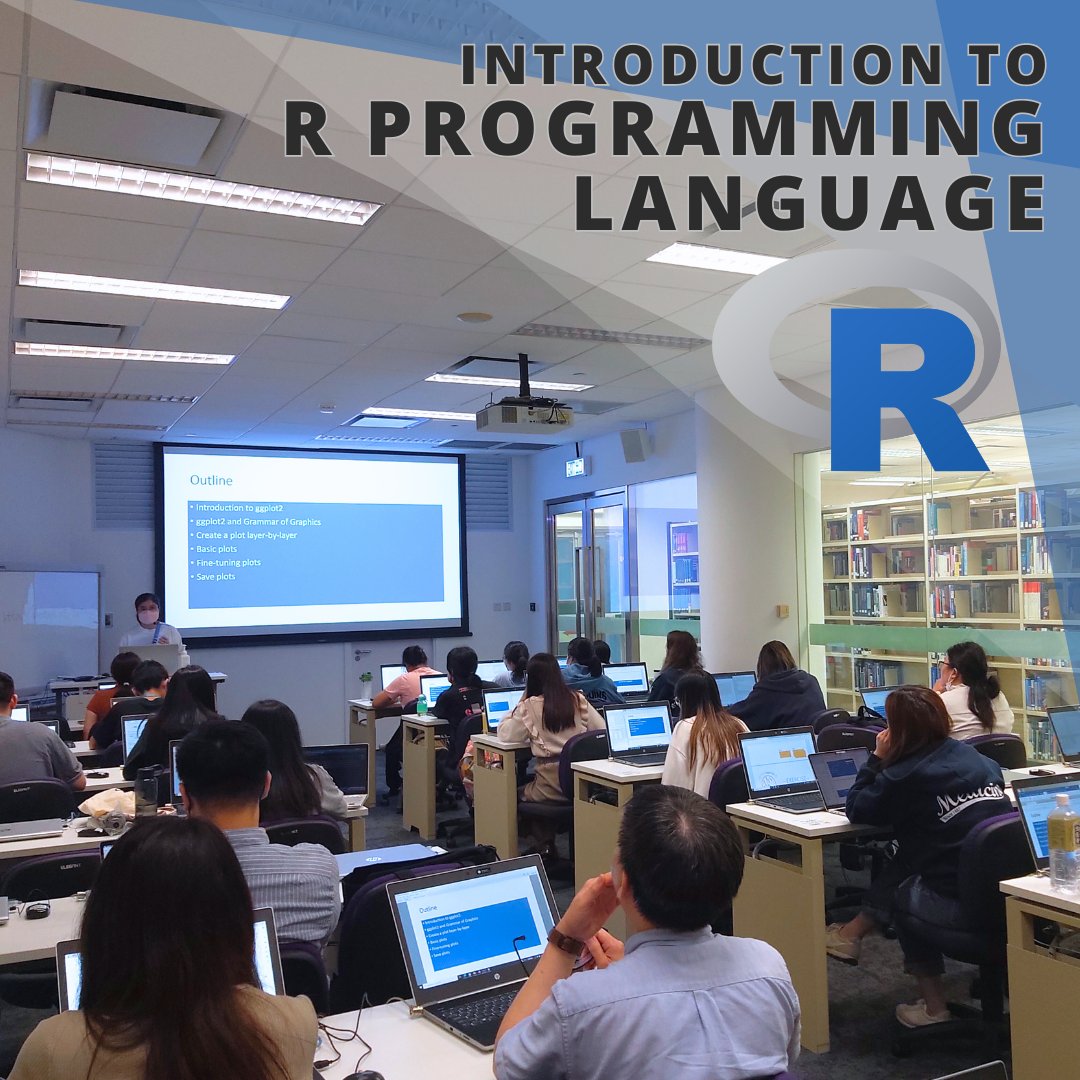
🚀 Hosted a full-day R programming session today! Introduced the R language, uncovered the potentials of tidyverse, and got creative with ggplot. It was a day filled with enjoyable and interactive learning! #RProgramming #DataScience #InteractiveLearning 📊👨🏫📘🎉


Does anyone have a copy or know if this was published? "R Pocket Guide" by Joseph Adler @jadler #RLang #RProgramming


How to start a project in R studio #RProgramming #RStudio #DataAnalysis #DataScience #ProgrammingTutorial #LearnR #DataImport #DataManipulation #Coding #DataScienceTips
Master Geospatial Plots with R: A Code Walkthrough #Rprogramming #ggplot2 #geospatial #dataviz #Rstats #mapping #visualization #tidyverse #gis #coding
Chi-Squared Test: Finally Understand It! (R Tutorial) #ChiSquaredTest #RProgramming #DataAnalysis #GoodnessOfFit #Tidyverse #Forcats #DataVisualization #HypothesisTesting #NestedKnowledge #StatisticsTutorial


DDCS Dept. is hosting a Hybrid Training Program on Data Science with Python & R from 20–24 May 2025, 7:00 PM daily. Focus: Stats, visualization, real-world applications & industry skills. #DataScience #Python #RProgramming #DDCS #HybridTraining #CareerSkills

Unlock R list ninja skills! Discover the 'pluck' function for elegant data extraction, plus pro tips for nested assignments. "Many right ways to do most things." #rstats #DataScience #RProgramming

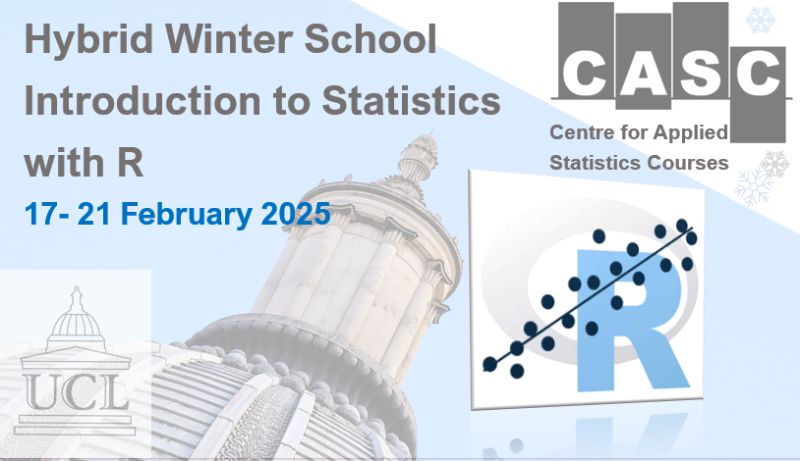
Hybrid Winter School: Introduction to Statistics with R📣 17-21 February 2025 Register for our incredibly popular Winter School. A five-day winter school teaching you fascinating new statistical skills. #stats #Statistics #rprogramming Book Here! ucl.ac.uk/child-health/e…
R Mapping Tutorial: Create Stunning World Maps #RProgramming #DataVisualization #GeoSpatial #MappingWithR #LearnToCode #DataAnalysis #ProgrammingTutorial #RStats #GIS #YouTubeEducation
Linear regression is a widely used statistical modeling technique for predicting the relationship between a dependent variable and one or more independent variables. pyoflife.com/how-to-build-l… #DataScience #rprogramming #mathematics #DataScientists #MachineLearning #codinglife


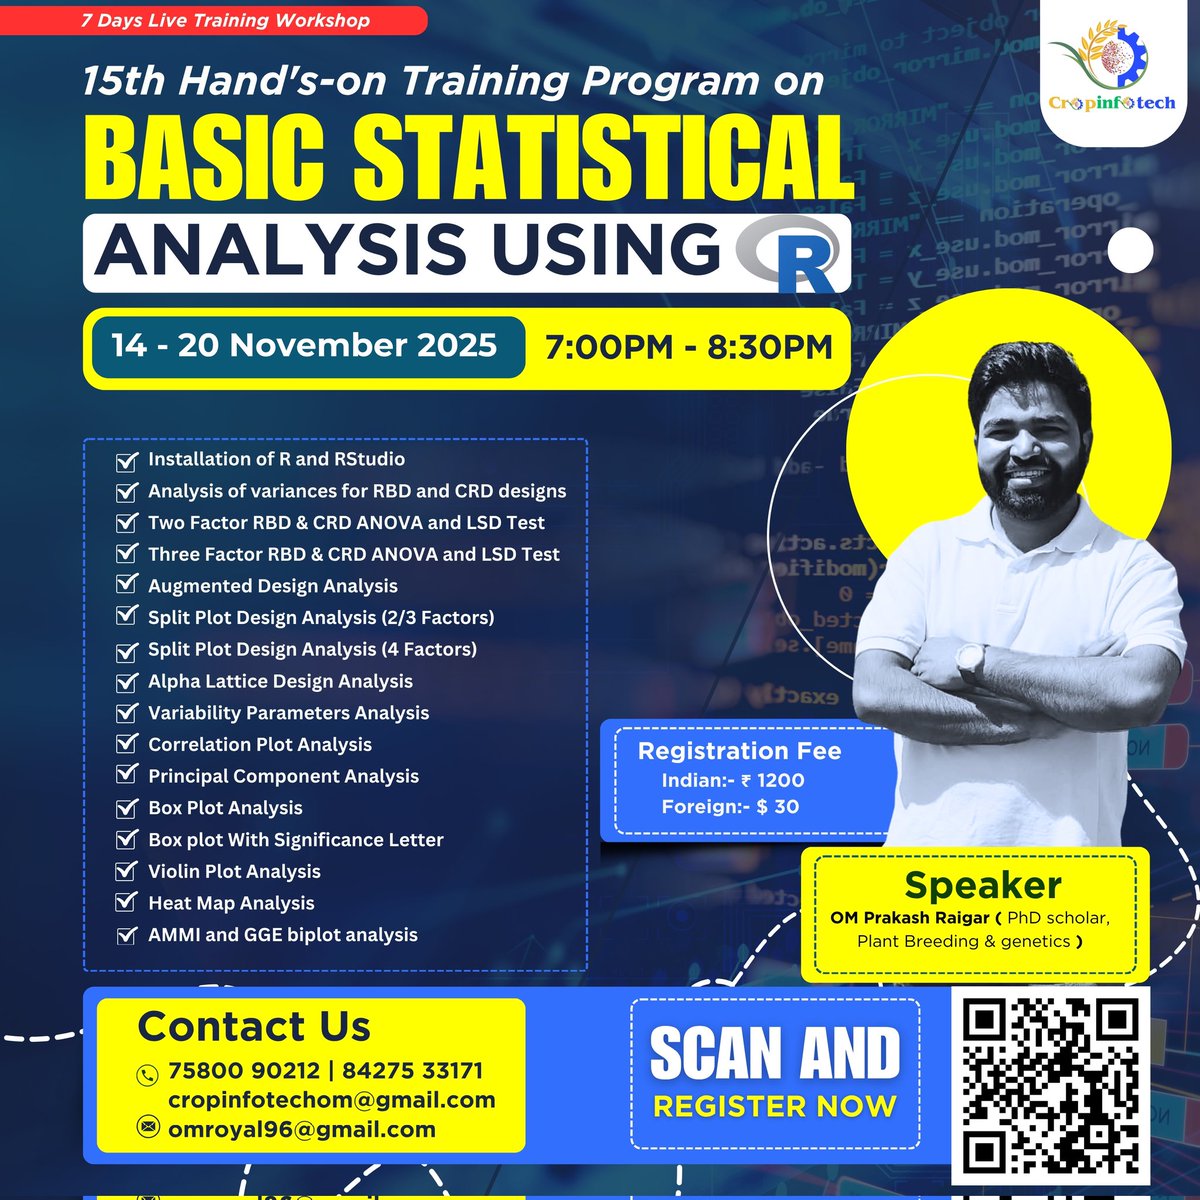
🚀 Master the Power of Data with R! 👉 Register Now – Limited Seats Available! 🔗 cropinfotech.in #RProgramming #StatisticalAnalysis #CropInfotech #DataScience #RTraining #PlantBreeding #AgriculturalResearch #Workshop #LearningByDoing #ResearchTools
Quarto combines content & code for outputs like PDFs & dashboards. It creates reproducible documents, updating automatically as data changes. Control look & feel, plus code visibility. #RProgramming #Quarto


Behind every credible paper is a well-analyzed dataset. Data clarity is not optional; it’s the lifeline of research credibility. #DataAnalysis #RProgramming #Biostatistics #YinkaOKOHonResearch

Building a Command-Line Quiz Application in R | Towards Data Science #RProgramming #DataScience #QuizApplication #CommandLine #ControlFlow #InputHandling #FunctionsInR #LearnR #DataScienceProject #ProgrammingSkills #QuestionBank #RQuiz #CodePractice towardsdatascience.com/building-a-com…

R Programming: Expanding your R skills with loops, functions and more📣 26 November 2025 This course introduces topics for R for those already familiar with the programming language. #stats #datasicience #rprogramming Book Here! ucl.ac.uk/population-hea…

Foundations of Data Analysis with R📣 29 October 2025 This course aims to familiarise participants with the R interface and the R language #datascience #rprogramming #stats #statistics Book Here! ucl.ac.uk/population-hea…


Post 🚀 New Blog Out! Cluster Analysis in R: The Ultimate Power Guide to Unsupervised Learning Techniques Learn how to implement clustering methods like K-Means, and DBSCAN in R with real-world examples! 📊 View👉 dataexpertise.in/cluster-analys… #ClusterAnalysis #RProgramming #ML


Statistics, the art of deciphering patterns and insights from data, is akin to unraveling the intricate threads of a tapestry. pyoflife.com/r-programming-… #DataScience #rprogramming #statistics #Rstats #MachineLearning #datavisualizations #datascientists
📌📘R provides a powerful set of tools for advanced analytics and graphics. In this textbook, we’ll discuss the features of R that make it suitable for advanced analytics and graphics. pyoflife.com/r-for-everyone… #DataScience #rprogramming #rstats #DataScientists #datavisualization

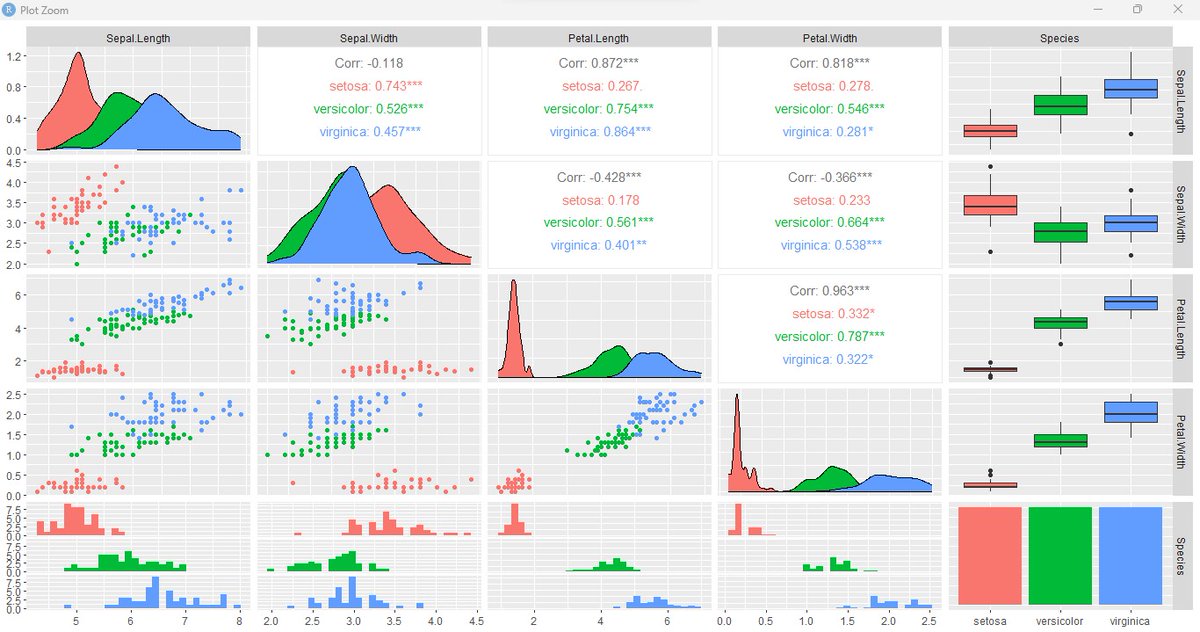
Still on R programming, while ggplot uses multiple lines of code, GGally produces a lot more information for a single line of code. library(GGally) ggpairs(iris, mapping=ggplot2::aes(colour = Species)) #Rprogramming #RStats #RStudio #DataScience #DataAnalytics


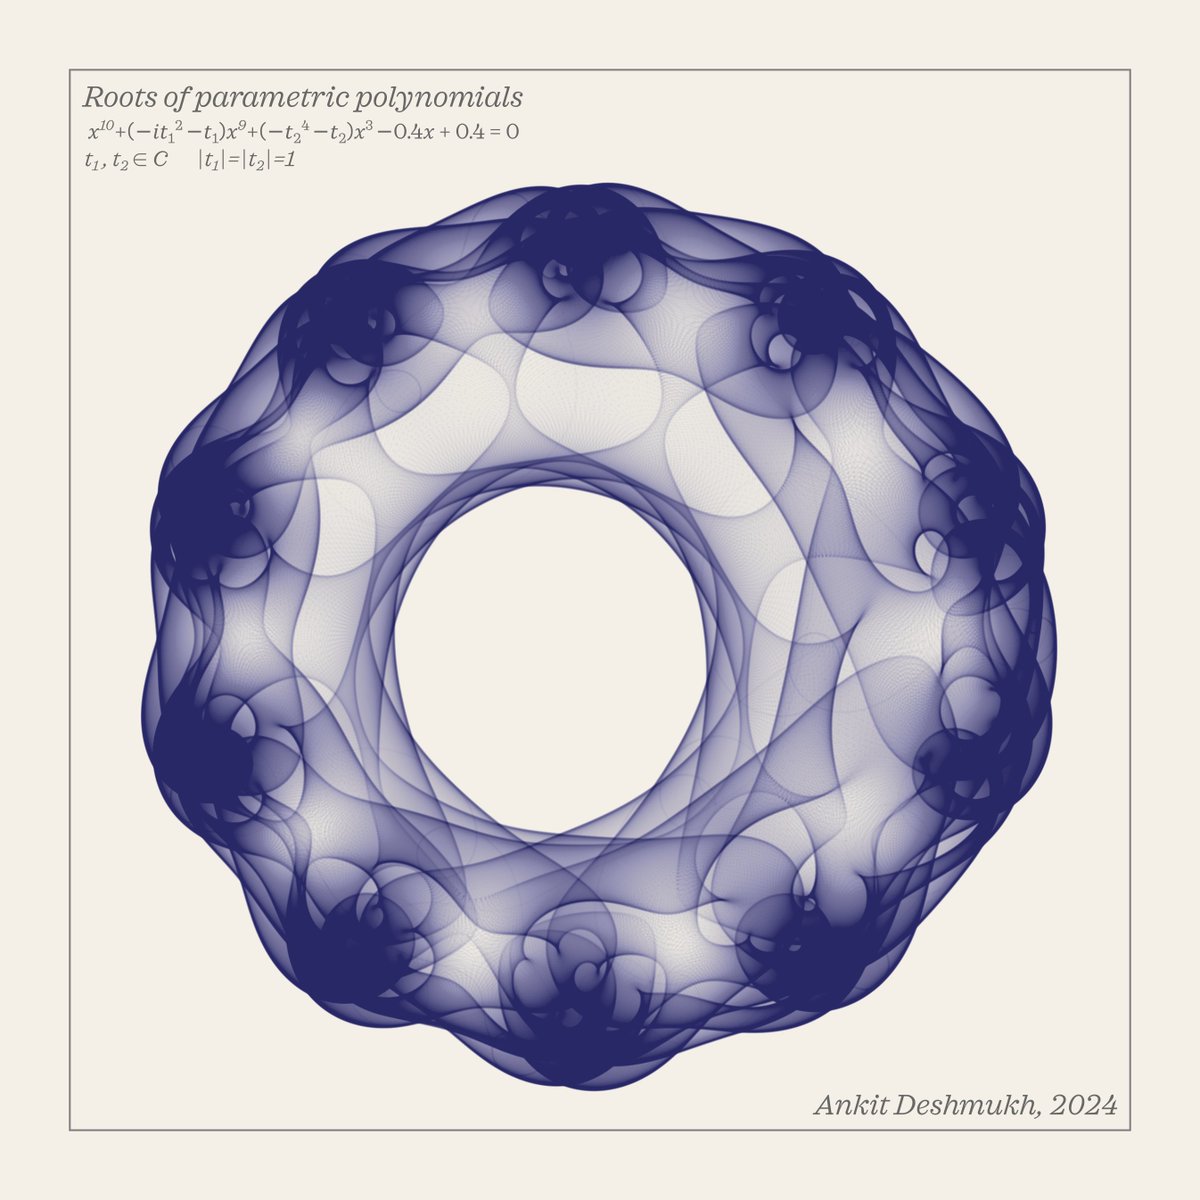
Roots of parametric polynomials, adopted from @S_Conradi, created with #rprogramming, #tidyverse, and @inkscape

Growth rate of FBR(2001-10) & BRA(2016-23) in Sales tax services. @Noorbaloch72 @BRA_Quetta #Rprogramming

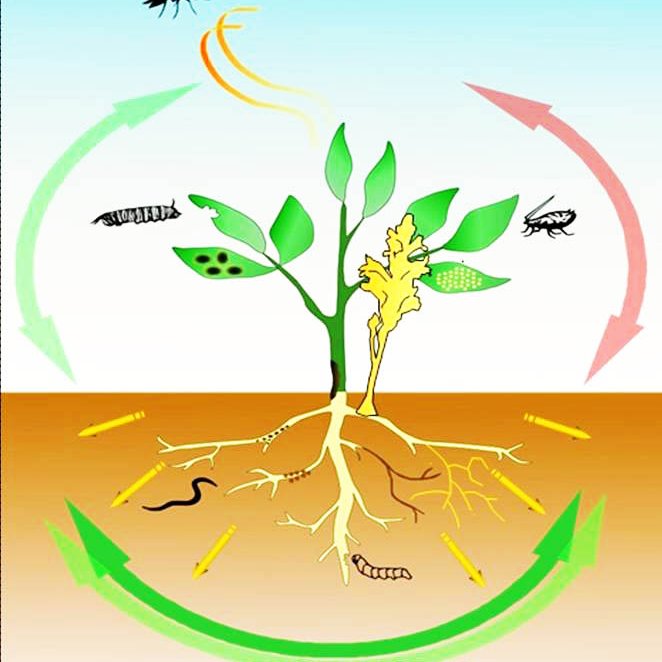
📊 Excited to have Bea as our guide into the world of analyzing biological data with statistics in R! 🧬🔬 #BiologicalData #Statistics #RProgramming"


Our R for Biochemists 101 course is tailor-made for newcomers, guiding you to master R at your comfort speed. Enrol today for a knowledge boost starting 11 September! #RProgramming ow.ly/A51650PyrKQ

Day 17: Flow #30daymapchallenge Sri Lanka rivers and streams another map made with my package ceylon #rstats #rprogramming

DDCS Dept. is hosting a Hybrid Training Program on Data Science with Python & R from 20–24 May 2025, 7:00 PM daily. Focus: Stats, visualization, real-world applications & industry skills. #DataScience #Python #RProgramming #DDCS #HybridTraining #CareerSkills

Our workshop on 26/4 introduced participants to basics of R and RStudio. With practical sessions focused on manipulating biological data tables, participants gained valuable hands-on experience. #Bioinformatics #RProgramming #RProgrammingLanguage #DataManipulation #BiologicalData
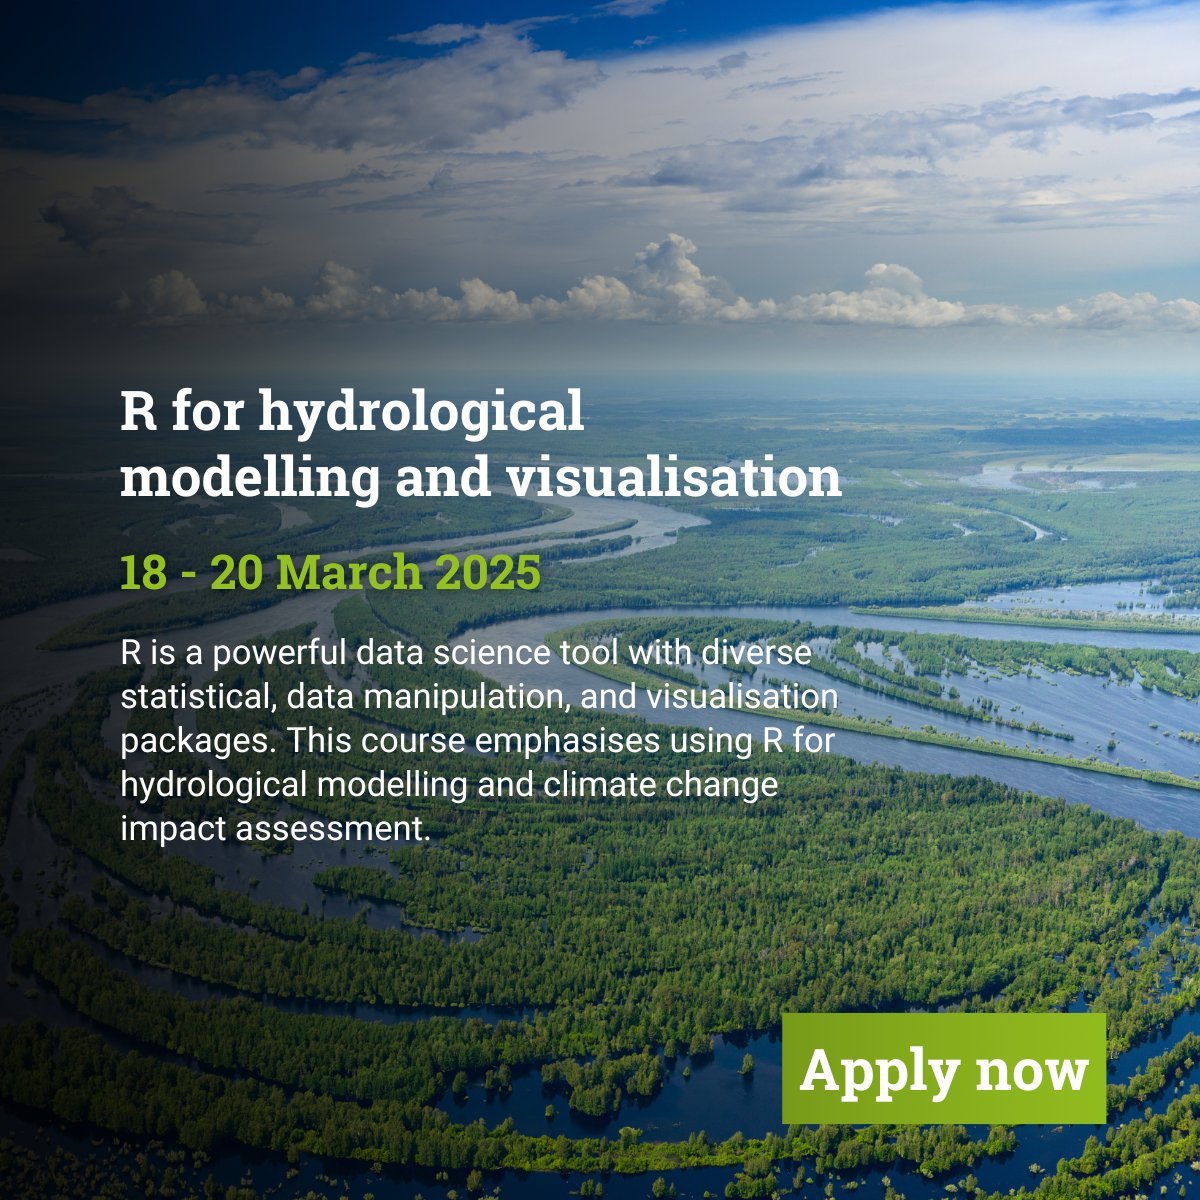
R for hydrological modelling and visualisation short course. Ideal for professionals in water that want to obtain knowledge on applied aspects of R programming in hydrological modelling. Secure your place - book today! bit.ly/48YDKgN #RProgramming #ShortCourse
Linear regression is a widely used statistical modeling technique for predicting the relationship between a dependent variable and one or more independent variables. pyoflife.com/how-to-build-l… #DataScience #rprogramming #mathematics #DataScientists #MachineLearning #codinglife
Join our academic experts on the R for Hydrological Modelling and Visualisation short course! ⌛ Three-days 📍 Cranfield campus An opportunity to obtain knowledge on applied aspects of #Rprogramming in #HydrologicalModelling. Find out more: cranfield.ac.uk/courses/short/…

Day 2 of our R Programming Workshop featured sessions on Data Visualization, a Q&A segment, and certificate distribution. Dr. Ajay Kumar Koli was felicitated for his contribution. Vote of Thanks by Dr. Harchand Ram wrapped up the event. #RProgramming #DataAnalysis
I just made exciting graphs exploring the life expectancy of West African countries from 1960-2020! Check out the code on my Github to see how I used R to analyze the data and create the visualizations. github_url : github.com/sadatyussuf/R_… #dataanalysis #Rprogramming #Rstats


Exploring the best 2023 data visualization tools in R? 📊 Dive into our comprehensive guide: datanautes.com/en/top-data-vi… #rstats #DataViz #RProgramming

Final reminder to register for the Statistics Globe online course on "Principal Component Analysis (PCA): From Theory to Application in R" before pre-sell registration closes today: statisticsglobe.com/online-course-… #rstats #rprogramming #machinelearning #datascience #statistics

Something went wrong.
Something went wrong.
United States Trends
- 1. Friendly 63.1K posts
- 2. Mac McClung 1,529 posts
- 3. SNAP 732K posts
- 4. Grokipedia 6,794 posts
- 5. Big Dom 1,968 posts
- 6. James Wiseman N/A
- 7. #JUNGKOOKXCALVINKLEIN 61.3K posts
- 8. #ChiefsKingdom 2,796 posts
- 9. Jamaica 117K posts
- 10. Jessica 28.1K posts
- 11. Riley Gaines 37.5K posts
- 12. #OTGala6 162K posts
- 13. Monday Night Football 7,421 posts
- 14. Runza N/A
- 15. Hofer 1,663 posts
- 16. MRIs 9,361 posts
- 17. Sports Equinox 14K posts
- 18. 7 Democrats 5,695 posts
- 19. Cher 17.4K posts
- 20. Game 3 61K posts